Alberta Airsheds 2020 Air Quality Report
←
→
Page content transcription
If your browser does not render page correctly, please read the page content below
Alberta Airsheds
2020 Air Quality Report

                          2020 Air Quality Report Alberta Airsheds   1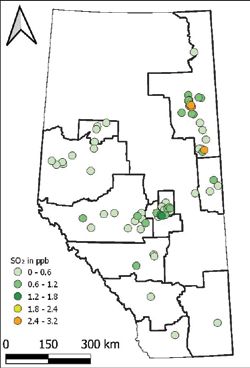
Contents
Clean Air For Albertans 		             3

Alberta Airsheds Map		                 5

2020 Air Quality Monitoring Profiles   7

		Fine Particulate Matter (PM2.5)		    8

		Nitrogen Dioxide (NO2)		             10

		Sulphur Dioxide (SO2)		              12

		Ozone (O3)		14

Air Quality And Health		               16

Working Together For Clean Air		       18

References 			                         19
Clean Air For Albertans
Air quality has significant                 As part of this outreach, the Alberta
                                            Airsheds Council has prepared this
impacts on human health
                                            2020 Alberta Airsheds Air Quality Report
and the environment.
                                            to provide a summary of the air quality
                                            data that is monitored and collected
Alberta’s Airshed organizations are key
                                            in our province by Alberta’s Airsheds.
strategic and place-based ambient air
                                            This information is important to share
monitoring organizations, implementing
                                            with Albertans because air quality
reliable and independent air quality
                                            affects our health and our environment.
monitoring for the past 20 years.
Airsheds also undertake significant         Understanding air quality and
on-the-ground community outreach            its impacts helps Albertans make
and air literacy projects in communities    educated choices related to their health.
across the province.

   WHAT IS AN AIRSHED?
   Alberta’s Airsheds are organizations
   that operate regional networks
   responsible for monitoring,
   analyzing, and educating on
   outdoor air quality. As an important        WHAT IS AIR QUALITY?
   part of Alberta’s Clean Air Strategy,       Air quality is a measure of how
   10 Airsheds were formed between             clean, or polluted, the air is.
   1996 and 2017. Refer to the map on          Monitoring air quality is important
   page 5 to see the boundaries of the 10      because polluted air can be bad for
   Alberta Airsheds.                           our health and the environment.1

                                                                       2020 Air Quality Report Alberta Airsheds   3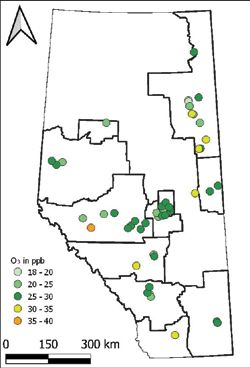
Within the 10 Alberta Airsheds there are 87 continuous monitoring stations (see
               map, page 5) and hundreds of other monitoring sites that measure a variety
               of air quality parameters using an assortment of monitoring technologies.

               AIR QUALITY PARAMETERS MONITORED BY AIRSHEDS
               •   ammonia (NH3 )                      •   nitrogen dioxide (NO2 )             •   meteorological data, including:
               •   benzene, toluene, ethylbenzene,     •   nitrogen oxides (NOX )                  •   air temperature
                   xylene (BTEX)                                                                   •   barometric pressure
                                                       •   ozone (O3 )
               •   carbon dioxide (CO2 )                                                           •   precipitation
                                                       •   polycyclic aromatic
               •   carbon monoxide (CO)                    hydrocarbons (PAH)                      •   relative humidity
               •   coarse particulate matter (PM10 )   •   sulphur dioxide (SO2 )                  •   solar radiation
               •   fine particulate matter (PM2.5 )    •   total hydrocarbons (THC)                •   wind speed and direction
               •   hydrogen sulphide (H2S)             •   total reduced sulfur (TRS)
               •   methane/non-methane                 •   total suspended particulate (TSP)
                   hydrocarbons (CH4 /NMHC)            •   volatile organic compounds
               •   nitric oxide (NO)                       (VOCs), ethylene, styrene

               MONITORING TECHNOLOGIES USED THROUGHOUT THE PROVINCE

               Continuous - Near instantaneous                               Time-Integrated - Integrated sampling
               measurements of pollutants; many                              methods, including canisters, specialized
               stations provide data for calculating                         instruments and analyzers are used
               the Air Quality Health Index (AQHI).                          for measurement of specific air quality
               Most continuous monitoring stations are                       parameters over selected time periods
               located permanently at their respective                       of minutes to hours to days.
               sites; a number of Airsheds also employ
                                                                             Micro-Sensor - Community-based sensors
               portable continuous monitoring stations
                                                                             can be used to provide an indication of
               that monitor air quality at temporary sites.
                                                                             real-time air quality at the neighbourhood
               Passive - These monitors do not                               level. Handheld or wearable air quality
               require power and consist of a series                         sensors can be utilized by the public as
               of filters and chemicals that air passes                      part of a citizen science or educational
               through and reacts with. They detect                          program to understand air quality.
               low sample amounts and provide
               monthly average measurements of
               specific air quality parameters.

4   Alberta Airsheds 2020 Air Quality Report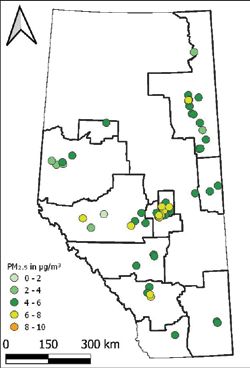
N
NORTHERN LIGHTS LIGHTS
NORTHERN
NORTHERN SUNRISE
CLEAR HILLS FORT MCMURRAY
OPPORTUNITY
PEACE RIVER
PEACE
FAIRVIEW
FAIRVIEW
SADDLE
HILLS
SPIRIT BIRCH
RIVER HILLS SMOKY
SMOKY
RIVER
RIVER BIG LAKES
BIG LAKES
GRANDE
PRAIRIE LESSER
SLAVE RIVER LAC LA
GRANDE PRAIRIE BICHE
ATHABASCA
BONNYVILLE
GREENVIEW
GREENVIEW
BONNYVILLE
WOODLANDS
SMOKY LAKE
BONNYVILLE
WOODLANDS WESTLOCK
THORHILD
BARRHEAD ST. PAUL
LAC STE. STURGEON LAMONT
LAC STE. ANNE TWO
ANNE TWO
HILLSHILLS
FORT SASKATCHEWAN
PARKLAND EDMONTON MINBURN VERMILION
YELLOWHEAD DRAYTON VALLEY RIVER
YELLOWHEAD LEDUC
BRAZEAU
BRAZEAU BEAVER
BEAVER
WETASKIWIN WETASKIWIN CAMROSE
WAINWRIGHT
PONOKA FLAGSTAFF
PONOKA
LACOMBE PROVOST
CLEARWATER STETTLER PAINTEARTH
RED DEER
RED DEER
RED DEER
MOUNTAIN
MOUNTAIN KNEEHILL
VIEW STARLAND
VIEW
BIGHORN
ROCKY VIEW ACADIA
ACADIA
CALGARY WHEATLAND
FOOTHILLS
NEWELL
VULCAN
CYPRESS
CYPRESS
WILLOW
Alberta Airsheds
CREEK
RANCHLAND
MEDICINE HAT
LETHBRIDGE
LETHBRIDGE
TABER
(July 2020)
FORTY MILE
PINCHER CREEK WARNER
MONITORING STATION CARDSTON
Km 5
0 50 100 200 300 400Across Alberta, Airsheds monitor a variety of pollutants and meteorological
conditions, including the four common pollutants of nitrogen dioxide NO2,
sulphur dioxide SO2, fine particulate matter PM2.5 and ozone O3.
These pollutants are managed in Canada through the Canadian Ambient Air Quality
Standards (CAAQS) as they can lead to smog, acid rain and health issues. Sources
of these pollutants are many and include human-made sources such as combustion
from large industries, vehicles, and individual homes, as well as natural sources such
as wildfires. This report will focus on the 2020 annual data collected for these four
common pollutants across Alberta.
FEDERAL AND PROVINCIAL HOW TO REVIEW 2020 RESULTS
GUIDELINES AND STANDARDS
The results of 2020 monitoring of common
In order to understand and protect air air pollutants (NO2, SO2, PM2.5 and O3) are
quality, ambient levels of pollutants are presented in the following sections. Data are
compared to guidelines and standards. In presented using graphs displaying annual
Alberta, this involves the Alberta Ambient averages (solid coloured bar) and a 95th
Air Quality Objectives (AAAQO), Alberta percentile marker (black line). The black lines,
Ambient Air Quality Guidelines (AAAQG) also known as “whiskers”, show readings
and the national Air Quality Management on the high end of the data collected at the
System (AQMS), which includes Canadian monitoring stations, which helps to highlight
Ambient Air Quality Standards (CAAQS) the 95th percentile data. The highest five
and regional action plan management levels percent has not been reported here as it
for each air zone. There are 1-hour, 8-hour, may contain “outliers” (observations that are
24-hour, 30-day and annual averages distant from the rest of the data that might
for AAAQOs and AAAQGs. More be caused by extreme events from upsets to
information on the guidelines natural conditions such as wildfires).
and standards can be found at
Where shown, red lines on the graphs indicate
AlbertaAirshedsCouncil.ca. This
the relevant threshold (acceptable provincial
report highlights annual data
or federal levels) for the guideline or standard
compiled from 1-hour averages to
for the air contaminant.
provide context for the measured
concentrations, which is presented as Alberta’s Air Monitoring Directive2, requires a
annual averages for each pollutant. minimum operating time of 75% or more to
calculate annual averages for air pollutants in
a given location for a given year.
6 Alberta Airsheds 2020 Air Quality Report2020
AIR QUALITY DID YOU KNOW
MONITORING
You can find historical air quality monitoring
data online in the Air Data Warehouse?
PROFILES
www.alberta.ca/alberta-air-data-warehouse.aspx
Overall, the trends of criteria pollutants in monitored areas within Alberta demonstrate
that air quality is either improving or has remained the same over the last decade.
A temperature inversion occurs when cold air becomes trapped under a layer
of warm air that acts like a lid. During temperature inversions, pollutants are
trapped at ground level where they can cause harm. The pollutants in the
cooler, lower layer cannot be dispersed and the pollutants stay concentrated
at ground level.3 In Alberta, these most frequently occur in the winter months
and lead to the formation of wintertime smog.
Airsheds strive to achieve 100% operating time; however, station relocations,
new equipment installations, or unexpected power outages are just a few
factors that affect annual operating time.
2020 Air Quality Report Alberta Airsheds 7PM 2.5
FINE PARTICULATE MATTER
Fine particulate matter is less than 2.5 micrometres in diameter.
In comparison, a human hair is about 70 micrometres in diameter.
PM2.5 2020 PM 2.5 Levels in AB
Combustion particles,
Human Hair organic compounds,
50-70µm metals, etc. ACA (AEP) - Edmonton McCauley
(microns) in diameterPM 2.5
2020 ALBERTA DATA AVERAGE PM2.5 PROFILE IN 2020
Of the 67 stations monitoring and
reporting PM2.5 data in 2020, 42 stations
collected this data at least 75% of the
total annual operating time.
Results from these stations show an
annual average range of PM2.5 levels of
1.9μg/m³ to 7.8μg/m³ in 2020. Based
on these monitoring results, there
were a total of 66 readings above the
1-hour (>80 μg/m³) AAAQG and 78
readings above the 24-hour (>29 μg/m³)
AAAQO5 for a total of 144 exceedances
(1hr+24 hr). In comparison, there were
1,298 exceedances (1hr+24hr) in 2019.
Of important note, there were fewer
wildfires experienced in 2020 than
in 2019.
Issues of concern to Albertans include health risks related to wildfire smoke
and the anticipated increase of grass/forest and seasonal fires. Most extreme
PM2.5 exceedances are attributed to wildfires with other exceedances related to
wintertime temperature inversions, localized activities, vehicle emissions
and smog.
“As Alberta’s leaders in air monitoring and reporting, Airsheds collaborate
on innovative outreach initiatives and technical expertise through the Alberta
Airsheds Council.” – AAC Co-Chairs Karla Reesor & Nadine Blaney
2020 Air Quality Report Alberta Airsheds 9NO 2
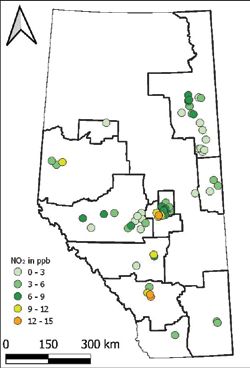
NITROGEN
DIOXIDE (NO2)
2020 NO2 Levels in AB
CRAZ - Calgary Inglewood
ACA (AEP) - Edmonton Central
ACA (AEP) - Edmonton McCauley
Nitrogen dioxide is a reddish-brown gas CRAZ - Calgary Southeast
ACA (AEP) - Edmonton East
ACA (AEP) - St. Albert
with a pungent irritating odour. It has ACA - Sherwood Park
ACA (AEP) - Edmonton South
PAMZ - Red Deer-Riverside
been linked to respiratory disease and PAZA - Grande Praire-Henry Pirker
CRAZ - Calgary-Varsity
WBEA - Barge Landing
contributes to acid rain. NO2 plays a WBEA - Fort Hills
PAMZ - Red Deer-Lancaster
major role in atmospheric photochemical
FAP - Fort Saskatchewan
FAP - Ross Creek
WCAS - Drayton Valley
reactions and ground level ozone WBEA - Fort McKay-Bertha Ganter
FAP - Range Road 220
ACA - Ardrossan
formation and destruction. WBEA - Athabasca Valley
FAP - Gibbons
WCAS - Edson
WBEA - Fort McKay South
WCAS - Hinton
The main contributors of the total NO2
Annual Alberta Ambient Air Quality Objective, 24ppb
PAS - Medicine Hat-Crescent Heights
FAP - Bruderheim1
WBEA - Patricia McInnes
emissions generated in the province AEP - Airdrie
FAP - Redwater
are transportation, oil, gas and power PAS - Medicine Hat Airporter Trap Club
WBEA - Buffalo Viewpoint
AEP - Lethbridge
generation sources6; however, any FAP - Scotford South
WCAS - Carrot Creek
PAZA - Beaverlodge
combustion sources will emit NO2 (e.g., FAP - Lamont County
WCAS - Genesee
LICA - Maskwa
home and commercial heating). Some LICA - Cold Lake South
PAZA - Wembley
FAP - Elk Island
natural sources include forest fires, WBEA - Firebag
WCAS - Violet Grove
WCAS - Meadows
lightning and biological decay. WBEA - Christina Lake
LICA - Bonnyville East station
WCAS - Tomahawk
WCAS - Breton
Short-term exposure to NO2 can cause WCAS - Wagner2
WBEA - Wapasu
PAMZ - Caroline
airway inflammation. Individuals with WBEA - Anzac
WBEA - Mackay River
LICA - St. Lina
pre-existing conditions such as asthma, WCAS - Power
WBEA - Conklin
WBEA - Surmont 2
chronic obstructive pulmonary disorder WBEA - Jackfish 2/3
WBEA - Kirby North
WBEA - Stony Mountain
(COPD) or chronic bronchitis can be WBEA - Janvier
WCAS - Steeper
PRAMP - Cadotte Lake AQHI
more sensitive to exposure.7
0 5 10 15 20 25 30 35 40 45
Annual Average NO2 + 95th percentile (ppb)
10 Alberta Airsheds 2020 Air Quality ReportNO 2
2020 ALBERTA DATA AVERAGE NO2 PROFILE IN 2020
Of the 77 stations monitoring and
reporting NO₂ data in 2020, 65 stations
collected this data at least 75% of the
total annual operating time.
Results from these 64 stations show
an average annual range of NO₂
concentrations in 2020 from 0.8ppb to
14.8ppb, all below the AAAQO of 24ppb
annual limit.
There was only one recorded exceedance
of the 1-hour AAAQO (>159 ppb) for all of
the NO₂ monitoring conducted in 2020.
Average NO₂ from the five monitoring
stations reporting the highest averages
in 2020 (all urban stations) have a
slight decrease over the 2019 average,
from 13.6ppb to 12.8ppb; however, the
95th percentile increased from 42.7ppb
to 44.0ppb.
An urban area is defined as having a population of at least 1,000 and a density
of 400 or more people per square kilometre. All territory outside an urban area
is defined as a rural area.8
2020 Air Quality Report Alberta Airsheds 11SO 2
SULPHUR
DIOXIDE (SO2) 2020 SO2 Levels in AB
WBEA - Christina Lake
WBEA - Lower Camp
Sulphur dioxide is generated both WBEA - Mannix
WBEA - Mildred Lake
naturally and by human activities,
ACA - Sherwood Park
WBEA - Buffalo Viewpoint
WBEA - Patricia McInnes
including the processing and combustion WBEA - Wapasu
WBEA - Firebag
WBEA - Waskow ohci Pimatisiwin
of fossil fuels. It is a colourless gas with a WBEA - Fort McKay South
WBEA - Fort McKay-Bertha Ganter
pungent odour (similar to a lit match). PAMZ - Caroline
ACA (AEP) - St. Albert
WBEA - Mackay River
LICA - Maskwa
SO2 reacts in the atmosphere to form
FAP - Lamont County
WCAS - Genesee
WBEA - Barge Landing
sulphuric acid and acidic aerosols, which WBEA - Jackfish 2/3
FAP - Bruderheim1
FAP - Scotford South
contribute to acid rain (SO2 accounts for ACA (AEP) - Edmonton East
WBEA - Fort Hills
about 70% of total acid rain). It combines ACA - Ardrossan
WCAS - Meadows
WBEA - Athabasca Valley
Annual Alberta Ambient Air Quality Objective, 8ppb
with other atmospheric gases to produce WBEA - Kirby North
WCAS - Hinton
WBEA - Anzac
fine particles, which may reduce visibility. WBEA - Surmont 2
WCAS - Wagner2
WBEA - Stony Mountain
FAP - Ross Creek
Brief exposure to high concentrations of WCAS - Power
FAP - Elk Island
SO2 can produce human health effects, PAZA - Smoky Heights
PAZA - Beaverlodge
WCAS - Violet Grove
irritating the upper respiratory tract FAP - Gibbons
WBEA - Conklin
and aggravating existing cardiac and
PAZA - Wembley
FAP - Fort Saskatchewan
FAP - Redwater
respiratory disease.9 WBEA - Janvier
PAMZ - Red Deer-Lancaster
PAZA - Grande Praire-Henry Pirker
PAZA - Evergreen Park
Long-term exposure may increase the WCAS - Edson
WCAS - Tomahawk
ACA (AEP) - Edmonton South
risk of developing chronic respiratory CRAZ - Calgary Southeast
WCAS - Steeper
disease. People with asthma may have
WCAS - Breton
WBEA - Fort Chipewyan
PAMZ - Red Deer-Riverside
increased symptoms such as chest WCAS - Carrot Creek
LICA - Bonnyville East station
PAZA - Donnelly
tightness and difficulty breathing. LICA - St. Lina
LICA - Cold Lake South
PRAMP - Reno
PAS - Medicine Hat-Crescent Heights
PAZA - Valleyview
AEP - Lethbridge
PRAMP - Three Creeks 842
PRAMP - Three Creeks 986
PRAMP - Cadotte Lake
0 2 4 6 8 10 12 14 16
Annual Average SO2 + 95th percentile (ppb)
12 Alberta Airsheds 2020 Air Quality ReportSO 2
2020 ALBERTA DATA AVERAGE SO2 PROFILE IN 2020
Of the 78 stations monitoring and
reporting SO₂ data in 2020, 68 stations
collected this data at least 75% of the
total annual operating time.
2020 results from these stations show
the range of SO₂ concentrations from
0.0ppb to 2.8ppb. There was a total of
four readings above the 1-hour (>172
ppb) AAAQO and one reading above the
24-hour (>48 ppb) AAAQO. There were
no readings above the 30-day or annual
objectives.
In comparison, there were no readings
above the AAAQOs in 2019.
Interested parties in Drayton Valley area (West Central Airshed Society)
were the first to organize a novel, multi-stakeholder approach to air quality
monitoring – known as the Airshed model.
2020 Air Quality Report Alberta Airsheds 1303
OZONE (O3)
2020 O3 Levels in AB
Ozone in the upper atmosphere
WCAS - Steeper
protects life on earth by filtering the WBEA - Janvier
AEP - Lethbridge
sun’s ultraviolet rays; however, O3 on the WBEA - Patricia McInnes
LICA - St. Lina
ground is a pollutant and a component
WBEA - Stony Mountain
PAMZ - Caroline
AEP - Airdrie
of smog. During hot weather, emissions PAS - Medicine Hat-Crescent Heights
WCAS - Genesee
of chemicals from automobiles, industry WCAS - Violet Grove
FAP - Bruderheim1
and other non-natural sources can LICA - Bonnyville East station
WCAS - Breton
produce high O3 levels through chemical FAP - Lamont County
WCAS - Tomahawk
reactions in the atmosphere. WBEA - Conklin
PAZA - Beaverlodge
WBEA - Fort Chipewyan
WBEA - Wapasu
People most at risk from exposure to PAZA - Wembley
CRAZ - Calgary-Varsity
higher levels of O3 include those with FAP - Redwater
WCAS - Drayton Valley
asthma, children, older adults and those FAP - Elk Island
WCAS - Carrot Creek
who are active outdoors, especially ACA - Ardrossan
LICA - Cold Lake South
outdoor workers. Children are at PAMZ - Red Deer-Lancaster
PAS - Medicine Hat Airporter Trap Club
FAP - Gibbons
greatest risk because their lungs ACA - Sherwood Park
WBEA - Anzac
are still developing.10 FAP - Fort Saskatchewan
WBEA - Buffalo Viewpoint
CRAZ - Calgary Southeast
High levels of O3 can cause the muscles in PRAMP - Cadotte Lake
WCAS - Edson
the airways to constrict, trapping air inside ACA (AEP) - St. Albert
WCAS - Hinton
the tiny air sacks within the lungs (alveoli). ACA (AEP) - Edmonton South
PAMZ - Red Deer-Riverside
ACA (AEP) - Edmonton McCauley
This can lead to wheezing, shortness of PAZA - Grande Praire-Henry Pirker
WBEA - Athabasca Valley
breath and can be serious in people with CRAZ - Calgary Inglewood
ACA (AEP) - Edmonton East
lung diseases such as asthma.10 ACA (AEP) - Edmonton Central
WBEA - Fort McKay South
WBEA - Fort McKay-Bertha Ganter
0 10 20 30 40 50 60
Annual Average O3 + 95th percentile (ppb)
14 Alberta Airsheds 2020 Air Quality Report03
2020 ALBERTA DATA AVERAGE O3 PROFILE IN 2020
Of the 57 stations monitoring and
reporting O₃ data in 2020, 50 stations
collected this data at least 75% of the
total annual operating time.
Results from these stations show the
range of O₃ concentrations in 2020 from
18.6ppb to 35.2ppb. There was a total
of two readings above the 1-hour daily
maximum (>76 ppb) AAAQO.
In comparison, there were 58 readings
above the AAAQO in 2019.
2020 Air Quality Report Alberta Airsheds 15AIR QUALITY AND HEALTH
Health Canada estimates that above-background air pollution, including
air pollution from human sources in North America, contributes to 15,300
premature deaths per year in Canada.11
Data collected by Alberta’s Airsheds contributes to the Air Quality Health Index
(AQHI), a real-time air quality rating which is reported in over 35 Alberta communities
and indicates potential health risks caused by air pollution.
The AQHI provides a rating to indicate the level of relative health risk associated
with local air quality. The higher the number, the greater the health risk and the need
to take precautions. Occasionally, during extreme pollution events such as a wildfire,
AQHI levels may reach 10 or higher, indicating a very high health risk.
Low Moderate High Very
Risk Risk Risk High
Risk
In 1968, the first monitoring station with continuous analyzers was established
in Edmonton on the 6th floor of the Federal Building by the provincial health
department - prior to the formation of an environmental department in the province.
16 Alberta Airsheds 2020 Air Quality Report2020 AQHI Ratings in Alberta
In Alberta, all monitoring stations saw low risk range of 90% to 100% of the 2020 year,
with a provincial average AQHI reading of 2.0 (based on 311,770 hours of data).
0% 25% 50% 75% 100%
CRAZ - Calgary
ACA (AEP) - Edmonton
ACA (AEP) - St. Albert
FAP - Gibbons
PAZA - Grande Praire
FAP - Bruderheim
FAP - Fort Saskatchewan
WCAS - Drayton Valley
ACA - Strathcona County
PAMZ - Red Deer
WCAS - Hinton
FAP - Redwater
AEP - Airdrie
FAP - Lamont County
AEP - Lethbridge
FAP - Elk Island
PAS - Medicine Hat
WBEA - Fort McKay
PAMZ - Caroline
WCAS - Genesee
PAZA - Beaverlodge
WBEA - Fort McKay South
LICA - St. Lina
WCAS - Steeper
WBEA - Fort McMuray
LICA - Bonnyville
WBEA - Fort Chipewyan
WCAS - Tomahawk
WBEA - Conklin
PRAMP - Cadotte Lake
WCAS - Edson
LICA - Cold Lake
PAZA - Wembley
WBEA - Janvier
WBEA - Anzac
WBEA - Stony Mountain
85% 87% 89% 91% 93% 95% 97% 99%
Low Risk Moderate Risk High Risk Very High Risk
Exposure to air pollution may result in a variety of health effects ranging from slight
discomfort to increased hospital admissions and emergency room visits, to increased
risk of premature death. In particular, individuals with respiratory and cardiovascular
conditions, children and the elderly may notice symptoms due to poor air quality
conditions. Individuals should monitor their symptoms and take precautions
recommended by their physicians.12
Download the free AQHI app on your mobile device
2020 Air Quality Report Alberta Airsheds 17WORKING TOGETHER
FOR CLEAN AIR
ALBERTA’S AIRSHEDS ARE VITAL CONTRIBUTORS
TO MANAGING AIR QUALITY.
Alberta Airsheds Council (AAC) is a partnership of Alberta’s Airsheds and provides
leadership in support of healthy air quality for Albertans and the environment.
The efforts of each of Alberta’s Airsheds ensures valuable community oversight
and involvement in our collective goal of clean air.
Resources, including links to each of Alberta’s Airsheds, can be found at:
AlbertaAirshedsCouncil.ca.
For information on local air quality monitoring and programs in your community,
contact your regional Airshed.
PEACE RIVER AREA MONITORING PROGRAM
AlbertaAirshedsCouncil.ca | @albertaairsheds
18 Alberta Airsheds 2020 Air Quality ReportREFERENCES
1
https://scijinks.gov/air-quality/
2
https://www.alberta.ca/air-monitoring-directive.aspx
3
https://www.canada.ca/en/environment-climate-change/services/air-pollution/issues/smog-causes-
effects/winter.html
4
https://www.canada.ca/content/dam/eccc/documents/pdf/aqhi/20181205-03.pdf
5
https://open.alberta.ca/dataset/0d2ad470-117e-410f-ba4f-aa352cb02d4d/resource/97d1afdf-b66b-
4805-be41-a5a3f589c988/download/aaqo-summary-jun29-2017.pdf
6
https://www.canada.ca/en/environment-climate-change/services/environmental-indicators/air-
pollutant-emissions.html#NOx
7
https://www.canada.ca/en/health-canada/services/publications/healthy-living/human-health-risk-
assessment-ambient-nitrogen-dioxide.html
8
https://www.statcan.gc.ca/eng/subjects/standard/pcrac/2016/introduction
9
https://www.canada.ca/en/health-canada/services/publications/healthy-living/human-health-risk-
assessment-sulphur-dioxide-executive-summary.html
10
https://www.epa.gov/ground-level-ozone-pollution/health-effects-ozone-pollution
11
https://www.canada.ca/en/health-canada/services/publications/healthy-living/2021-health-effects-
indoor-air-pollution.html
12
Alberta Health – Be Air Aware (https://bit.ly/3crT09S)
2020 Air Quality Report Alberta Airsheds 19Contact Us AlbertaAirshedsCouncil.ca Follow Us @albertaairsheds
You can also read