Is India Ready to Address its Biggest Public Health Challenge? Forecasts from the Publicly Available Data on COVID-19
←
→
Page content transcription
If your browser does not render page correctly, please read the page content below
Int J Med. Public Health. 2020; 10(4):226-230.
A Multifaceted Peer Reviewed Journal in the field of Medicine and Public Health                                                                             Case Report
www.ijmedph.org | www.journalonweb.com/ijmedph

Is India Ready to Address its Biggest Public Health Challenge?
Forecasts from the Publicly Available Data on COVID-19
Ramesh Athe, Rinshu Dwivedi*, Nagapraveen Modem

                                                                ABSTRACT
                                                                Background: The COVID-19 pandemic in India has become the biggest public health
                                                                challenge. If we go by the number of confirmed cases and casualties, the situation seems to
                                                                be a matter of grave concern. The lock-down measures and social-distancing practices have
                                                                played an important role in impeding the spread of COVID-19. However, accurate forecasting
                                                                is required to prepare the healthcare-system for future plan-of-action. Objectives: The present
                                                                study aims to predict the trends in the outbreak of COVID-19 in India, by forecasting on the
                                                                basis of publicly-available data. Methods: The data has been obtained from https://www.
                                                                covid19india.org, https://www.worldometers.info/coronavirus and ICMR reported publicly-
                                                                available information on COVID-19. The number of confirmed cases are growing exponentially
                                                                as per the real-time-data. For forecasting the trends in terms of confirmed, active, recovered,
                                                                and death cases by using the autoregressive-integrated-moving-averages (ARIMA) model.
                                                                Results: Findings reveal the estimated value of the point-forecast for total confirmed, active,
                                                                recovered, and death cases. Estimates indicate that the total confirmed cases were increasing
                                                                at the rate of 3.48%, active cases at 2.92%, recovered cases at 4.09% and death cases at the
                                                                rate of 3.51% daily across the country. It was also observed that the death rate was lower for
                                                                the states and union territories with a higher detection rate. Conclusion: Substantial public
                                                                health interventions were implemented immediately by the Government of India to control
                                                                the spread of COVID-19. Due to the shortage of healthcare resources in the country, early
                                                                detection is imperative along with accurate forecasting. It will help in reducing the associated
                                                                cost of acute care for the majority of infected cases and unnecessary burden on the healthcare
                                                                system.
                                                                Key words: Coronavirus Disease (COVID-19), Forecasting, ARIMA, Public-health,
                                                                Emergency-preparedness, India.

                                                        INTRODUCTION
                                                        A larger number of individuals and animals have been          diarrhoea, which are quite similar to the common
                                                        affected worldwide over the past two decades with             cold conditions. A pooled analysis of 181 confirmed
Ramesh Athe, Rinshu                                     three epidemics caused by the family of coronavirus           cases of COVID-198 estimated the mean incubation
Dwivedi*, Nagapraveen                                   (Severe Acute Respiratory Syndrome (SARS)-2003,               period to be between 5.1 to 11.5 days. The majority
Modem                                                   Middle East Respiratory Syndrome (MERS)-2012                  of COVID-19 patients have a self-limiting infection
Indian Institute of Information                         and Coronavirus Disease (COVID-19).1-3 However,               and they do recover over time. However, in severe
Technology, Dharwad, Karnataka,
                                                        significant genetic variations have been recorded             cases, about 10% of these infected cases may require
INDIA.
                                                        among the pathogens of these three epidemics,                 admission in the intensive care units (ICUs) and
Correspondence                                          especially between MERS and COVID-19.4 Initially              some of them may also die.
Dr. Rinshu Dwivedi                                      the Middle East, Saudi Arabia and China5,6 were               The elderly population, people with lower immunity
Assistant Professor, Indian Institute of                the hotspots for these epidemics where animals to             and with prior medical conditions are more prone
Information Technology, Trichy-620015,
                                                        human transmission cases were recorded. Later, these          to COVID-19. As per WHO, the majority of the
Tamil Nadu, INDIA.
Mobile no: +91 7683981979                               pathogens were transmitted from human to human in             casualties have occurred among the older age
Email: rinshudwivedi999@gmail.com                       other countries. The outbreak of COVID-19 was first           population, or people with at least one comorbidity;
History                                                 reported from Wuhan, China in December, 2019.7 In             particularly cardiovascular diseases/hypertension,
• Submission Date: 21-05-2020                           March, 2020 it was declared as a pandemic by WHO              diabetes and other chronic underlying conditions.
• Revised Date: 16-07-2020
                                                        due to huge upsurge in the number of reported cases           Though the other segment of the population is not
• Accepted Date: 25-08-2020
                                                        for COVID-19 as compared to SARS and MERS.                    invincible and people who are practicing even social
DOI : 10.5530/ijmedph.2020.4.47                         The common symptoms associated with COVD-19                   distancing (1 meter or 3 feet) or self-quarantine need
                                                        are; fever, tiredness and dry cough. Some people have         to follow a healthy lifestyle. Practicing good sanitary
Article Available online
http://www.ijmedph.org/v10/i4                           also experienced symptoms such as nasal congestion,           habits such as washing the hands frequently, avoiding
                                                        running nose, body pain, sore throat, cough and               repeated contact with face, nose and mouth can
Copyright
© 2020 Phcog.Net. This is an open-
access article distributed under the terms                Cite this article : Athe R, Dwivedi R, Modem N. Is India Ready to Address its Biggest Public Health Challenge?
of the Creative Commons Attribution 4.0
                                                          Forecasts from the Publicly Available Data on COVID-19. Int J Med Public Health. 2020;10(4):226-30.
International license.

International Journal of Medicine and Public Health, Vol 10, Issue 4, Oct-Dec, 2020                                                                                       226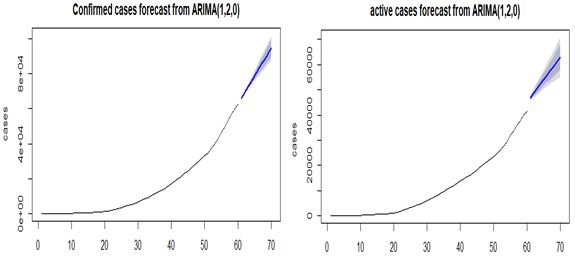
Athe, et al.: Forecasts from the Publically Available Case Data on the Coronavirus Disease (COVID-19)
also help in avoiding the infection. There are two important stages of time-consuming. Steps for auto ARIMA are: Loading the data and pre-
COVID-19 i.e. stage II and III. In stage II, the transmission takes place processing it to fit the ARIMA model. Then we predict the values on the
due to interaction with infected individuals, while in stage III, there is validation set and calculate the RMSE.
community spread.9 The auto-regressive (AR) component ‘p’ represents the number of lags
The first case of the COVID-19 in India was reported in January 2020. used in the previous values of the regression equation for series Y. The
Being the second-largest populated country with resource constraints, equation for the model is:
the case detection for COVID-19 was initially low.10,11 There were also Yt=c+∅1Yt-1+∅2Yt-2+et
variations in the predicted estimates of total infected cases. On March 22,
Where the parameters of the model are ∅1 and ∅2.
2020, a fourteen hour voluntary public curfew was observed throughout
India which was later followed by the lockdown of 75 districts from where The model components are given as follows where ‘d’ represents the
any confirmed cases have been reported. The country has introduced the degree of differencing that is, d times differencing its current and previous
first phase of complete lockdown for 21 days amidst rapidly increasing values in the series to stabilize when the assumption of stationary is not
confirmed cases on March 24, 2020, to control the sustained risk of fulfilled. A moving average (MA) is represented by ‘q’ which indicates the
further spread across the nation. All educational institutions have been order of number of terms included in the model and estimates the model
closed and tourist visas have been cancelled. All modes of transportation error by combining the previous error term(s) et.
and the majority of commercial establishments have been also shut Yt=c+ θ1et-1+θ2et-2+...+ θq et-q+et
down to avoid the spread. However, the country has further extended Non-seasonal ARIMA model components such as differencing, moving
the lockdowns for the second and third phases as well. averages and auto-regressive lags can be rewritten in the form of linear
As per the available data from the Ministry of Health and Family equation as:
Welfare (MoHFW), the country has a total of 47480 confirmed cases, Yd=c+ ∅1ed t-1+ ∅2 ed t-2+...+θ1et-1+ ∅q et-q+et
along with 24385 recoveries and 2415 deaths on May 13, 2020 (MoHFW
Where Yd is Y-differenced ‘d ‘times and ‘c’ is constant.
COVID-19).12-14 According to real-time data, confirmed COVID-19
cases are growing exponentially. As our healthcare system is preparing However certain limitations are associated with the ARIMA models,
itself for its biggest battle to treat the infected cases, accurate forecasting’s such as its dependency on existing series of values to forecast the
can guide us to prepare the future strategies to manage the existing and projected constant series of estimated values, which requires a long and
expected number of cases. This forecasting dissemination can play a stable series of data. Also, these models merely explain the approximated
crucial role in briefing the governments and healthcare professionals historical patterns rather than providing any interpretation for the
regarding the measures to implement for better adherence among underlying structure of data mechanisms. The R software (ARIMA
the public. The publicly available data has been used for the present module) was used to analyze the data.19
study to estimate the predicted cases across the country by using the
autoregressive-integrated-moving-averages (ARIMA) model. We have RESULTS
assumed that publically available daily case data is legitimate, except Estimates from the present study reports that the total number of
reporting biases if any. The objective is not to attempt for meticulous COVID-19 cases in India could be approximately 94682 (95% CI:
precision but to merely provide useful insights on the COVID-19 87362.22, 102000.46) as on May 19, 2020. The predicted confirmed and
scenario in India. active cases from May 10 to May 19, 2020, are presented in Table 1. The
total confirmed cases will be increasing approximately at the rate of 3.48%
MATERIALS AND METHODS
and active cases at the rate of 2.92% (62975; 95% CI: 55099.38, 70852.12)
Present study has drawn the data from publicly available secondary daily, due to COVID-19. For recovered cases, the rate of increase will be
sources (https://www.covid19india.org; https://www.worldometers.info/ at 4.09% (31774; 95% CI: 28834.37, 34714.30) and for death cases, it will
coronavirus/; Ministry of Health and Family Welfare (MoHFW) and increase at 3.51% (3183; 95% CI: 2852.86, 3513.44) (Table 2).
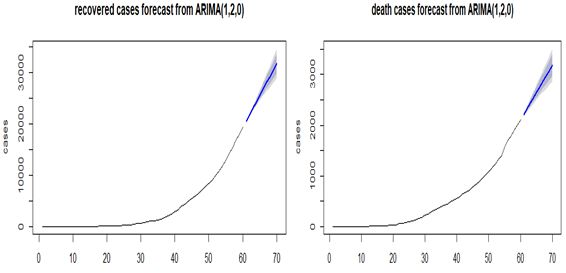
Indian Council of Medical Research (ICMR) reports) on COVID-19 The number of confirmed and active cases of COVID-19 are depicted by
confirmed, active, recovered and death cases.12-14 Based on the available Figure 1(a) and 1(b). The red colour curve indicates the cases from March
literature, the average duration between the onset of symptoms and in
11, 2020, to May 9, 2020, based on the actual data for the confirmed and
the case where no recovery takes place, the death may occur in 14 days.15
active cases. This data has been used as a base for predicting the number
Data was collected and analyzed from inception to May 9, 2020, by using
of confirmed and active cases in India, which was portrayed via the blue
the ARIMA model. This model is one of the popular statistical methods
colour trend line i.e. predicted region. It is predicting the number of
for time-series forecasting.16 The model uses the weighted averages
confirmed and active cases from May 10 to May 19, 2020 in India. As per
of most recently-existing past values in the series to forecast the new
the predictions, the count of confirmed and active cases in India will fall
values. However, as the observations get older (in time), the importance
in the predicted region. Here, Y-axis represents the number of confirmed
of forecasted values gets exponentially smaller. A univariate time-series
model has been used to forecast the daily confirmed, active, recovered, cases and X-axis represents the days from March 11, 2020, to May 19,
and death cases in India from May 10 to May 19, 2020. The pattern of 2020. Similarly, recovered and death cases were depicted in Figure 2(a)
forecasted regressive curves were consistent with the actual values, hence and 2(b).
the fitted ARIMA model was acceptable for the non-seasonal data.17,18
DISCUSSION
Steps to implement ARIMA are: first loading the data and pre-processing
it, along with making the time series stationary. Later, we determine the The COVID-19 pandemic in India has become a public health threat and
d-value and create an auto-correlation function (ACF) and partial auto- as per the forecasts, the situation seems to be a matter of serious concern.
correlation function (PACF) plots. After determining the p and q values, This novel virus represents a tremendous challenge for the public health
we fit the ARIMA model. Lastly, we predict the values on the validation scenario in India, as neither, we have a vaccine nor we have a medication
set and calculate the root mean square error (RMSE). However, ARIMA to treat this virus. The present study emphasizes that accuracy in the
makes the task easier as it eliminates the steps from 6 to 3, which were forecasting’s will not only help in timely detection and required care,
International Journal of Medicine and Public Health, Vol 10, Issue 4, Oct-Dec, 2020 227Athe, et al.: Forecasts from the Publically Available Case Data on the Coronavirus Disease (COVID-19)
Table 1: Forecasting estimates of confirmed and active cases from the ARIMA method.
Date Confirmed cases Active cases
Point 95% confidence intervals Point 95% confidence intervals
estimate estimate
10 May 2020 66025.82 65506.97 66544.66 46874.00 45568.22 48179.78
11 May 2020 69196.07 68240.64 70151.50 48637.84 46180.50 50465.17
12 May 2020 72387.91 70859.85 73915.96 50445.14 48018.32 52871.96
13 May 2020 75569.95 73404.54 77735.36 52226.32 49157.41 55295.23
14 May 2020 78756.44 75876.91 81635.96 54023.20 50257.46 57788.95
15 May 2020 81940.91 78285.43 85596.39 55810.65 51305.59 60315.70
16 May 2020 85126.29 80634.58 89618.01 57603.76 52314.58 62892.94
17 May 2020 88311.27 82928.39 93694.14 59393.47 53280.44 65506.50
18 May 2020 91496.42 85170.14 97822.71 61185.22 54208.93 68161.52
19 May 2020 94681.50 87362.53 102000.46 62975.75 55099.38 70852.12
Table 2: Forecasting estimates of recovered and death cases from the ARIMA method.
Date Recovered cases Death cases
Point 95% confidence intervals Point 95% confidence intervals
estimate estimate
10 May 2020 20531.92 20352.03 20711.81 2209.21 2176.74 2241.69
11 May 2020 21781.07 21486.31 22075.84 2317.43 2260.60 2374.26
12 May 2020 23030.23 22536.55 23523.92 2425.65 2342.42 2508.87
13 May 2020 24279.39 23533.94 25024.84 2533.86 2421.86 2645.86
14 May 2020 25528.55 24491.42 26565.67 2642.08 2498.94 2785.21
15 May 2020 26777.70 25415.23 28140.17 2750.29 2573.78 2926.79
16 May 2020 28026.02 26309.12 29744.60 2858.51 2646.50 3070.51
17 May 2020 29276.02 27175.70 31376.34 2966.72 2717.19 3216.25
18 May 2020 30525.18 28016.92 33033.43 3074.93 2785.95 3363.92
19 May 2020 31774.33 28834.37 34714.30 3183.15 2852.86 3513.44
(a) Recovered cases (b) Death cases
Figure 1: Forecasting estimates of recovered and death cases through the ARIMA method.
but also to reduce the associated cost of providing critical care to these approximately tallying with actual Figures with some minor variation.
patients and overcrowding of the limited healthcare resources. These estimates may guide us for improved and high detection rates,
The estimated forecasts from the present study have been cross-verified which may enhance the testing capacity of the country which is
with the actual cases reported on May 10-11, 2020 and they were essentially required. Late detection may put the cases in a greater need for
228 International Journal of Medicine and Public Health, Vol 10, Issue 4, Oct-Dec, 2020Athe, et al.: Forecasts from the Publically Available Case Data on the Coronavirus Disease (COVID-19)
(a)Confirmed cases (b) Active cases
Figure 2: Forecasting estimates of confirmed and active cases through the ARIMA method.
ventilation and ICU care, which imposes a significant economic burden was written by the RD and RA. All the authors have read and approved
on the healthcare system.20 It was also observed that there is a need for the manuscript.
the study based on the clinical characteristics of the deceased due to
COVID-19 to help the epidemiologists and public health practitioners REFERENCES
to address the concerns more effectively. As per the available literature, 1. Yang Y, Peng F, Wang R, Guan K, Jiang T, Xu G, et al. The deadly coronaviruses:
The 2003 SARS pandemic and the 2020 novel coronavirus epidemic in China.
the health care workers have also reported contracting the disease and Journal of Autoimmunity. 2020;102434.
some have died also. These people are working in challenging conditions, 2. Kerkhove MDV, Peiris MJ, Malik MR, Embarek BP. Interpreting results from
with fewer resources.21,22 They need to be supported with adequate environmental contamination studies of Middle East respiratory syndrome
coronavirus. Clinical Infectious Diseases. 2016;63(8):1142.
training and resources, therefore the preparations of the health facilities,
3. Hilgenfeld R, Peiris M. From SARS to MERS: 10 years of research on highly
equipped with adequate resources are a must for creating a conducive pathogenic human coronaviruses. Antiviral Research. 2013;100(1):286-95.
environment for health professionals to work efficiently. These challenges 4. Kolifarhood G, Aghaali M, Saadati HM, Taherpour N, Rahimi S, Izadi N, et al.
Epidemiological and clinical aspects of Covid-19: A narrative review. Archives of
can be addressed to a large extent if we can estimate the growth of Academic Emergency Medicine. 2020;8(1).
future cases accurately by forecasting.23 It will not only help the health 5. Sutton TC, Subbarao K. Development of animal models against emerging
professional but also strengthen the readiness of the healthcare system coronaviruses: From SARS to MERS coronavirus. Virology. 2015;479:247-58.
and administrative officials to make suitable decisions. 6. Wu T, Perrings C, Kinzig A, Collins JP, Minteer BA, Daszak P. Economic growth,
urbanization, globalization and the risks of emerging infectious diseases in
Rapid assessments and clinical trials are also critical to control the China: A review. Ambio. 2017;46(1):18-29.
risk and to ensure efficient utilization of the available resources. No 7. Wu Z, McGoogan JM. Characteristics of and important lessons from the
coronavirus disease 2019 (COVID-19) outbreak in China: Summary of a report
doubt, substantial public health interventions have been immediately of 72 314 cases from the Chinese Center for Disease Control and Prevention.
implemented by the Government of India; there is a need for improved Jama. 2020;323(13):1239-42.
preparedness plans and mitigation strategies for rapid deployment. The 8. Lauer SA, Grantz KH, Bi Q, Jones FK, Zheng Q, Meredith HR, et al. The
incubation period of coronavirus disease 2019 (COVID-19) from publicly
delay in required actions often converts a manageable health emergency reported confirmed cases: Estimation and application. Annals of Internal
condition into a miserably overburdened healthcare system.24,25 Medicine. 2020;172(9):577-82.
Ultimately, people have to understand the severity of the disease and 9. Anderson RM, Heesterbeek H, Klinkenberg D, Hollingsworth TD. How will
country-based mitigation measures influence the course of the COVID-19
respect these restrictions implemented by the government in terms epidemic?. The Lancet. 2020;395(10228):931-4.
of lockdown and other restrictions to help in reducing the growth 10. Singhal T. A review of coronavirus disease-2019 (COVID-19). The Indian Journal
of further infections. As the spread of the disease is getting severe, it’s of Pediatrics. 2020;1-6.
11. Dikid T, Jain SK, Sharma A, Kumar A, Narain JP. Emerging and re-emerging
important to protect yourself and your families and most importantly infections in India: An overview. The Indian Journal of Medical Research.
your community as an act of solidarity. 2013;138(1):19.
12. Ministry of Health and Family Welfare (MoHFW), COVID-19 India, Government
ACKNOWLEDGEMENT of India. COVID-19; https://www.mohfw.gov.in/
13. Coronavirus Outbreak in India, A crowd sourced initiative. https://www.
Authors Acknowledge the Government of India, open data sources and covid19india.org, 2020.
14. COVID-19 Coronavirus Pandemic. https://www.worldometers.info/
others through which this study became possible.
15. Cascella M, Rajnik M, Cuomo A, Dulebohn SC, DiNapoli R. Features, evaluation
and treatment coronavirus (COVID-19). In Statpearls. 2020. StatPearls
CONFLICT OF INTEREST Publishing.
16. Pankratz A. Forecasting with univariate Box-Jenkins models: Concepts and
All the authors declare that they have no conflict of interest. cases. John Wiley and Sons. 2009.
17. Dhanwant JN, Ramanathan V. Forecasting COVID 19 growth in India using the
Author’s contribution Susceptible-Infected-Recovered (SIR) model. arXiv preprint arXiv:2004.00696.
2020.
RA and RD conceptualized the study; data has been collected by RA and 18. Bhattacharyya A, Bhowmik D, Mukherjee J. Forecast and interpretation of daily
PKM. Analysis has been carried out by RA and PKM. The manuscript affected people during 21 days lockdown due to COVID 19 pandemic in India.
International Journal of Medicine and Public Health, Vol 10, Issue 4, Oct-Dec, 2020 229Athe, et al.: Forecasts from the Publically Available Case Data on the Coronavirus Disease (COVID-19)
Med Rxiv. 2020. pandemic. Indian Journal of Ophthalmology. 2020;68(5):939.
19. Hyndman RJ, Khandakar Y. Automatic time series for forecasting: the forecast 23. Sharma SN, Singh SK. Challenges and Threats due to Deadly Corona Virus
package for R. Clayton VIC, Australia: Monash University, Department of in India and Dealing it with Social Vaccine (distancing)-the the Only Weapon.
Econometrics and Business Statistics. 2007. Journal of Communicable Diseases (E-ISSN: 2581-351X and P-ISSN: 0019-
20. Angarai R, Sharma K. The need to redesign the hospital ICUs for Covid-19 5138). 2020;52(1):7-13.
patients to save the medical fraternity. 24. Nadim SS, Ghosh I, Chattopadhyay J. Short-term predictions and
21. Ferguson N, Laydon D, Nedjati GG, Imai N, Ainslie K, Baguelin M, et al. Report prevention strategies for COVID-2019: A model-based study. arXiv preprint
9: Impact of non-pharmaceutical interventions (NPIs) to reduce COVID19 arXiv:2003.08150. 2020.
mortality and healthcare demand. 25. Sohrabi C, Alsafi Z, O’Neill N, Khan M, Kerwan A, Al-Jabir A, et al. World
22. Pandey SK, Sharma V. A tribute to frontline corona warriors––Doctors who Health Organization declares global emergency: A review of the 2019 novel
sacrificed their life while saving patients during the ongoing COVID-19 coronavirus (COVID-19). International Journal of Surgery. 2020.
Cite this article : Athe R, Dwivedi R, Modem N. Is India Ready to Address its Biggest Public Health Challenge? Forecasts from the Publicly Available Data on
COVID-19. Int J Med Public Health. 2020;10(4):226-30.
230 International Journal of Medicine and Public Health, Vol 10, Issue 4, Oct-Dec, 2020You can also read