Predicting On-Street EV Charging Demand: A Case Study using the City of Worcester - Cenex
←
→
Page content transcription
If your browser does not render page correctly, please read the page content below
Predicting On-Street EV Charging Demand 1
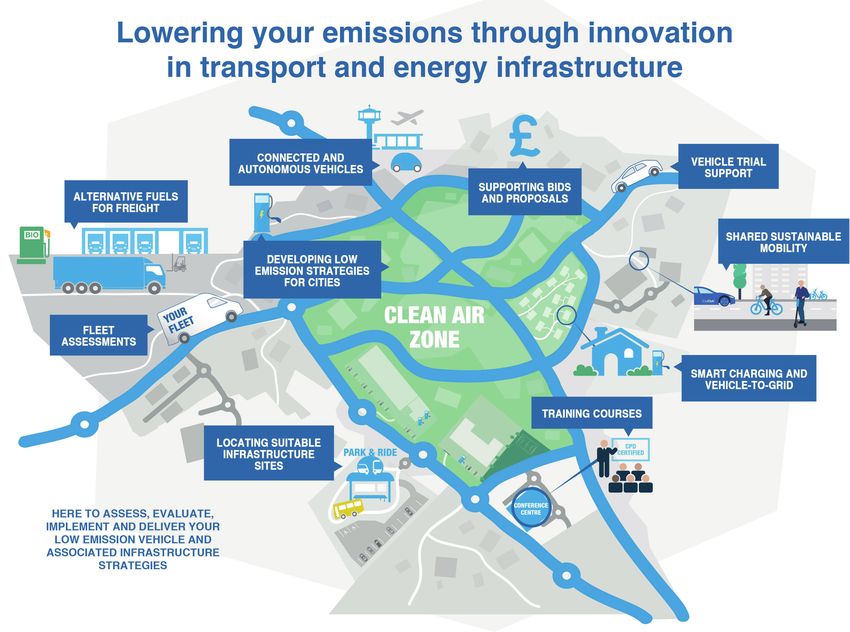
Lowering your emissions
through innovation in transport
and energy infrastructure
Predicting On-Street
EV Charging Demand:
A Case Study using the
City of Worcester
July 2021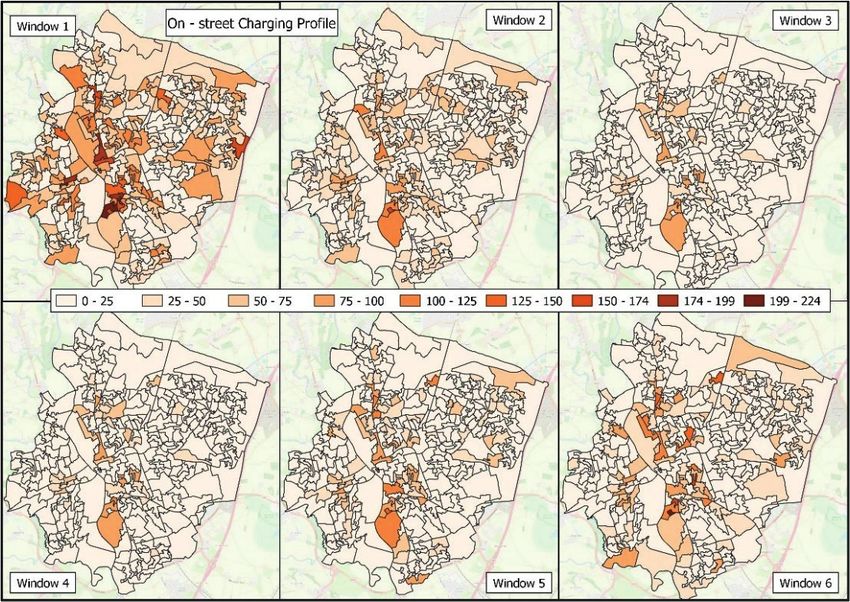
2   Predicting On-Street EV Charging Demand

Contents

             Introduction to Cenex.......................................................................................3

             Executive Summary.......................................................................................... 4

             Electric Vehicles, Charging, and the On-Street Challenge ...................5

             Methodology....................................................................................................... 8

             Results.................................................................................................................. 10

             Further Work........................................................................................................14

             The VPACH2 Project......................................................................................... 15

             References...........................................................................................................16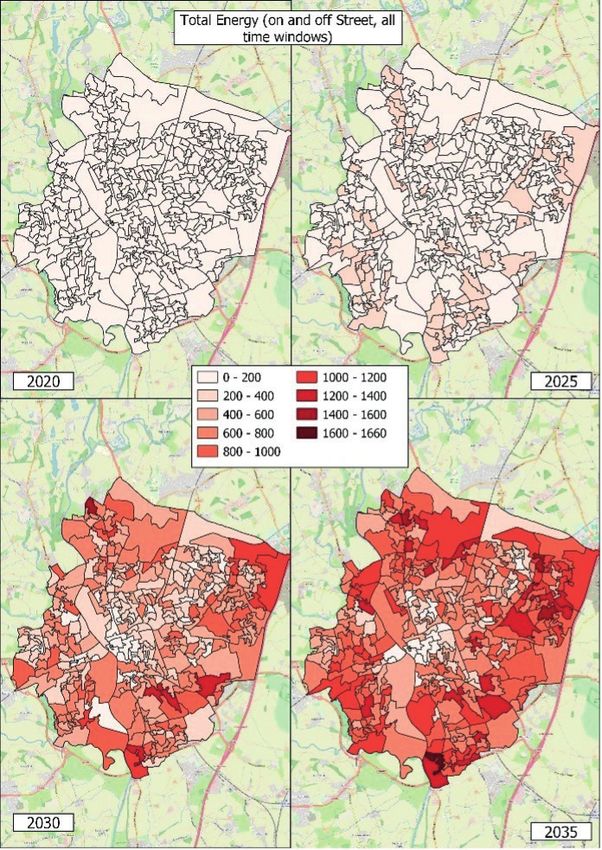
Predicting On-Street EV Charging Demand   3

Introduction to Cenex

Cenex was established in 2005
as the UK’s Centre of Excellence                                                                 Lowering your emission
for Low Carbon and Fuel Cell                                                                     through innovation in tra
                                                                                                 and energy infrastructur
technologies.

Today, Cenex focuses on low emission transport &                                     Predicting O
                                                          Finally, as trusted advisors with expert knowledge, we

                                                                                    EV Charging
associated energy infrastructure and operates as          are the go-to source of guidance and support for public
an independent, not-for-profit research technology        and private sector organisations along their transition
organisation (RTO) and consultancy, specialising in       to a zero-carbon future and will always provide you
the project delivery, innovation support and market
                                                                                         A Case Study
                                                          with the insights and solutions that reduce pollution,
development.                                              increase efficiency and lower costs.

Our independence ensures impartial, trustworthy           To find out more about us and the workCity    of Wo
                                                                                                that we do,
advice, and, as a not-for-profit, we are driven by the    visit our website: www.cenex.co.uk
outcomes that are right for you, your industry and your
environment, not by the work which pays the most or
favours one technology.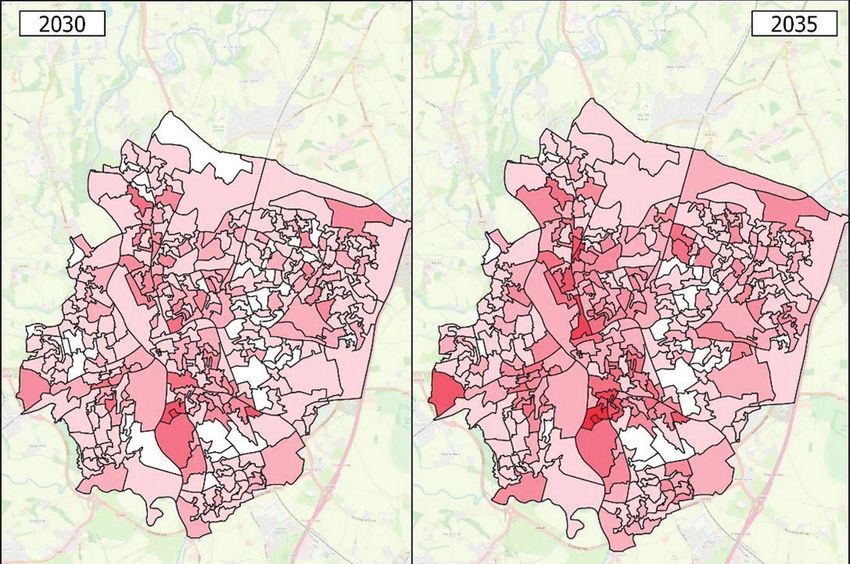
4   Predicting On-Street EV Charging Demand

Executive Summary

The EVEREST model (Electric Vehicle Energy          EVEREST enhances the precision and scale of
Resource ESTimator), developed by Cenex as          Cenex’s advice to local authorities and chargepoint

part of the Virgin Park And CHarge (VPACH2)         network operators (CPNO) as to where and when on-
                                                    street EV charging is going to be required, based on
project, predicts the amount of public charging
                                                    real data and configurable assumptions.
infrastructure that needs to be deployed to
support and facilitate the expected uptake rates
                                                    This report demonstrates the capabilities of EVEREST
for privately used Electric Vehicles (EVs) as the   and how the results fit into a wider strategy; using the
road transport industry electrifies.                city of Worcester – part of Worcestershire County
                                                    Council, who are a partner within the VPACH2
                                                    consortium – as a case study.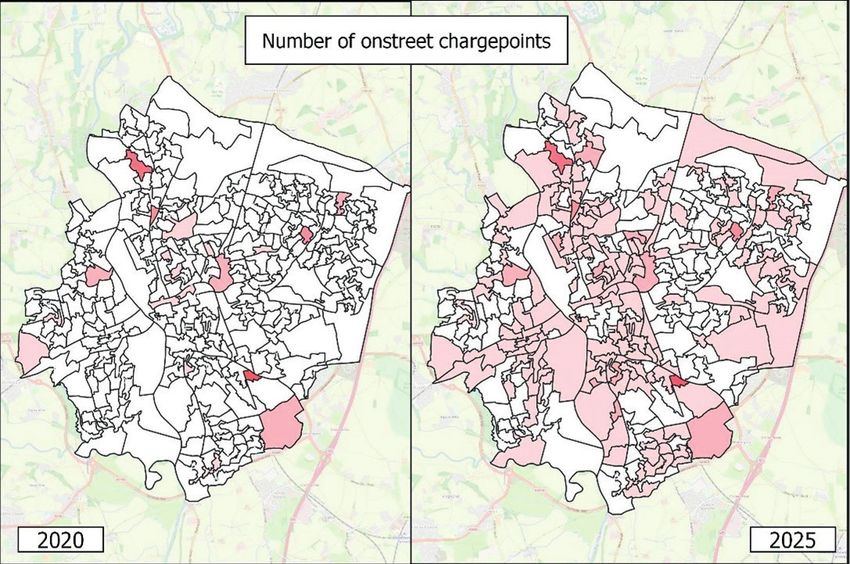
Predicting On-Street EV Charging Demand   5

Electric Vehicles and Environmental Policy

The UK has a legally-binding commitment
to reach net-zero carbon emissions by
2050 and EVs are a key part of the plan
to achieve this.

On 18th November 2020 the UK Government                        This action is being implemented to tackle
published a 10-point action plan for a “Green Industrial       two environmental issues:
Revolution”; the fourth point of which includes:

                                                               1. Environment and Climate Change

“transforming our                                              The UK’s ten warmest years all occurred since
                                                               20022, reflecting a global heating which is considered

national infrastructure                                        “extremely likely” to have been caused by the
                                                               increasing levels of carbon dioxide (CO2) being
to better support                                              emitted into the atmosphere3.

electric vehicles”.1                                           The latest Committee on Climate Change report
                                                               shows that transportation is now the worst-performing
                                                               sector in the country and emissions have risen in four
                                                               of the five most recent years4.
In the accompanying documentation, the UK confirmed
it would end the sale of new petrol and diesel cars            According to the Decarbonising Transport report,
and vans by 2030, ten years earlier than the UK’s              “there is no plausible path to net-zero without major
previous Industrial Strategy as laid-out in the Road           transport emissions reductions”.
to Zero publication. Furthermore, the sale of hybrid
cars and vans that can drive a significant distance with
                                                               2. Society and Public Health
no carbon dioxide coming from the tailpipe would be
prevented from 2035 onwards.                                   Poor air quality is now the largest environmental risk
                                                               to UK public health5. The enquiry into the death of Ella
                                                               Kissi Debrah listed air pollution as an official cause of
                                                               death for the first time in the UK6 and a recent study
                                                               highlighted that a child living within 50 m of a major
                                                               road could have their lung growth stunted by up to 8%
                                                               due to air pollution7.

                                                               The transition to electric vehicles is key to improving
                                                               air quality in urban areas and avoiding all of the direct
                                                               and indirect health issues it can cause.

Warming Stripes: Annual global temperatures from 1850-2017 8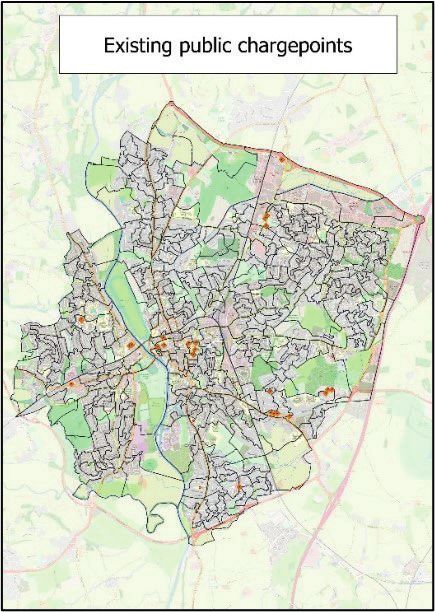
6    Predicting On-Street EV Charging Demand

Electric Vehicle Charging and the On-Street Challenge

EVs are fundamentally different to the internal             Historically, public charging has focused on providing
combustion engine (ICE) vehicles that they are              high powered (‘Rapid’) charging. As electricity is
replacing in terms of how they are “refuelled”. While       taxed at different rates dependent on whether it is
safety requirements around handling of petrol and           used domestically (5%) or commercially (20%), using
diesel means that ICE vehicles refuelling is limited        public charging is inherently more expensive than
to ‘forecourt’ locations, electric vehicles can be          recharging at home. However, taking into account
recharged almost anywhere that an electrical supply         that high powered public charging also requires more
is available.                                               expensive technology, as well as typically needing
                                                            some amount of civil works, the costs of public
Current battery technology means that the range of an       charging infrastructure can be anywhere from 60% to
EV is often lower than the ICE equivalent, meaning that     300% more expensive than charging at home. Those
the vehicle needs to be recharged more frequently.          without access to off-street parking are therefore the
However, the infrastructure required for recharging is      ones most exposed to this price discrepancy.
simpler than that needed for petrol or diesel refuelling
and therefore there is much greater flexibility in where
and when an EV is recharged.
                                                            It is estimated that approximately 40%
The transition to electric vehicles is still in the early   of UK households do not have access
adopter phase and there are a number of challenges to       to off-street parking at home, most
address to ensure that a robust charging infrastructure     of whom are in urban areas with air
network is in place to support a transport system
                                                            quality issues where EVs are most
where EVs are mainstream. One of these challenges
is ensuring that charging a vehicle is available and
                                                            needed.
equitable for all drivers. This problem was not as
pronounced for ICE vehicles – regional price
                                                            As the EV charging industry develops, a wider range of
variations were reasonably small other than at
                                                            public charging technologies have become available,
premium motorway prices and even in the extremely
                                                            enabling more options to be provided to support the
rural areas fuel stations are accessible, although they
                                                            recharging needs of those without access to off-street
may be slightly more expensive.
                                                            parking. Each technology has its own advantages
                                                            and disadvantages, which means that the technology
For EV charging the difference is more visible. In
                                                            selection is dependent on the location and duration
effect, the divide is between those with access to off-
                                                            that a vehicle is at that location.
street parking at home and those without. Those with
off-street parking – which accounts for the majority of
early adopters – can deploy their own EV chargepoint
to charge their vehicle at home using their home
energy tariff. By contrast, those without access to off-
street parking are purely reliant on using the public
charging network.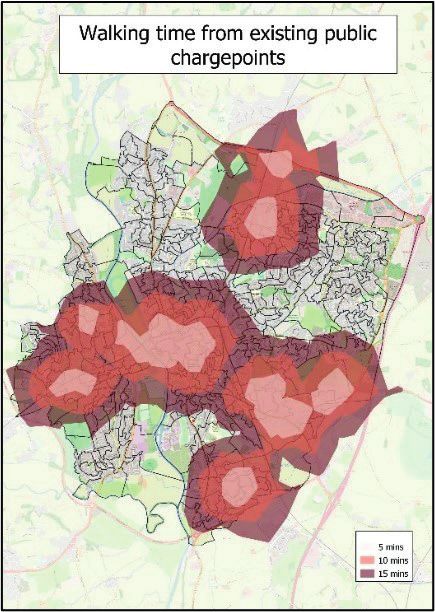
Predicting On-Street EV Charging Demand    7

Electric Vehicle Charging and the On-Street Challenge

EV public charging location types can be split into         Residential on-street charging is a type of long-stay
four categories of decreasing charging duration             charging that can enable those without off-street
and increasing power requirement:                           parking to transition to electric vehicles. It can also
                                                            be highly convenient and the most similar to off-
                                                            street charging – the user simply plugs in the vehicle
    DURATION                                                when parked outside their home and the vehicle is
                                                            recharged whilst it is parked and not used. However,
                                                            current EV adoption in urban areas without off-street
    POWER
                                                            parking, which often coincide with less affluent
             1          2         3           4             demographics, is typically low and therefore the case
           Long       Short     Hub          Transit
           Stay       Stay      Locations                   for on-street charging is not always commercially
                                                            attractive. Nevertheless, many local authorities have
                                                            recognised the social need for charging infrastructure
1   Long-stay: This location type includes residential
                                                            to encourage the electric transition in these regions.
    areas, workplace locations, park and rides, travel
    hubs; fleet depots; and hotels; all locations where     Cenex has created the EVEREST model to calculate
    the vehicle is parked for a number of hours             the amount of on-street charging infrastructure that
    (Typically 6+ hours).                                   is required to support the mass-market adoption of
                                                            electric vehicles. This document shows the current
2   Short-stay: This type includes locations where
                                                            capability of the model using the case study of the
    the EV will be parked for a small number of hours
                                                            city of Worcester. In future, the EVEREST model
    and includes retail parks and shopping centres,
                                                            will be updated to optimise the deployment of rapid
    leisure facilities, tourist attractions and workplace
                                                            charging in hub locations in conjunction with on-street
    visitor parking where vehicles are likely to be
                                                            residential charging.
    parked up for between 0.5 - 3 hours.

3   Hub Locations: These are locations where
    the primary reason to visit is for recharging of
    the vehicle. Therefore, high powered charging
    is required to limit the time spent waiting by the
    driver. These locations may also include some
    facilities for the driver, or be located in close
    proximity    to   destinations.   The   pre-eminent
    example is the first bespoke EV charging hub
    in the UK; the Gridserve Electric Forecourt in
    Braintree, Essex9.

4   Transit: These are locations where the vehicle
    requires a charge to complete their journey.
    Typically, the parking duration for transit locations
    is shortest and therefore the highest power
    charging is required. Locations include existing
    fuel stations near to major roads and motorway
    services.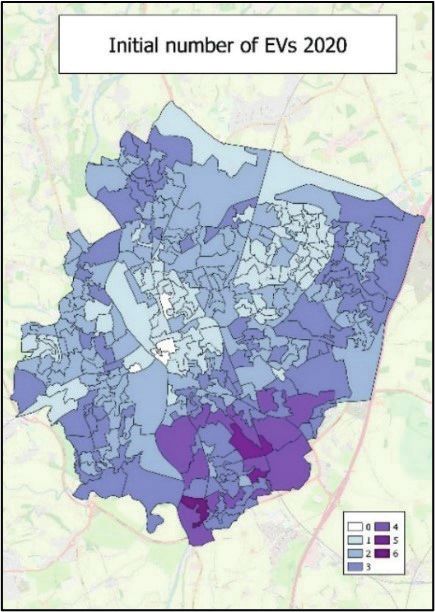
8    Predicting On-Street EV Charging Demand

Methodology

The EVEREST model takes in multiple
inputs to predict the demand for, and
optimise the deployment of, public EV
charging infrastructure. These inputs can be                2   Other datasets:
simplified into three groups which are listed                   An EV uptake prediction, devised by Cenex, taking into
below, with a description of how they are                       account the impact of the latest UK legislation such as
each used.                                                      the 2030 sales ban of new petrol and diesel cars and
                                                                vans. The uptake curve is tailored to the local social
                                                                demographic and gives predictions by vehicle type until
1   Publicly available datasets:                                2040.

    Locations of existing chargepoints taken from the           Number of households with access to off-street
    National Chargepoint Registry10 (NCR), which is             parking. This dataset is processed from Ordnance
    managed by Cenex. This input is vitally important in        Survey maps by mapping specialists Field Dynamics,
    order to account for existing on-street chargepoints        appointed by Cenex. This is especially important as
    that will already cater for a certain amount of EV          these households will not be reliant on the public network
    charging demand. Additional data is taken from              for their day to day charging needs.
    Google Places. The use of two datasets enables the
    data source to be checked for completeness, as well
    as providing redundancy in the situation where one
    source is not available. The inputs are pre-processed   3   User inputs and assumptions:
    to ensure that no chargepoint is accounted for twice.
                                                                Other planned, on-street chargepoints in the area.
                                                                When working with a local authority, there may be
    Driving behaviour taken from the National Travel
                                                                planned chargepoints that won’t be accounted for by the
    Survey (NTS) from the Department for Transport,
                                                                standardised model inputs. These can be input at this
    supplied via the UK Data Service under a Special
                                                                point.
    Licence for the development of EVEREST. The NTS
    is conducted annually and the most recent dataset is
                                                                The model takes an assumed amount of charging
    from 2019; the model uses years 2016-2019 to give a
                                                                done at leisure and workplace sites and removes this
    comprehensive dataset which is used to understand
                                                                from the total on-street charging demand. This input is
    driving behaviour, and therefore charging demand,
                                                                configurable.
    for different vehicle classifications.

                                                                Any constraints on the amount of on-street infrastructure
    Output Area geography and the social demographics           that can physically be deployed in an area can be set.
    of the population within them, taken from the 2011          This may be useful for very small Output Areas such as
    UK Census. The output areas bound the scope                 large apartment blocks or high-rise flats.
    of the problem for the area being modelled – e.g.
    Worcester – and the demographic gives information           The maximum distance can be set to determine how far
    on level and type of vehicle ownership.                     someone can be expected to go from their home to use
                                                                an on-street chargepoint.

                                                                Settings on driver recharging behaviour and vehicle
                                                                driving efficiency.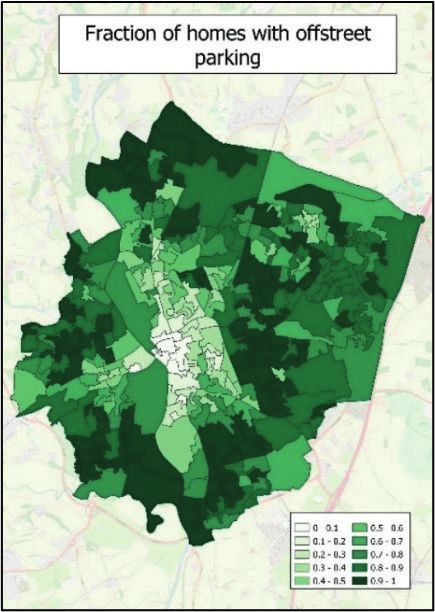
Predicting On-Street EV Charging Demand       9

Methodology

             START:
   List of Output Areas to Consider

                Output Areas Inputs      Existing Chargepoints           EV Uptake Inputs          EV Usage Inputs             Chargepoint
                                                                                                                               Specification
                   Output Areas              Existing On-Street            Output Areas               EV Usage
                    Geography                  Chargepoints                Social Groups               Profiles                Chargepoints
                                                                                                                              Location Types
                                                                                                                                 & Power
                  Households &                                          Vehicle Ownership
                                              Planned Rapid                                         User Defined
                 Off-Street Parking                                      & Current EVs by
                                              Chargepoints                                          Inputs on EV
                     Availability                                          Output Areas                                       Chargepoints
                                                                                                       Usage
                                                                                                                              Power, Tariff
                                                                                                                              & Availability
                 Max Chargepoints                                        Uptake Rates by
                  by Output Area                                         Social Grouping

                                                                         Run EV Uptake

                                                                         Draw EV Usage
                                                                            Profiles

                                                                     Determine Number of
                                                                    On-Street Chargepoints
                                                                    Required by Output Area

                                                                          Tabular Format                        Graphical
                                                                             Outputs                         Format Outputs

                                      KEY:

                                                   Standard National Data Set                 User Defined

                                                   Scenario Specific Data Set                 Calculations
Figure 1: EVEREST Model                            Modelled                                   Output Files
Functional Diagram

These inputs are then used by the EVEREST                                        EVEREST will attempt to deploy chargepoints in the
calculation engine to calculate the number and                                   EV’s “home” Output Area as required. However, if this
location of on-street chargepoints required for the                              is not possible, it will attempt to deploy chargepoints in
entire study area and for each year the model is run.                            neighbouring Output Areas.
The overall process is shown above in Figure 1.
                                                                                 The model will also issue warnings to the user if there
                                                                                 are any predicted EVs that are not served by the
                                                                                 required chargepoints or any unmet demand due to
                                                                                 the constraints input.
10    Predicting On-Street EV Charging Demand

 Results

 All of the results shown in this section are                                  The city of Worcester comprises 322 Output Areas
 given for the city of Worcester, selected for the                             over approximately 33 km2 with a population of 102,158
 EVEREST demonstration as Worcestershire                                       in 202011.
 County Council is a partner in the VPACH2
                                                                               The main output from the EVEREST model is the
 project.        This      is    evidenced,          actionable
                                                                               number of on-street chargepoints required for each
 information that can then be used by the local
                                                                               Output Area. The model can deliver results for each
 authority or chargepoint network operator to
                                                                               year up until 2040; Figure 2 shows 2020 to 2035 in
 inform decisions on EV charging deployment
                                                                               five-year increments:
 and strategy.

Figure 2: Worcester: Number of On-street Chargepoints Required per Output Area by Year

 This output is immediately useful as it
 identifies areas that require immediate
                                                                          On-street chargepoints required
 action to enable greater early EV
 adoption, as well as hotspots that
                                                                                          2020            2025               2030   2035
 can be planned for in the longer term.
 The data is also provided in a tabular
                                                             Output Area 1                  1               3                 6      8
 format, such as the example given in
 Table 1, for easy post-processing:                          Output Area 2                  0               0                 1      2

                                                             Output Area 3                  0               1                 3      5

                                                             ...                            ...             ...               ...    ...

                                                          Table 1: Example tabular chargepoint requirement per output area
Predicting On-Street EV Charging Demand 11
Results
Whilst the number of chargepoints required to meet The locations of existing public chargepoints in
demand is the key output, intermediate results can the city;
also be of interest, including the following results per The current level of EV ownership;
Output Area shown by Figure 3: The percentage of homes with off-street parking;
The walking time from existing public
chargepoints.
Figure 3: Worcester: Existing Chargepoints, Number of EVs, Fractions of Homes
with Off-street Parking and Walking Time from Existing Chargepoints 202012 Predicting On-Street EV Charging Demand
Results
This can demonstrate whether the areas where EVs Additionally, the model predicts at what time of
are currently located are where on-street charging day vehicles will plug in to the deployed charging
is needed. In fact, in many cases, this highlights the infrastructure. The 24-hour day is divided into six
need to enable those without off-street parking to windows, and Figure 4 shows the number of plug-
transition to electric by providing them with public ins per window predicted for 2035. In the case of
charging infrastructure. In the case of Worcester, this Worcester, the EVEREST model predicts the most
highlights the concentration of homes without access popular plug-in periods are the evening and overnight
to off-street parking are centrally within the city and windows.
demonstrates how this may be limiting the transition to
electric vehicles for residents in these areas.
Figure 4: Number of on-street plug-ins by charging window.
Window 1 Window 2 Window 3
22:00 - 06:00 06:00 - 08:30 08:30 - 12:00
Window 4 Window 5 Window 6
12:00 - 14:00 14:00 - 17:30 17:30 - 22:00Predicting On-Street EV Charging Demand 13
Results
Finally, the total amount of energy delivered by and although this is not standardised, a future
all modelled chargepoints – including off-street model development is planned to highlight where
domestic charging – is calculated, as shown by charging deployment could encounter energy network
Figure 5. This can be useful for utilities to understand constraints. This will be particularly important when
the total energy demand of certain regions. EVEREST is updated to optimise the deployment of
both on-street and rapid charging.
An extension of this will be to analyse the impact
of the deployed charging on the network – many Heat maps have been used to display results here,
Distribution Network Operators (DNOs) are improving however all outputs can also be given in tabular or
access to their data as part of digitalisation initiatives, graphical format as required by the client.
Figure 5: Worcester: Total Charging Energy Requirement14 Predicting On-Street EV Charging Demand
Further Work
The EVEREST model is fully functional and
can be used by Cenex staff to reliably predict
the demand for on-street charging.
However, predicting the demand for public charging
for those who do not have access to off-street
parking is only part of the wider EV charging picture.
Implementation
There are many other aspects of the transition to
Planning and support with implementation of
electric mobility that Cenex, as a not-for-profit
strategy:
organisation, can offer expert, independent advice
and consultancy on. Deployment planning for different types of
charging infrastructure and locations -such as
hubs, Park & Ride, destination, and workplace
charging – alongside on-street residential
Infrastructure Strategy charging to meet different user needs.
Higher level strategy work for local authorities,
private businesses and charities to understand Chargepoint ownership model analysis.
their current transport systems, the challenges
faced and a roadmap for change: Distribution Network Operator (DNO)
engagement and grid connection evaluation.
Vehicle and infrastructure baselining for both
fleet and private vehicles. On-street charging site selection and depot site
surveys.
Review of existing and upcoming national
policies and the impact on transport. Project public communications management.
Benefits of the transition to Electric Vehicles
including emissions and air quality.
Stakeholder engagement and creation of a Procurement Support
local vision and roadmap. Industry engagement and events.
Market review of the available charging Bid writing for Research & Development (R&D)
hardware and solutions. grant funding opportunities for innovative
charging technologies.
High level business case for chargepoint
networks. Authoring of technical specifications for public
procurement.
Evaluation of other mobility solutions and how
this integrates with EV charging. Supplier scoring scheme creation, bid
evaluation and supplier interviews.
Installation design review and technical
auditing.Predicting On-Street EV Charging Demand 15
The VPACH2 Project
Virgin Park and Charge 2 (VPACH2) is a The project seeks to address this issue of providing
demonstrator project, funded by Innovate UK as electric vehicle charging infrastructure for households
part of the “Electric Charging for Public Spaces: that do not have access to off-street parking. The
Real World Demonstrators” competition. The concept being demonstrated is using the widespread
project began in October 2019 and is due to finish power and communications infrastructure network
in December 2021 and includes a consortium of from Virgin Media (part of Liberty Global) – comprising
16 partners including seven local authorities.
170,000 km of ducts and 40,00 grid connections – to
more easily deploy charging equipment at lower cost.
The concept is shown in Figure 6:
CPO will provide and install all
‘over the pavement’ charging
equipment
VM will provide feeder
pillars / access to
existing street cabinets
Feeder to house energy meters
Pillar and other assets
GSM, Wi-fi or Pit Pit Pit
Ethernet connection CPO and VM
via cabinets & will provide DNO
comms ducts VM upgrades needed
for service
Energy ducts
DNO
LG will own the under the pavement assets (in the
orange box above) required to provide the power and
communications services to the CPO
Figure 6: VPACH2 “Iceberg” Model EVVCo Virgin Media
This concept yields the “iceberg” model whereby the There is then one or more commensurate concession
below ground infrastructure and distribution equipment type agreements between the involved parties to
is owned and maintained by Virgin Media and the agree the revenue share from the CPO to the local
CPO – to which the VPACH2 solution is agnostic – authority and Virgin Media, as well as contract lengths
provides and operates the charging equipment. and terms.16 Predicting On-Street EV Charging Demand
References
1
https://www.gov.uk/government/news/pm-outlines-his-ten-point-plan-for-a-green-industrial-revolution-for-250000-jobs
accessed 23rd March 2021.
2
https://www.metoffice.gov.uk/about-us/press-office/news/weather-and-climate/2019/state-of-the-uk-climate-2018
accessed 10th December 2020.
3
https://www.ipcc.ch/site/assets/uploads/2018/02/ar5_syr_headlines_en.pdf
accessed 10th December 2020.
4
https://www.theccc.org.uk/publication/reducing-uk-emissions-2019-progress-report-to-parliament/
accessed 10th December 2020.
5
https://www.gov.uk/government/publications/health-matters-air-pollution/health-matters-air-pollution
accessed 10th December 2020.
6
https://www.bbc.co.uk/news/uk-england-london-55146639 accessed 10th December 2020.
7
https://www.kcl.ac.uk/news/living-near-a-busy-road-can-stunt-childrens-lung-growth accessed 9th December 2019.
8
Image Source - https://images.app.goo.gl/WwnLTL1xV32bw5179
9
Further reading - https://gridserve.com/braintree-overview/
10
https://chargepoints.dft.gov.uk/login
11
https://www.worcestershire.gov.uk/info/20044/research_and_feedback/795/population_statistics17 Predicting On-Street EV Charging Demand
You can find out more about our research
projects, along with downloading a range of
free, public reports, from our website:
www.cenex.co.uk
@cenexLCFC
@Cenex
Tel: 01509 642 500
Email: info@cenex.co.uk
Website: www.cenex.co.ukYou can also read