Significance of geographical factors (climatic, topographic and social) to the COVID-19 outbreak in India - OSF
←
→
Page content transcription
If your browser does not render page correctly, please read the page content below
https://doi.org/10.31219/osf.io/9gqpm

Significance of geographical factors (climatic, topographic and social) to the
 COVID-19 outbreak in India

 Amitesh Guptaa,b1 • Sreejita Banerjeec • Sumit Dasc
 a
 Marine and Atmospheric Sciences Department, Indian Institute of Remote Sensing (ISRO), Dehradun,
 India
 b
 Department of Remote Sensing and GIS, JIS University, Kolkata, India
 c
 Department of Geography, Savitribai Phule Pune University, Pune 411007, India

Abstract:
Very recently, large outbreak of COVID-19 cases all around the world has also whacked
India since approximately 30,000 cases confirmed within first three months of transmission.
The present study used long-term climatic records of air temperature (T), rainfall (R),
actual evapotranspiration (AET), solar radiation (SR), specific humidity (SH), wind speed
(WS) with topographic altitude (E) and population density (PD) at regional level to
investigate the spatial association with number of COVID-19 infections (NI). Bivariate
analysis failed to find any significant relation (except SR) with the number of infected cases
within 36 provinces in India. Variable Importance of Projection (VIP) through Partial Least
Square (PLS) technique signified higher importance of SR, T, R and AET. However,
Generalized Additive Model (GAM) fitted with log-transformed value of input variables
and applying spline smoothening to PD and E, significantly found high accuracy of
prediction (R2=0.89), thus, well explained the complex heterogeneity among association of
regional parameters with COVID-19 cases in India. Our study suggests that comparatively
hot and dry regions in lower altitude of the Indian territory are more prone to the infection
by COVID-19 transmission.

Keywords: COVID-19, Geographical factors, Climatic influence, Generalized Additive
Model, India

1. Introduction: of April 28, 2020, there have been a total of
 3.12 million confirmed cases from all around
Coronavirus disease 2019 (Covid-19) the world. This contact transmissible
already considered as a global pandemic, is disease has an average incubation period
rapidly spreading across the world and from 6-14 days (Tosepu et al 2020). Fever,
significantly affecting many countries respiratory disorder, coughing and
(Singhal 2020; Asyary and Veruswati 2020). shortness of breath are some of the early
This outbreak of a novel coronavirus symptoms while in acute stage it can lead
(SARS-CoV-2) disease began in December to death (Holshue et al. 2020; Perman 2020;
2019 in Wuhan, Hubei Province, China Tosepu et al 2020).
(Gorbalenya 2020; Ma et al. 2020; Wu et al.
2020). By March 25, 2020, the disease had According to WHO, the first infected case
rapidly spread from Wuhan to 196 in India was reported on Jan 30, 2020.
countries, located in different parts of the Later, around March 4 onwards, it turned
world (Chen et al. 2020; Xu et al. 2020). As into a major outbreak. Till April 27,

1
 Email: amitesh13gupta14@gmail.com (Amitesh Gupta)

 1
https://doi.org/10.31219/osf.io/9gqpm

Maharashtra is the leading state with a 2. Data and methodology:
total number of 8,590 cases, while the whole
country recorded a total of 29,458 cases. 2.1. Data collection:
Social distancing is the only measure that is In this study, we made an attempt to
adopted due to lack of vaccine. SARS-CoV- correlate different climatic and topographic
2 can be transmitted through various bio- variables with the number of Covid-19
aerosols, large droplets or direct contact infections in different states of India. We
with secretions similar to the influenza virus retrieved data regarding the number of
(Li et al., 2005; Qi et al. 2020). Virus Covid-19 cases in all the states of India as
transmission can be influenced by several of April 27th, 2020 from
geographical factors such as climatic https://www.covid19india.org/. Population
conditions (temperature and humidity) and density data were acquired from census
population density (Dalziel et al., 2018; India website
Casanova et al. 2010). It was observed that (https://www.census2011.co.in). Due to
the outbreak is more severe in the countries limitation of the daily ground-monitored
located in the mid-latitude where the weather data in India, we obtained long-
temperature is considerably low in contrast term annual climatic data (viz.
to the tropical countries. Many researchers temperature, rainfall, actual
from different parts of the world tried to evapotranspiration, wind speed, solar
establish a relationship between COVID-19 radiation, and specific humidity) from
transmission and various meteorological TerraClimate and Worldclim websites
factors (Bashir et al. 2020; Patra et al. 2020; (http://www.climatologylab.org/terraclima
Shi et al. 2020). In a study conducted in te.html). Shuttle Radar Topographic
New York, USA, using Kendall and Mission (SRTM) digital elevation model of
Spearman rank correlation test it was found 90 m spatial resolution were obtained from
that mean temperature, minimum CGIAR website
temperature and air quality has a (http://srtm.csi.cgiar.org/).
significant association with the COVID-19
pandemic (Bashir 2020). Shi et al. (2020) 2.2. Determination of climatic zones:
reported a significant correlation between
daily temperature and daily count of The first part of our research was intended
COVID-19 cases in China, and suggested to understand the relative climatic
 conditions of different states. Hence, we
that temperature above 8 to 10 ℃ would implemented De Martone aridity-humidity
lead to the declination of infected cases. index (De Martonne 1925). Although, this
Patra et al. (2020) concluded that a rise in methodology is more appropriate in a small
1 ℃ temperature would result to a decrease area (Baltas 2007). However, due to its
in the number of daily confirmed COVID- easier calculation and fair generalization,
19 cases in Brazil. the approach was implemented for regional
In India, so far no comprehensive study classification (Ahmadi et al. 2020).
regarding the climatic influences on Covid- Moreover, due to the easier availability of
19 has been reported. Therefore, in this temperature and rainfall data this method
study, we investigated the correlations has wider popularity (Zareiee 2014). The
among climatic and topographic factors computation of the aridity index was done
with state-wise total number of infected by the following equation:
cases. The main goal is to examine scientific
evidence about the spread of COVID-19 =
cases in India based on regional factors, + 10
including population density, climatic where IDM denotes the aridity index, P is the
conditions and topography. annual mean precipitation in mm, and T is
 the annual mean air temperature in °C.

 2
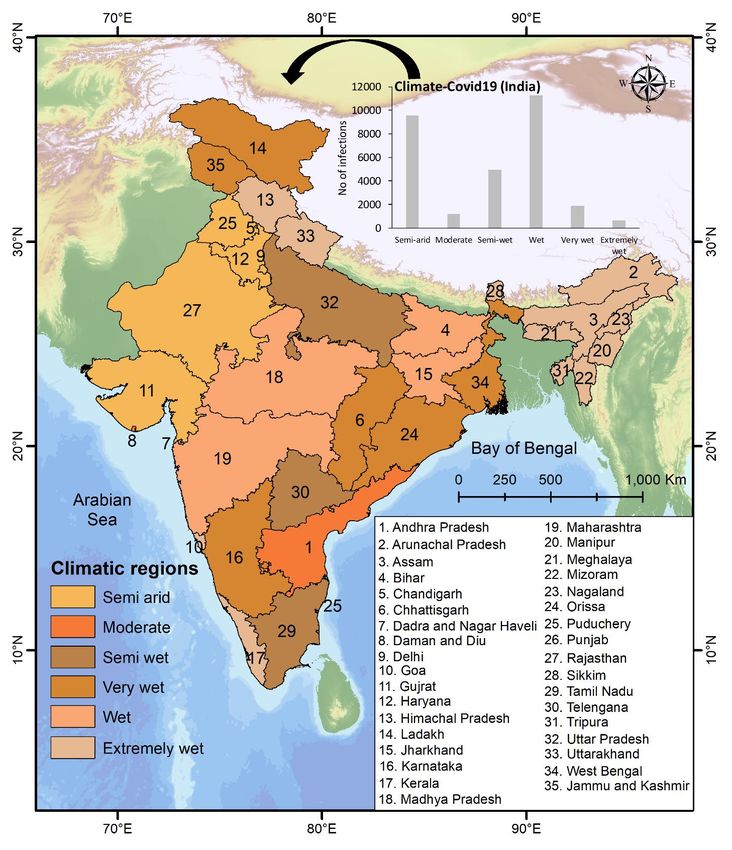
https://doi.org/10.31219/osf.io/9gqpm 2.3. Correlation and bivariate linear 2020). In the present study, log-linear GAM regression: was applied to analyse the state specific associations between infected counts and At first, we implemented Pearson product regional climatic factors, topography and moment correlation to the number of population density. Firstly, the basic model infected cases with all input variables to was built for total infected case as the find out their inter-correlations. Then, outcome of all other input parameters. bivariate linear regression was done in order Then parameters were log-transformed as to determine if there were any existence of well as smooth spline function was significance between the topo-climatic incorporated particularly to PD and E, factors with the COVID-19 transmissions. because for only these two variables, 2.4. Variable importance of projection: standard deviation exceeded mean due to extremely high heterogeneity at regional Partial least square regression (PLS) is a level. Thus the equation become as: common method that reduces the predictor variables to a smaller set of uncorrelated ln(NI) = ln(T) + ln(R) + ln(SH) + ln(WS) components and then it instead of original + ln(SR) + ln(AET) data, it runs least square regression on the + s(ln(PD)) + s(ln(E)) reduced number of components. In general, PLS is very useful in collinear predictor This approach also helped to explore linear variables. However, PLS is having a and nonlinear effects of various parameters component called Variable Importance of to health outcomes in terms of COVID-19 Projection (VIP) that determines the infections. relative importance of each factor (Akarachantachote et al. 2014). For easier 3. Results: computation of relative importance, we 3.1. Descriptive analysis: applied PLS in our topo-climatic data to construct a model and determine the Total 29,487 confirmed cases of infections relative importance of the variables. The are reported till April 27, 2020 across India. VIP score of variable (j) can be calculated Maharashtra has registered the highest using the following equation: number of confirmed cases (8,590), while only 9 among 36 provinces (comprising 28 states and 8 union territories in India), 2 individually have registered more than 1000 ∑ℎ =1 2 ( , )( ‖ ‖) such cases. Population density in India = √ 1 varies from 17 to 11,320 considering all the ( ) ∑ℎ =1 2 ( , ) states and union territories (Table. 1). While considering different climatic Where Waj denotes weight of the jth factor variables, due to the broad latitudinal in component a and R 2 (y,ta) indicates differences among states, a high variability fraction of variance in y explained by the in values is observed (Fig. 1). The annual component a. mean temperature varies from -5° C (Ladakh) to 28° C (Puducherry) (Table 1), Detailed methodology of PLS and VIP can while highest annual mean rainfall is be found in the study of Wold et al. (1993) observed in Meghalaya (3,914 mm) and the and Akarachantachote et al. (2014). lowest in Ladakh (164 mm). Specific humidity ranges from 0.002 kg kg-1 to 0.015 2.5. Generalized Additive Model (GAM): kg kg-1. Among all these states, range of Very recently, GAM is extensively used in actual evapotranspiration is observed to be many studies and found useful to correlate very high (10.75-100.99 mm). Monthly COVID-19 cases with various local mean wind speed above 10 m from the meteorological parameters (Ma et al 2020; surface varies from 0.99 m s -1 to 2.76 m s-1. Qi et al 2020; Prata et al 2020; Wu et al The solar radiation varies between 15,236 kj m-2 day-1 to 20,301 kj m -2 day-1 3
https://doi.org/10.31219/osf.io/9gqpm

Fig. 1. The spatial distribution of different climate, topography, and social factors in India. (a)
number of infections; (b) population density; (c) mean temperature; (d) rainfall; (e) specific
humidity; (f) actual evapotranspiration; (g) wind speed; (h) solar radiation; and (i) elevation.

 4
https://doi.org/10.31219/osf.io/9gqpm

Fig. 2. De Martonne climatic classification of India. The inset bar-graph is indicating the total
number of infections in each climatic zone.

 5
https://doi.org/10.31219/osf.io/9gqpm

 Table 1: Table is showing the descriptive statistics of state-wise Covid-19 infections and variation
 in climate in India
 Variable Abbreviation Minimum Maximum Mean Std.
 deviation
 No of infections NI 1 8,590 948.96 1,727.96
 Population density PD 17 11,320 1,078.67 2,518.87
 Temperature T -5.66 28.05 22.30 7.33
 Rainfall R 164.06 3914.24 1,445.25 855.01
 Specific humidity SH 0.002 0.02 0.01 0.003
 Actual evapotranspiration AET 10.74 100.98 65.18 19.05
 Wind speed WS 0.99 2.75 1.66 0.49
 Solar radiation SR 15,236.01 20,301.36 18,530.96 1,436.27
 Elevation E 14.57 4,660.68 717.39 1,037.25

 Table 2: De Martone classification table of aridity index
 Classes I value
 Hyper-arid 55

 Table 3: Correlation among different variables (Bold with * indicates significant at α=0.05)

 Variables NI PD T R SH AET WS SR E
NI 1* 0.112 0.269 -0.285 -0.014 -0.265 0.178 0.415* -0.204
P 0.112 1* 0.147 -0.174 -0.096 -0.069 -0.151 0.087 -0.187
T 0.269 0.147 1* 0.179 0.771* 0.459* -0.108 0.829* -0.983*
R -0.285 -0.174 0.179 1* 0.600* 0.808* -0.071 -0.104 -0.228
SH -0.014 -0.096 0.771* 0.600* 1* 0.808* 0.059 0.547* -0.762*
AET -0.265 -0.069 0.459* 0.808* 0.808* 1* -0.135 0.119 -0.482*
WS 0.178 -0.151 -0.108 -0.071 0.059 -0.135 1* 0.330 0.226
SR 0.415* 0.087 0.829* -0.104 0.547* 0.119 0.330 1* -0.747*
E -0.204 -0.187 -0.983* -0.228 -0.762* -0.482* 0.226 -0.747* 1*

 6
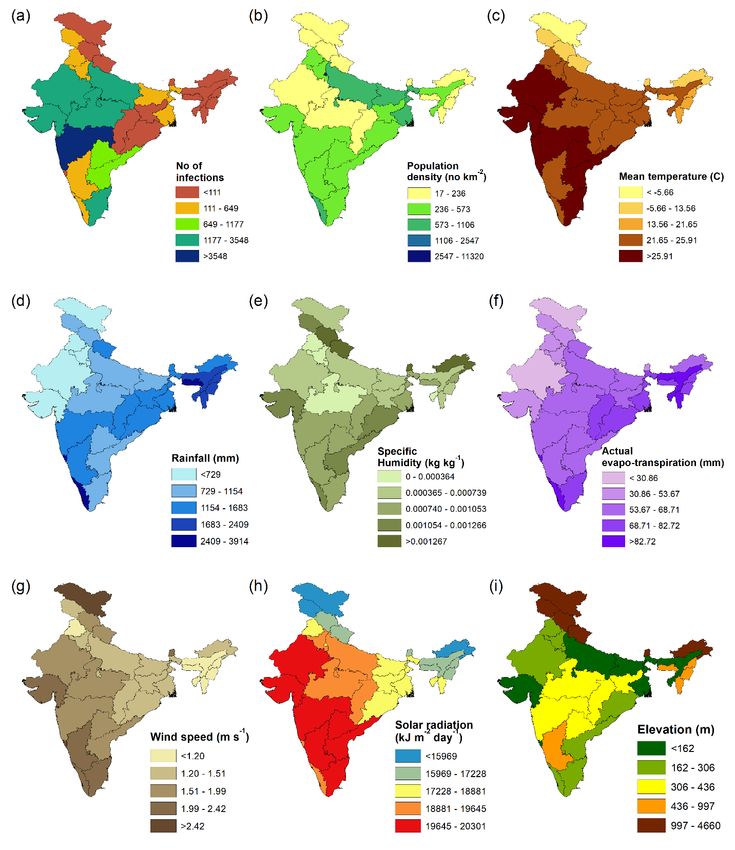
https://doi.org/10.31219/osf.io/9gqpm

Fig. 3. Scatter plots and VIP values of individual variables with respect to the number of infections.
(a) population density; (b) temperature; (c) rainfall; (d) specific humidity; (e) actual
evapotranspiration; (f) wind speed; (g) solar radiation; (h) elevation and (i) VIP values.

3.2. Climatic regions and Covid-19 cases: (13) categories are likely less infected by
 such transmission (Fig. 2).
Based on De Martonne classification (Table
2), we found six different climatic zones in 3.3. Bivariate correlation among variables:
entire India (e.g. semi-arid, moderate, semi-
wet, wet, very wet and extremely wet) (Fig. In order to understand the influence of
2). According to this climatic classification, different climatic and topographic factors,
we establish five provinces under semi-arid, we performed bivariate correlation using
two under moderate, three under semi-wet, the long-term climatic data and
five under wet, seven under very wet and topographic elevation. Table 3 shows the
thirteen under extremely wet categories. Pearson correlation coefficients between
The spatial distribution of COVID-19 cases each variable. We selected the number of
in India indicates, maximum transmissions infections as dependent variable and all the
occurred within the states that fall under geographical parameters were correlated as
semi-arid and wet categories. However, independent variables. We observed a
provinces under wet (7) and extremely wet significant positive correlation between
 temperature and rainfall with specific

 7
https://doi.org/10.31219/osf.io/9gqpm

humidity and actual evapotranspiration. A Log-transformed data with smoothening
strong correlation between temperature function to E and PD customized the
with solar radiation (+) and elevation (-) model’s prediction accuracy at a very
were also noticed (Table 3). Moreover, we significant level. Thus, it well explored the
found a significant positive relationship complex non-linearity in the relation of
between the numbers of infections with COVID-19 infections with the geographical
solar radiation (Fig. 3). Although no such distribution. Although, simple bivariate
significant correlation were found between correlation doesn’t produce any significant
number of infections and other variables, a relevance, the sublime outcome through
notable positive relationship with GAM model suggest multiple complex
temperature and negative relationship with parameters to take into account for further
rainfall were observed. Similarly, specific investigation in any spatial context. GAM
humidity, actual evapotranspiration, and experiment depicts that NI is negatively
altitudinal variation has a negative relation associated with SH and R, while positively
with no of infections while wind speed associated with SR and T.
shows a positive relation (Fig.. 3).
Surprisingly, we found no significant
correlation between population density with
the number of infections. Mention worthy, Fig. 4. Plots of
improvement in correlation was noticed for GAM analysis.
most of the variables when the variables
were log-transformed and inter-correlated. (a) performance
 of GAM to
3.4. Variable importance of projection: related
 geographic
Fig. 3i illustrates the variable importance of factors;
projection of each variable. A large value
(>1) of VIP was recorded in case of solar (b) residuals of
radiation, rainfall, temperature and actual smooth terms;
evapotranspiration. Elevation, winds speed,
population density, and specific humidity (c) relationship
were found having a VIP number lower between the
than 1. actual and
 predicted
3.5. Implementing GAM: model.
Using the GAM model, an attempt was
made to relate the number of infected cases
with all the geographical variables, which
are taken into the consideration for this
study. Initially, we found no significant
relation (R2=0.219) using simple linear
GAM. However, log-transformed values of
all variables significantly improved the
performance of the model (R2=0.782).
Using the flexibility of spline smoothening
function to log-transformed value of PD
(Fig. 4a) and E (Fig. 4b), the R2 value
mounted on 0.895 (Fig. 4c). The parametric
coefficients and approximate significance of
smooth terms are enlisted, which shows
that all input parameters were able to fit in
the model in such a way that all coefficients
were found statistically significant at 0.05
significance level (p-values
https://doi.org/10.31219/osf.io/9gqpm

4. Discussion: 2018; Asyary and Veruswati 2020). Asyary
 and Veruswati (2020) investigated the role
The recent COVID-19 has caused a of sunlight in Covid-19 outbreak and
significant health encumbrance in many
places around the world (Ma et al. 2020). In recovery. These workers didn’t observe any
this paper, we investigated the spatial noticeable trend of sunlight exposure with
relationship among long-term climate, the transmission rate, but, reported a
topography and social factors with the significant recovery rate under sunlight
counts of confirmed COVID-19 cases in exposure.
India. A substantial amount of studies in Our study indicates a negative association
different places around the world had between rainfall, specific humidity, actual
already tried to examine if there were any evapotranspiration and elevation. A time-
correlations between COVID-19 outbreak series study from China indicated a
and the existing weather or climatic negative correlation between daily relative
conditions (Bashir et al. 2020; Sajadi et al. humidity and COVID-19 transmission (Qi
2020). The prevailing meteorology et al. 2020). Moreover, a large number of
(temperature, humidity, wind speed etc.) previous epidemiological investigations
significantly alters the environmental reported a negative association between
stability, therefore, it might affect the humidity and corona virus alike diseases
sustainability of viruses and the (Zhang Qiang et al. 2004; Gardner et al.
transmission process (Tosepu et al. 2020). 2019). Thus, agreed the findings of present
According to Chen et al. (2020), COVID-19 research on Indian context.
transmission is significantly affected by
surrounding air temperature and humidity Until now, unwanted limelight was noticed
conditions, agreed by Shi et al. (2020), on about the relation between regional
the occasion of major outbreak in mainland topography and COVID-19 transmission.
of China. We subsumed the average elevation for
 each province, since, it significantly controls
In this study, we found a positive the climatic conditions. Our study
correlation between the number of indicated, the regions in low lying elevation
infections with long-term climatic records of in India are more likely to get infected by
temperature, wind speed, solar radiation higher Covid-19 transmission.
(significant) and population density. In
China, Shi et al. (2020) reported a negative Occurrence of infection counts in various
correlation between temperature and climatic regions suggests that the
COVID-19 transmission on the basis of the transmission rate is likely inferior in the
daily weather report. However, Ma et al. provinces under very wet and extremely wet
(2020) reported a positive association with categories of climatic conditions, thus,
mortality rate and daily temperature in significantly stipulate lower rate of
Wuhan, China. Subsequently, considering transmission in wet condition. Moreover,
the global context, transmission is found accounting 29.2% of total cases in India,
higher in particular regions of subtropical Maharashtra has been already opened up as
countries where the surrounding air the prime hotspot. Moreover, 24.72% of the
temperature is significantly low (Poole total cases were found in neighbouring
2020). states (i.e. Gujrat, Madhya Pradesh, Goa,
 Chhattisgarh and Telengana). This might
 The significant correlation between solar be a result of rapid migration before
radiation and COVID-19 infection in India lockdown (March 25, 2020).
clearly indicates that high insolation during
daytime does not prevent COVID-19 In the present study, we found significant
transmission. However, sunlight has the outcome of predicting infected cases
ability to boost the immune system and through GAM model accounting several
slow down the growth of infections in geographical parameters altogether. From
human body (Cannel et al. 2006; Miller GAM model, we understood that hot and
 dry areas are more likely to be infected by
 9
https://doi.org/10.31219/osf.io/9gqpm

COVID-19 transmission. Higher WS at transmission in Indian context. This is
micro scale may induce the ventilation, but, simply a basic analysis and a large amount
our study suggests, it will not have suitable of data (district wise) might be
impact over regional scale. Residual plots of incorporated for a stronger conclusion.
smooth terms (i.e., PD and E) indicate that
population statistics or regional topography 5. Conclusion:
may not have any accountability solely, The present study signifies the geographical
however, these are important with a influence on COVID-19 transmission at
combination with meteorology. regional level in the context of India. It is
Same as any scientific investigations, our well emphasized by several statistical
study has a significant amount of analyses that climatic records have
limitations: (i) we have presented only long- unavoidable influence on this viral disease.
term climatic records to indicate the The heterogeneity in the spatial occurrence
association between COVID-19 cases and of infections might be attributed to local
prevailing circumstances. There is indeed a meteorology with its geographical location
requirement of investigation using real time and population. However, no single
daily weather data in different states. (ii) attribute individually can well explain the
As the disease is caused by a virus, there nature of transmission. Positive association
are lots of other factors that might be with solar radiation and temperature as well
considered such as population migration, as negative association with humidity and
immunity power, age groups, hygiene rainfall suggest that hot and arid areas in
systems etc. Despite of having limitations, low altitude regions are required to strictly
this study is highly significant as it is the follow up preventive measures in an
first report that is investigating the emergency basis.
association of climate and COVID-19

Author’s Contribution:
Amitesh Gupta: Conceptualization, Methodology, Software, Validation, Writing original draft; Sreejita
Banerjee: Data collection, Writing: review and editing; Sumit Das: Conceptualization, Methodology, Software,
Visualization, Writing original draft

Acknowledgement:
S.D. and S.B. wish to thank the Department of Geography, Savitribai Phule Pune University, for providing
necessary facilities to carry out this study. All authors are thankful to covid19india.org, census India, CGIAR,
TerraClimate and Worldclim websites for providing required data used in this study.

References:
Ahmadi, M., Sharifi, A., Dorosti, S., et al., 2020. central pandemic area of Indonesia.
Investigation of effective climatology parameters on https://doi.org/10.1016/j.scitotenv.2020.139016
COVID-19 outbreak in Iran, Science of the Total
Environment, Baltas, E., 2007. Spatial distribution of climatic
https://doi.org/10.1016/j.scitotenv.2020.138705 indices in northern Greece. Meteorological
 Applications 14, 69-78
Akarachantachote, N., Chadcham, S., Saithanu, K.,
2014. Cutoff threshold of variable importance in Bashir, M.F., Ma, B., Bilal., Komal, B., Bashir,
projection for variable selection. International M.A., Tan, D., Bashir, M., 2020. Correlation
Journal of Pure and Applied Mathematics 94, 307- between climate indicators and COVID-19 pandemic
322 in New York, USA. Science of the Total
 Environment 728, 138835
Asyary, A., Veruswati, M., 2020. Sunlight exposure
increased Covid-19 recovery rates: A study in the Cannell, J.J., Vieth, R., Umhau, J.C., Holick, M.F.,
 Grant, W.B., Madronich, S., Garland, C.F.,

 10
https://doi.org/10.31219/osf.io/9gqpm

Giovannucci, E., 2006. Epidemic influenza and transmission in (sub) tropical cities of Brazil.
vitamin D. Epidemiol. Infect. 134, 1129–1140. Science of the Total Environment
Casanova, L.M., Jeon, S., Rutala, W.A., Weber, Perlman, S., 2020. Another decade, another
D.J., Sobsey, M.D., 2010. Effects of air temperature coronavirus. Mass Medical Soc.
and relative humidity on coronavirus survival on
surfaces. Appl. Environ. Poole, L., 2020. Seasonal Influences on the Spread of
 SARS-CoV-2 (COVID19), Causality, and
Microbiol. 76, 2712–271 Forecastabililty (3-15-2020). Causality, and
Chen B, Liang H, Yuan X, Hu Y, Xu M, Zhao Y, et Forecastabililty (3-15-2020). (March 15, 2020).
al. Roles of meteorological conditions in Qi, H., Xiao, S., Shi, R., Ward, M.P., Chen, Y., Su,
COVID-19 transmission on a worldwide scale. Q., Wang, W., Wang, X., Zhang, Z., 2020. COVID-
medRxiv 2020. 19 transmission in mainland chaina is associated
Dalziel, B.D., Kissler, S., Gog, J.R., Vibourd, C., with temperature and humidity: a time-series
Bjornstad, O.N., Metcaff, J.E., et al., 2018. analysis. Science of the Total Environment 728,
Urbanization and humidity shape the intensity of 138778
influenza epidemics in U.S cities. Science 362, 75-79. Sajadi, M.M., Habibzadeh, P., Vintzileos, A.,
De Martonne E. 1925. Trait´ e de G´ eographie Shokouhi, S., Miralles-Wilhelm, F., Amoroso, A.,
Physique: 3 tomes, Paris. 2020. Temperature and Latitude Analysis to Predict
 Potential Spread and Seasonality for COVID-19.
Gardner, E.G., Kelton, D., Poljak, Z., Van Available at SSRN 3550308.
Kerkhove, M., von Dobschuetz, S., Greer, A.L.,
2019. Shi, P., Dong, Y., Yan, H., Zhao, C., Li, X., Liu,
A case-crossover analysis of the impact of weather W., He, M., Tang, S., Zi,S., 2020. Impact of
on primary cases of Middle East temperature on the dynamics of the COVID-19
respiratory syndrome. BMC Infect. Dis. 19, 113. outbreak in China. Science of the Total
 Environment 728, 138890.
Gorbalenya, A.E., 2020. Severe acute respiratory
 Singhal, T., 2020. A Review of Coronavirus Disease-
syndrome-related coronavirus–the species and its
viruses, a statement of the Coronavirus Study 2019 (COVID-19). Indian J. Pediatr. 87, 281–286.
 https://doi.org/10.1007/s12098-020-03263-6
Group. BioRxiv, 1–15
https://doi.org/10.1101/2020.02.07.937862. Wold S, Johansson A, Cochi M (eds).PLS-partial
 least squares projec-tions to latent structures.
Holshue, M.L., DeBolt, C., Lindquist, S., Lofy,
K.H., Wiesman, J., Bruce, H., et al., 2020. First ESCOM Science Publishers: Leiden, 1993;523–550.
case of 2019 novel coronavirus in the United States. Wu, F., Zhao, S., Yu, B., Chen, Y., Wang, W.,
N. Engl. J. Med. Song, Z., Hu, Y., Tao, Z., Tian, J., Pei, Y., Yuan,
Li, Q., Guan, X., Wu, P., Wang, X., Zhou, L., M., Zhang, Y., Dai, F., Liu, Y., Wang, Q., Zheng,
Tong, Y., et al., 2020. Early transmission dynamics J., Xu, L., Holmes, E.C., Zhang, Y., 2020. A new
 coronavirus associated with human respiratory
in Wuhan, China, of novel coronavirus–infected
pneumonia. N. Engl. J. Med. disease in China. Nature 579 (7798), 265–269.
 https://doi.org/10.1038/s41586-020-2008-3
Li, Y., Huang, X., Yu,I.T., et al., 2005. Role of air
distribution in SARS transmission during the largest Xu, Z., Shi, L., Wang, Y., Zhang, J., Huang, L.,
nosocomial outbreak in Hong Kong. Indoor Air 15, Zhang, C., Liu, S., Zhao, P., Liu, H., Zhu, L.,
83-95. others, 2020. Pathological findings of COVID-19
 associated with acute respiratory distress syndrome.
Ma, Y., Zhao., Y., Liu, J., He, X., Wang, B., Fu, S., Lancet Respir. Med.
Yan, J., Niu, J., Zhou, J., Luo, B., Effects of
temperature variation and humidity on the death of Zareiee, A.R., 2014. Evaluation of changes in
COVID-19 in Wuhan, China. Science of the Total different climates of Iran, using De Martonne index
Environment 724, 138226 and Mann-Kendall trend test. Nat. Hazards Earth
 Syst. Sci. Discuss. 2, 2245–2261.
Miller, B., 2018. Immune System: Your best defense
against viruses and bacteria from the common cold Zhang Qiang, Y.X.-W., Ye, Dian-xiu, Xiao, Feng-
to the SARS virus. Oak Publication Sdn Bhd. jin, Cheng, Zheng-hong, 2004. Meteorological
 characteristics and their impacts during the SARS
Prata, D.N., Rodrigues, W., Bermejo, P.H., 2020. epidemic period. J. Nanjing Institute Meteorol. 849–
Temperature significantly changes COVID-19 855

 11
You can also read