Identifying and Ranking Common COVID-19 Symptoms From Tweets in Arabic: Content Analysis - JMIR
←
→
Page content transcription
If your browser does not render page correctly, please read the page content below
JOURNAL OF MEDICAL INTERNET RESEARCH                                                                                                      Alanazi et al

     Original Paper

     Identifying and Ranking Common COVID-19 Symptoms From
     Tweets in Arabic: Content Analysis

     Eisa Alanazi1, BSc, MSc, PhD; Abdulaziz Alashaikh2, BEng, MSc, PhD; Sarah Alqurashi1, BSc; Aued Alanazi1, BSc
     1
      Center of Innovation and Development in Artificial Intelligence, Umm Al-Qura University, Makkah, Saudi Arabia
     2
      University of Jeddah, Jeddah, Saudi Arabia

     Corresponding Author:
     Eisa Alanazi, BSc, MSc, PhD
     Center of Innovation and Development in Artificial Intelligence
     Umm Al-Qura University
     Prince Sultan Road
     Makkah, 11343
     Saudi Arabia
     Phone: 966 55 601 4171
     Email: eaanazi@uqu.edu.sa

     Abstract
     Background: A substantial amount of COVID-19–related data is generated by Twitter users every day. Self-reports of COVID-19
     symptoms on Twitter can reveal a great deal about the disease and its prevalence in the community. In particular, self-reports can
     be used as a valuable resource to learn more about common symptoms and whether their order of appearance differs among
     different groups in the community. These data may be used to develop a COVID-19 risk assessment system that is tailored toward
     a specific group of people.
     Objective: The aim of this study was to identify the most common symptoms reported by patients with COVID-19, as well as
     the order of symptom appearance, by examining tweets in Arabic.
     Methods: We searched Twitter posts in Arabic for personal reports of COVID-19 symptoms from March 1 to May 27, 2020.
     We identified 463 Arabic users who had tweeted about testing positive for COVID-19 and extracted the symptoms they associated
     with the disease. Furthermore, we asked them directly via personal messaging to rank the appearance of the first 3 symptoms
     they had experienced immediately before (or after) their COVID-19 diagnosis. Finally, we tracked their Twitter timeline to
     identify additional symptoms that were mentioned within ±5 days from the day of the first tweet on their COVID-19 diagnosis.
     In total, 270 COVID-19 self-reports were collected, and symptoms were (at least partially) ranked.
     Results: The collected self-reports contained 893 symptoms from 201 (74%) male and 69 (26%) female Twitter users. The
     majority (n=270, 82%) of the tracked users were living in Saudi Arabia (n=125, 46%) and Kuwait (n=98, 36%). Furthermore,
     13% (n=36) of the collected reports were from asymptomatic individuals. Of the 234 users with symptoms, 66% (n=180) provided
     a chronological order of appearance for at least 3 symptoms. Fever (n=139, 59%), headache (n=101, 43%), and anosmia (n=91,
     39%) were the top 3 symptoms mentioned in the self-reports. Additionally, 28% (n=65) reported that their COVID-19 experience
     started with a fever, 15% (n=34) with a headache, and 12% (n=28) with anosmia. Of the 110 symptomatic cases from Saudi
     Arabia, the most common 3 symptoms were fever (n=65, 59%), anosmia (n=46, 42%), and headache (n=42, 38%).
     Conclusions: This study identified the most common symptoms of COVID-19 from tweets in Arabic. These symptoms can be
     further analyzed in clinical settings and may be incorporated into a real-time COVID-19 risk estimator.

     (J Med Internet Res 2020;22(11):e21329) doi: 10.2196/21329

     KEYWORDS
     health; informatics; social networks; Twitter; anosmia; Arabic; COVID-19; symptom

                                                                              change in people’s lifestyles. In response to this catastrophe,
     Introduction                                                             we have witnessed a great effort from diverse research
     The ongoing COVID-19 pandemic has greatly impacted human                 communities to study all aspects of this disease.
     health and well-being and has radically enforced a rigorous

     http://www.jmir.org/2020/11/e21329/                                                                J Med Internet Res 2020 | vol. 22 | iss. 11 | e21329 | p. 1
                                                                                                                       (page number not for citation purposes)
XSL• FO
RenderX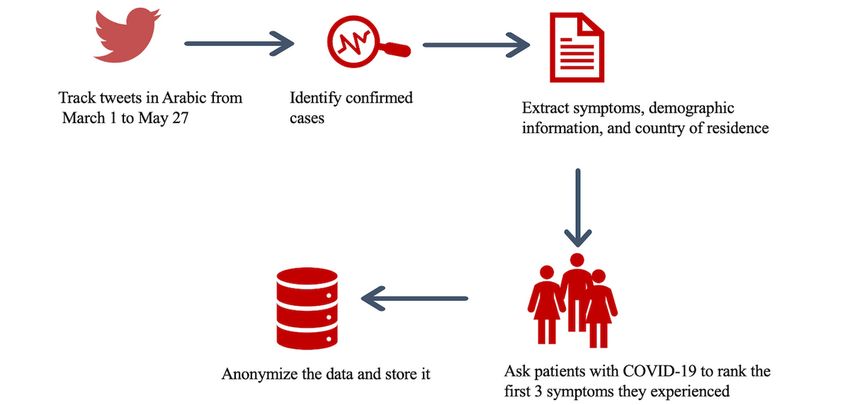
JOURNAL OF MEDICAL INTERNET RESEARCH                                                                                                     Alanazi et al

     In recent years, social networks have become an important               The Twitter platform allows researchers to obtain data on items
     source of information where users expose and share ideas,               like age, sex, geolocation, etc, along with informative posts, via
     opinions, thoughts, and experiences on a multitude of topics.           data mining and analysis techniques; this can potentially result
     Several studies have utilized the abundance of information              in useful insights about a specific health condition [7].
     offered by social platforms to conduct nonclinical medical              Extracting common symptoms associated with a disease from
     research. For example, Twitter has been a source of data for            publicly available data has the potential to control the spread
     many health and medical studies, such as surveillance and               of the disease and identify users at high risk. It also gives new
     monitoring of flu and cancer timelines and distribution across          insights that call for early intervention and control. For example,
     the United States [1], analyzing the spread of influenza in the         Figure 1 presents the translation of a tweet (from Saudi Arabia;
     United Arab Emirates based on geotagged tweets in Arabic [2],           dating to early May 2020) that explicitly mentions the loss of
     and the surveillance and monitoring of influenza in the United          smell and taste as one distinctive symptom of COVID-19.
     Arab Emirates based on tweets in Arabic and English [3]. In             Interestingly, the official COVID-19 Questionnaire App in
     addition, Twitter data have been utilized in symptom and disease        Saudi Arabia was updated in late May 2020 to include the
     identification in Saudi Arabia [4], and most recently, to examine       sudden loss of smell and taste as one risk indicator of having
     COVID-19 symptoms as reported on Twitter [5] and to analyze             COVID-19 [8]. Tracking COVID-19 symptoms in real time via
     the chronological and geographical distribution of infected             public data on Twitter could have shortened the gap.
     tweeters in the United States [6].
     Figure 1. A patient with COVID-19 tweets about how the loss of smell and taste was the only common symptom across all of their family members.
     The tweet was anonymized and translated into English.

     In this paper, we examined COVID-19 symptoms as reported                March 1, 2020, to May 27, 2020, using 2 Arabic keywords
     by Arabic tweeters. First, we shuffled tweets in Arabic and             Inline Figure 6 and Inline Figure 6, which translate roughly to
     searched for tweets with COVID-19 symptoms and collected                “I have been diagnosed.” Such keywords are likely to filter out
     tweets from users who self-reported a positive diagnosis (via           reports that were not associated with a formal test result. An
     clinical testing). Next, we asked infected users about the first        initial list of 463 users were collected, and 2 independent
     3 symptoms they had experienced via a voluntary survey sent             freelancers were asked to further read users’ timeline and extract
     through a private message.                                              symptoms that were explicitly mentioned that were related to
                                                                             COVID-19 and their order of appearance, if mentioned.
     Methods                                                                 Additional information such as user gender, date of infection,
                                                                             and country of residence were also collected. We assumed the
     Our data collection methodology is outlined in Figure 2. First,         date of the COVID-19 diagnosis tweet as the date of infection,
     we searched Twitter for personal reports of COVID-19 from               if no other information was available.

     http://www.jmir.org/2020/11/e21329/                                                               J Med Internet Res 2020 | vol. 22 | iss. 11 | e21329 | p. 2
                                                                                                                      (page number not for citation purposes)
XSL• FO
RenderX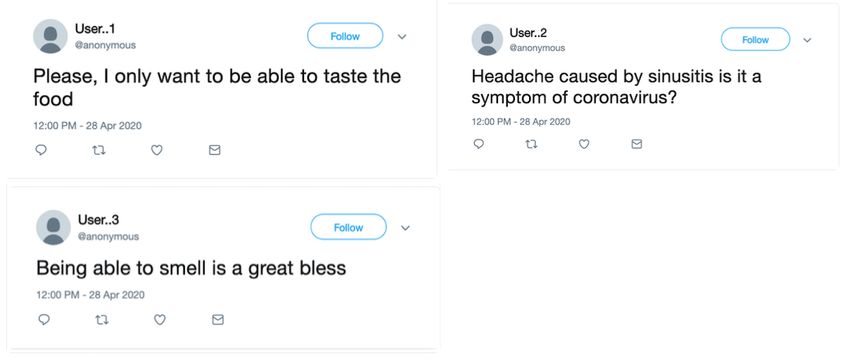
JOURNAL OF MEDICAL INTERNET RESEARCH                                                                                        Alanazi et al

     Figure 6. Inline image 1.

     Figure 7. Inline image 2.

     Figure 2. Data collection steps.

     In all, 270 users with COVID-19 were identified, of whom 80   Twitter personal messages to rank the first 3 symptoms they
     shared their symptoms publicly. To further understand the     experienced right before or after testing positive for COVID-19.
     chronological order of the symptoms, we asked users through

     http://www.jmir.org/2020/11/e21329/                                                  J Med Internet Res 2020 | vol. 22 | iss. 11 | e21329 | p. 3
                                                                                                         (page number not for citation purposes)
XSL• FO
RenderX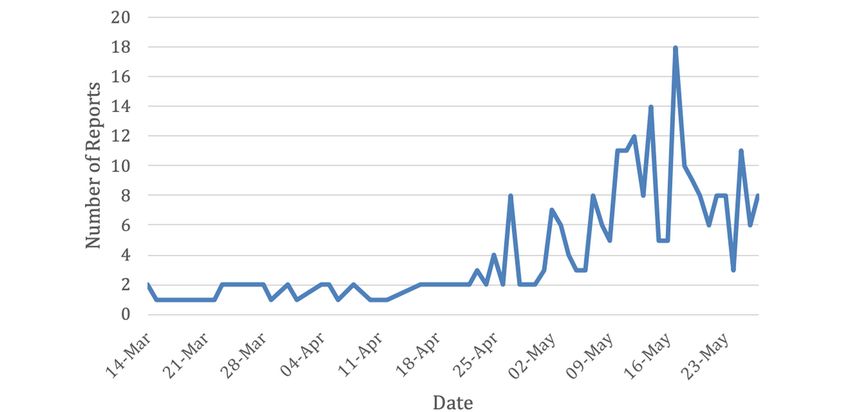
JOURNAL OF MEDICAL INTERNET RESEARCH                                                                                                        Alanazi et al

     We recorded the symptom ranks (from first to last) based on               within ±5 days of infection date to contain valuable information
     the received responses and publicly available data on the users’          about early symptoms, allowing us to process and rank the
     pages. In case no order was given, an implicit order was assumed          symptoms. As an example, Figure 3 highlights 3 tweets by 3
     following the order in which the symptoms were mentioned by               different patients with COVID-19 that indirectly relay symptoms
     the user.                                                                 before or after being diagnosed with COVID-19. For simplicity,
                                                                               we set a false date (April 28, 2020) for all 3 tweets using
     Tracking tweets containing specific keywords is not sufficient
                                                                               TweetGen [10]. User..1 tested positive on April 29, 1 day after
     enough to obtain an overview of disease dynamics [9]. Many
                                                                               tweeting their wish to be able to taste food; User..2 tested
     patients detailed their experience while infected; hence, knowing
                                                                               positive on May 1, 3 days after complaining about a headache;
     their health condition and sentiments, and tracking useful
                                                                               and User..3 was tested positive on April 26 and tweeted on
     information, may lead to a better understanding of the disease
                                                                               April 28 about the loss of smell.
     symptoms. In particular, we found tweets that were posted
     Figure 3. Example of tweets collected within 5 days before or after the user tweeted about having a COVID-19–positive diagnosis.

     The examples highlighted in Figure 3 demonstrate that mining              the Ministry of Health in Saudi Arabia [11]) may have also
     Twitter for COVID-19 symptoms requires more than a simple                 helped in finding more reports in May compared to other
     keyword search. In principle, the context of the tweet, as                months. We have witnessed this firsthand as some of the
     narrated by a user with COVID-19, is also important. Therefore,           asymptomatic reports were mainly a result of early active
     it is important to examine not only the tweet but also its context.       screening.
     To build a high-quality database of COVID-19 symptoms based
                                                                               Users from Saudi Arabia, Kuwait, and the United Arab Emirates
     on tweets in Arabic, we relied on a manual extraction of
                                                                               constituted 85% (n=230) of reports. Nearly half of the reports
     symptoms.
                                                                               came from Saudi Arabia (n=125, 46%), which is not surprising,
                                                                               since it is one of the top countries on Twitter with more than
     Results                                                                   15 million users [12]. Other countries (Egypt, Iraq, Bahrain,
     The majority of cases were recorded in May 2020 (n=210, 78%),             Qatar, United Kingdom, United States, Belgium, and Germany)
     followed by April (n=39, 14%) and March (n=21, 8%). This                  constituted the remaining 15% (n=40).
     surge in May reports is understandable as most countries                  We collected 893 symptoms from 270 self-reports (as shown
     globally witnessed a substantial increase in the number of                in Table 1). The daily number of collected tweets is highlighted
     confirmed cases. Needless to say, some of the adopted strategies          in Figure 4.
     to prevent further spread of the virus (eg, active screening by

     http://www.jmir.org/2020/11/e21329/                                                                  J Med Internet Res 2020 | vol. 22 | iss. 11 | e21329 | p. 4
                                                                                                                         (page number not for citation purposes)
XSL• FO
RenderX
JOURNAL OF MEDICAL INTERNET RESEARCH Alanazi et al
Table 1. Number of symptoms experienced by tweeters (N=270).
Symptom count Number of reports, n (%)
0 36 (13)
1 19 (7)
2 35 (13)
3 65 (24)
4 50 (19)
5 35 (13)
6 11 (4)
7 8 (3)
8 5 (2)
9 3 (1)
10 3 (1)
Figure 4. Number of daily collected reports from Twitter (March to May 2020).
symptoms that were ranked as the first, second, or third
Table 1 indicates that most tweeters experienced between 2 to
symptom to occur in the collected self-reports. Fever and
5 symptoms, whereas 13% (n=36) of the reported cases were
headache were commonly the first reported symptoms. The top
asymptomatic. Table 2 lists the frequency of each symptom
4 symptoms that coincided with fever were headache (n=33,
ordered from the most prevalent to the least. Only fever was
23.7%), cough (n=20, 14.4%), anosmia (n=19, 13.7%), and
experienced by nearly 60% (n=139) of users. The frequency of
ageusia (n=17, 12.2%). Other symptoms occurred at a relatively
symptoms appears to be consistent across male and female
lower frequency with fever. Table 4 lists the top 8 common
patients (correlation coefficient=0.966). Further, Table 3 lists
symptoms for Saudi Arabia and Kuwait, which accounts for
the top 8 symptoms in the order of their appearance (ie, first,
81.2% (n=190) of the reports. The symptoms had a correlation
second, and third rank); this refers to the 8 most common
coefficient of 0.835 between the 2 countries.
http://www.jmir.org/2020/11/e21329/ J Med Internet Res 2020 | vol. 22 | iss. 11 | e21329 | p. 5
(page number not for citation purposes)
XSL• FO
RenderXJOURNAL OF MEDICAL INTERNET RESEARCH Alanazi et al
Table 2. Most common symptoms reported by users.
Symptom All users (n=234), n (%) Male (n=171), n (%) Female (n=63), n (%)
Fever 139 (59) 98 (57) 41 (65)
Headache 101 (43) 68 (40) 33 (52)
Anosmia 91 (39) 63 (37) 28 (44)
Ageusia 72 (31) 51 (30) 21 (33)
Fatigue 68 (29) 54 (32) 14 (22)
Cough 62 (26) 48 (28) 14 (22)
Sore throat 42 (18) 30 (18) 12 (19)
Dyspnea 33 (14) 26 (15) 7 (11)
Diarrhea 27 (12) 22 (13) 5 (8)
Runny nose 23 (10) 17 (10) 6 (9)
Arthralgia 16 (7) 10 (6) 6 (9)
Chest pain 15 (6) 13 (8) 2 (3)
Back pain 14 (6) 11 (6) 3 (5)
Anorexia 14 (6) 11 (6) 3 (5)
Body ache 12 (5) 8 (5) 4 (6)
Nausea 12 (5) 8 (5) 4 (6)
Osteodynia 11 (5) 8 (5) 3 (5)
Dry throat 9 (4) 6 (3) 3 (5)
Myalgia 9 (4) 7 (4) 2 (3)
Dizziness 8 (3) 6 (3) 2 (3)
Chills 7 (3) 5 (3) 2 (3)
Nasal congestion 7 (3) 4 (2) 1 (2)
Sinusitis 7 (3) 3 (2) 4 (6)
Table 3. The top 8 symptoms, with a first, second, and third rank, as reported by users.
Number First Second Third
1 Fever Fever Fever
2 Headache Headache Headache
3 Anosmia Fatigue Anosmia
4 Fatigue Cough Ageusia
5 Cough Ageusia Fatigue
6 Sore throat Anosmia Cough
7 Runny nose Sore throat Anorexia
8 Diarrhea Arthralgia Dyspnea
http://www.jmir.org/2020/11/e21329/ J Med Internet Res 2020 | vol. 22 | iss. 11 | e21329 | p. 6
(page number not for citation purposes)
XSL• FO
RenderXJOURNAL OF MEDICAL INTERNET RESEARCH Alanazi et al
Table 4. The top 8 common symptoms for Saudi Arabia and Kuwait.
Symptom Saudi Arabia (n=110), n (%) Kuwait (n=80), n (%)
Fever 65 (59) 45 (56)
Headache 42 (38) 38 (48)
Anosmia 46 (42) 21 (26)
Ageusia 36 (37) 19 (24)
Fatigue 31 (28) 19 (24)
Cough 21 (19) 19 (24)
Sore throat 22 (20) 11 (14)
Dyspnea 14 (13) 11 (14)
Finally, we compared the symptom prevalence of our study to by different populations. As seen in Table 5 and Figure 5, our
the one provided by Sarker et al [5], in order to assess findings complement those of Sarker et al [5] (correlation
similarities and differences in COVID-19 symptoms experienced coefficient=0.72).
Table 5. Comparison of common symptoms found in this study and in Sarker et al [5].
Symptom Our study (n=234), n (%) Sarker et al (n=171), n (%)
Fever 139 (59) 113 (66)
Headache 101 (43) 64 (37)
Anosmia 91 (39) 49 (29)
Ageusia 72 (31) 48 (28)
Fatigue 68 (29) 72 (42)
Cough 62 (26) 99 (58)
Sore throat 42 (18) 41 (24)
Dyspnea 33 (14) 62 (36)
Diarrhea 27 (12) 15 (9)
Runny nose 23 (10) 16 (9)
Arthralgia 16 (7) 2(1)
Chest pain 15 (6) 39 (23)
Back pain 14 (6) —a
Anorexia 14 (6) 23 (14)
Body ache 12 (5) 73 (43)
Nausea 12 (5) 19 (13)
Osteodynia 11(5) —
Dry throat 9 (4) —
Myalgia 9 (4) 10 (6)
Dizziness 8 (3) 15 (9)
Chills 7 (3) 43 (25)
Nasal congestion 7 (3) —
Sinusitis 7 (3) 7 (4)
a
Not applicable.
http://www.jmir.org/2020/11/e21329/ J Med Internet Res 2020 | vol. 22 | iss. 11 | e21329 | p. 7
(page number not for citation purposes)
XSL• FO
RenderXJOURNAL OF MEDICAL INTERNET RESEARCH Alanazi et al
Figure 5. A comparison between symptom prevalence in our study and Sarker et al [5] (correlation coefficient=0.72).
Another interesting observation is that several users experienced
Discussion what they described as a short-term mild fever for a couple of
Principal Findings hours only. Quitting smoking was a positive outcome of
COVID-19, per one user’s tweet. We were surprised by some
This work identified common COVID-19 symptoms from users in early April claiming to be positive for COVID-19,
Arabic personal reports on Twitter. These findings complement which later turned out to be an April Fool’s Day prank. These
the results of other recent studies [5,6,9] that focused on tweets findings prompt further study into how different communities
in English or specific demographic groups. This study was react to a pandemic and how it affects their lives.
carried in a way to report not only the symptoms but their
timeline as narrated by users. Social networks have become the Limitations and Future Works
de facto communication channel for a large number of people. Several limitations need to be acknowledged. Self-reports from
Many individuals worldwide write, interact, or even just browse Egypt, the largest Arabic country with almost 100 million
social network content countless times a day. Social networks people, were inadequately represented in this study. This could
have the property of being continuously updated with new be attributed to factors such as Egypt’s preference for other
information provided by other global citizens. As such, it is social media platforms (eg, Facebook), as well as differing
crucial to monitor their content to identify health issues [13,14]. dialects and use of local idioms.
One potential benefit of analyzing social networks is
understanding COVID-19 symptoms and identifying people at Our study tracked 2 widely used keywords to identify Arabic
high risk [7]. patients with COVID-19 on Twitter, followed by a manual
extraction of symptoms. More complex keywords could reveal
Anosmia being one of the top 3 reported symptoms, mentioned additional interesting patterns about symptoms. Furthermore,
in 39% of reports, was a surprising result in our study. Several we used Modern Standard Arabic (MSA) keywords to obtain
tweeters complained about the longevity of anosmia. Our sample a general view of Twitter content in Arabic. It is, however, well
size is still relatively small to make any sound judgment in this noted in the literature that many Arabic users write in their own
regard. However, recent clinical studies have reported finding local dialect on social media. Hence, it is helpful to consider
anosmia in 35.7% of mild cases of COVID-19, which is not only keywords in the MSA form but also keywords that are
relatively close to our estimation from the tweets examined in tailored toward different Arabic dialects to better capture tweets
this study [15]. In fact, the number of self-reports reflects the on COVID-19 symptoms written in Arabic. This may explain
testing capacity of different countries. As of June 9, 2020, Saudi why Egypt was underrepresented in this study. Therefore, a
Arabia had completed almost 1 million tests, and Kuwait had multidialect COVID-19 Arabic dictionary and an natural
carried out more than 350,000 tests [16]. language processing–based algorithm to detect and analyze
It is worth noting that some users experienced weight loss due tweets in Arabic need to be developed; establishing a
to COVID-19; one user claimed losing 20 kg due to the disease. comprehensive medical dictionary for different local Arabic
http://www.jmir.org/2020/11/e21329/ J Med Internet Res 2020 | vol. 22 | iss. 11 | e21329 | p. 8
(page number not for citation purposes)
XSL• FO
RenderXJOURNAL OF MEDICAL INTERNET RESEARCH Alanazi et al
dialects is an important line of research during the coronavirus insights and studies are needed to investigate the gender
pandemic [17]. differences in information sharing behaviors and analyze
whether there is any notable difference in how male and female
We have extracted symptoms from users who likely underwent
Arabic users disclose health information on social media.
a screening test and, hence, tweeted based on its result; however,
we do not have confirmation of testing. In this study, we have Privacy is one of the key issues that needs to be addressed before
not used other COVID-19 sources; specifically, studying utilizing social media for public health surveillance. Apart from
personal reports in Arabic from both Facebook and Twitter each network’s privacy policy, there exists no global concensus
would have enhanced study results. on what to disclose when collecting health information from
social media networks. Some attempts in the literature have
The noticeable increase in May reports compared to other
suggested best practices to follow when collecting health
months demonstrates the importance of developing a real-time
information from Twitter [20]. Such practices include, among
surveillance system based on the symptoms reported in Twitter
other things, avoiding quoting directly from users’ tweets and
posts in Arabic. It also suggests further studies of information
mentioning users’ IDs. Moreover, some social media sites have
sharing behaviors in different communities and across different
updated their privacy policy to further control content
demographic groups (ie, users grouped by age, gender,
redistribution. For instance, Twitter’s updated policy permits
geolocation, etc) are needed [18].
redistribution of only the tweets’ ID and not their content
One interesting observation from our analysis is related to verbatim to third parties [21].
gender distribution. Approximately 25% of the collected reports
came from female users. This could be due to several reasons.
Conclusion
One reason could be the presence of more male Arabic patients This study identified the most common self-reported COVID-19
with COVID-19 than female ones; however, we are not aware symptoms from tweets in Arabic. Our findings demonstrated
of any reliable source to support this claim. Nevertheless, in that fever, headache, and anosmia are the 3 most common
Saudi Arabia, cases reported by males consistently outnumbered symptoms experienced by users, and we presented symptom
those reported by females in April and May 2020 [19]. Further prevalence for two of the largest clusters found in our tweets
database (Saudi Arabia and Kuwait).
Acknowledgments
This work was supported by King Abdulaziz City for Science and Technology (grant number: 5-20-01-007-0033).
Authors' Contributions
EA and A Alashaikh designed the study and wrote the manuscript. SA developed the social network analysis methodology and
collected related tweets using Twitter API. A Alanazi extracted and translated the symptoms collected from personal reports to
their scientific names. All authors approved the final version of the manuscript.
Conflicts of Interest
None declared.
References
1. Lee K, Agrawal A, Choudhary A. Real-time disease surveillance using Twitter data: demonstration on flu and cancer. 2013
Presented at: KDD '13: Proceedings of the 19th ACM SIGKDD international conference on Knowledge discovery and data
mining; August 2013; Chicago, Illinois, USA p. 1474-1477. [doi: 10.1145/2487575.2487709]
2. Alkouz B, Al Aghbari Z. Analysis and prediction of influenza in the UAE based on Arabic tweets. 2018 Presented at: IEEE
3rd International Conference on Big Data Analysis (ICBDA); 9-12 March 2018; Shanghai, China p. 61-66. [doi:
10.1109/icbda.2018.8367652]
3. Alkouz B, Aghbari ZA, Abawajy JH. Tweetluenza: Predicting flu trends from twitter data. Big Data Min. Anal 2019
Dec;2(4):273-287. [doi: 10.26599/bdma.2019.9020012]
4. Alotaibi S, Mehmood R, Katib I, Rana O, Albeshri A. Sehaa: A Big Data Analytics Tool for Healthcare Symptoms and
Diseases Detection Using Twitter, Apache Spark, and Machine Learning. Applied Sciences 2020 Feb 19;10(4):1398 [FREE
Full text] [doi: 10.3390/app10041398]
5. Sarker A, Lakamana S, Hogg-Bremer W, Xie A, Al-Garadi MA, Yang YC. Self-reported COVID-19 symptoms on Twitter:
an analysis and a research resource. J Am Med Inform Assoc 2020 Aug 01;27(8):1310-1315 [FREE Full text] [doi:
10.1093/jamia/ocaa116] [Medline: 32620975]
6. Klein A, Magge A, O'Connor K, Cai H, Weissenbacher D, Gonzalez-Hernandez G. A Chronological and Geographical
Analysis of Personal Reports of COVID-19 on Twitter. medRxiv 2020 Apr 22 [FREE Full text] [doi:
10.1101/2020.04.19.20069948] [Medline: 32511608]
7. Sinnenberg L, Buttenheim AM, Padrez K, Mancheno C, Ungar L, Merchant RM. Twitter as a Tool for Health Research:
A Systematic Review. Am J Public Health 2017 Jan;107(1). [doi: 10.2105/AJPH.2016.303512] [Medline: 27854532]
http://www.jmir.org/2020/11/e21329/ J Med Internet Res 2020 | vol. 22 | iss. 11 | e21329 | p. 9
(page number not for citation purposes)
XSL• FO
RenderXJOURNAL OF MEDICAL INTERNET RESEARCH Alanazi et al
8. Ministry of Health Saudi Arabia. The Central Appointment System (Mawid). Ministry of Health E-Services. URL: https:/
/www.moh.gov.sa/en/eServices/Pages/cassystem.aspx [accessed 2020-05-27]
9. Mackey T, Purushothaman V, Li J, Shah N, Nali M, Bardier C, et al. Machine Learning to Detect Self-Reporting of
Symptoms, Testing Access, and Recovery Associated With COVID-19 on Twitter: Retrospective Big Data Infoveillance
Study. JMIR Public Health Surveill 2020 Jun 08;6(2) [FREE Full text] [doi: 10.2196/19509] [Medline: 32490846]
10. Tweetgen. 2020. URL: https://www.tweetgen.com/ [accessed 2020-06-02]
11. Nugali N. Saudi Arabia’s active mass testing contains COVID-19 spread. Arab News. 2020 Apr 21. URL: https://www.
arabnews.com/node/1662856/saudi-arabia [accessed 2020-05-25]
12. Leading countries based on number of Twitter users as of April 2020. Statista. 2020. URL: https://www.statista.com/
statistics/242606/number-of-active-twitter-users-in-selected-countries/ [accessed 2020-05-28]
13. Paul M, Sarker A, Brownstein J, Nikfarjam A, Scotch M, Smith K, et al. Social media mining for public health monitoring
and surveillance. Biocomputing 2016 2016:468-479 [FREE Full text] [doi: 10.1142/9789814749411_0043]
14. Chunara R, Bouton L, Ayers JW, Brownstein JS. Assessing the online social environment for surveillance of obesity
prevalence. PLoS One 2013 Apr 24;8(4) [FREE Full text] [doi: 10.1371/journal.pone.0061373] [Medline: 23637820]
15. Levinson R, Elbaz M, Ben-Ami R, Shasha D, Levinson T, Choshen G, et al. Time course of anosmia and dysgeusia in
patients with mild SARS-CoV-2 infection. medRxiv. Preprint posted online April 14, 2020 [FREE Full text] [doi:
10.1080/23744235.2020.1772992] [Medline: 32552475]
16. Worldometer. COVID-19 Pandemic. 2020. URL: https://www.worldometers.info/coronavirus/ [accessed 2020-06-09]
17. Guo X, Li J. A Novel Twitter Sentiment Analysis Model with Baseline Correlation for Financial Market Prediction with
Improved Efficiency. 2019 Presented at: 2019 Sixth International Conference on Social Networks Analysis, Management
and Security (SNAMS); 22-25 Oct 2019; Granada, Spain. [doi: 10.1109/snams.2019.8931720]
18. Neiger BL, Thackeray R, Burton SH, Thackeray CR, Reese JH. Use of twitter among local health departments: an analysis
of information sharing, engagement, and action. J Med Internet Res 2013 Aug 19;15(8) [FREE Full text] [doi:
10.2196/jmir.2775] [Medline: 23958635]
19. Saudi Arabic Coronavirus disease (COVID-19) situation. KAPSARC. 2020. URL: https://datasource.kapsarc.org/explore/
dataset/saudi-arabia-coronavirus-disease-covid-19-situation/information [accessed 2020-07-22]
20. Conway M. Ethical issues in using Twitter for public health surveillance and research: developing a taxonomy of ethical
concepts from the research literature. J Med Internet Res 2014 Dec 22;16(12) [FREE Full text] [doi: 10.2196/jmir.3617]
[Medline: 25533619]
21. Twitter. Twitter Developer Policy. URL: https://developer.twitter.com/en/developer-terms/policy [accessed 2020-04-15]
Abbreviations
MSA: Modern Standard Arabic
Edited by G Eysenbach; submitted 12.06.20; peer-reviewed by A Sarker, A Alasmari, J Li, M Adly, A Adly; comments to author
13.07.20; revised version received 26.07.20; accepted 26.10.20; published 18.11.20
Please cite as:
Alanazi E, Alashaikh A, Alqurashi S, Alanazi A
Identifying and Ranking Common COVID-19 Symptoms From Tweets in Arabic: Content Analysis
J Med Internet Res 2020;22(11):e21329
URL: http://www.jmir.org/2020/11/e21329/
doi: 10.2196/21329
PMID:
©Eisa Alanazi, Abdulaziz Alashaikh, Sarah Alqurashi, Aued Alanazi. Originally published in the Journal of Medical Internet
Research (http://www.jmir.org), 18.11.2020. This is an open-access article distributed under the terms of the Creative Commons
Attribution License (https://creativecommons.org/licenses/by/4.0/), which permits unrestricted use, distribution, and reproduction
in any medium, provided the original work, first published in the Journal of Medical Internet Research, is properly cited. The
complete bibliographic information, a link to the original publication on http://www.jmir.org/, as well as this copyright and license
information must be included.
http://www.jmir.org/2020/11/e21329/ J Med Internet Res 2020 | vol. 22 | iss. 11 | e21329 | p. 10
(page number not for citation purposes)
XSL• FO
RenderXYou can also read