Air Ambulance Use and Surprise Billing - HHS/ASPE
←
→
Page content transcription
If your browser does not render page correctly, please read the page content below
September 10, 2021

                                                                                                                          HP-2021-20

                   Air Ambulance Use and Surprise Billing
      Available evidence suggests that air ambulance transport is increasing. Recent
         federal legislation and regulation address surprise billing and data gaps.

                          Gina Turrini, Joel Ruhter, Andre R. Chappel, and Nancy De Lew

    KEY POINTS
       •    Air ambulances are typically used to transport patients from the scene of an injury or an accident
            to hospitals, or between hospitals, particularly in critical situations when the time to treatment is
            urgent or when patients cannot safely travel by ground ambulance transportation.
       •    While the number of air ambulance transports is low – roughly 1 per 4,000 privately insured
            people per year and 1 in 350 Medicare beneficiaries – available evidence suggests there has been
            an increase in bases (where aircraft are stationed, typically airports or helipads) and
            providers/suppliers* (particularly independently owned and operated companies) in recent years
            and a shift towards for-profit entities.
       •    Patients typically do not have a choice in air ambulance providers, and providers often do not
            inquire about insurance, leading to the potential for large out-of-pocket costs for privately insured
            or uninsured patients. Air ambulance providers are not allowed to send balance bills (when an
            out-of-network provider bills an individual for the difference between the billed charge and the
            amount paid by their plan or insurance) to Medicaid or Medicare patients but privately insured
            individuals do not have the same protections against balance bills for air ambulance transports.
       •    A Government Accountability Office Report found that in 2017 the median price charged for a
            rotary wing (e.g., helicopter) ambulance transport was $36,400 versus $40,600 for a fixed-wing
            (e.g., airplane) ambulance transport. The Airline Deregulation Act of 1978 prevents states from
            regulating prices charged by air carriers (which includes air ambulance transport).
       •    The No Surprises Act, a component of the Consolidated Appropriations Act, 2021, addresses
            surprise air ambulance bills, effective January 1, 2022. Privately insured patients will pay only the
            deductibles and copayment amounts that they would have paid for in-network air ambulance
            providers, and balance billing will not be allowed.
       •    Information has been limited on air ambulances and their charges. The No Surprises Act
            addresses this issue by requiring reporting by air ambulance companies and health plans on cost,
            quality and other data to the Departments of Transportation and Health and Human Services.

*The terminology providers/suppliers means those who deliver air ambulance services. As discussed on page 3, CMS defines an
ambulance “provider” as being hospital-based, while an ambulance “supplier” is not institutionally based and can include privately
owned suppliers, as well as those run by entities such as volunteer fire departments or state/local government s. For brevity, we
generally refer to “providers” in this report.
                                                                                                                    ISSUE BRIEF      1
BACKGROUND
Air ambulances are used to transport patients via helicopter or airplane in critical and life-threatening
situations. Helicopters are typically used to transport patients from the scene of an accident or injury to the
hospital and tend to transport patients shorter distances. Airplanes are more typically used to transport
patients longer distances and between hospitals, particularly when time is critical or patients are too medically
unstable to be transported by ground. 1 Patients generally do not have a choice about which air ambulance
provider/supplier to use or information about whether their insurance will cover the trip, leading to concerns
about surprise billing and balance billing. 2 When an individual with health insurance coverage gets out-of-
network care (care from a health care provider that does not have a contract with the insurance plan
provider), the provider may bill the patient for the difference between the billed charge and the amount paid
by the patient’s insurance, a situation known as “balance billing.” A “surprise bill” is a balance bill that the
patient did not expect, often because they unknowingly received care outside of their health insurance’s
network. This can happen in both emergencies and non-emergencies, but both balance bills and surprise bills
may be particularly likely in emergencies when patients are vulnerable and less likely to have a choice of
providers. * However, there is relatively little information available about how much air ambulance providers
charge, how much of the cost is passed on to patients, and the costs of maintaining and running air ambulance
services. 3 At the same time, there have been longstanding legislative limits on regulating this industry. This
has led to renewed interest in better understanding this industry and in legislating solutions to address
surprise billing for air ambulance transports.
Recent policy attention to the issue of surprise billing renewed interest in charges for air ambulance
transports, culminating in the passage of the No Surprises Act, as part of the Consolidated Appropriations Act,
2021. While the number of air ambulance transports compared to ground ambulance transports is very low,
the costs and charges to patients are generally much higher, and in general, patients often do not have a
choice of emergency service providers. In addition, air ambulance providers typically do not inquire into the
health insurance coverage of patients before responding to an emergency (and in many cases should not,
given the urgent nature of these transports). These issues have motivated several states to attempt to
regulate prices charged by air ambulance providers, but these efforts have been struck down in courts based
on the Airline Deregulation Act of 1978. In this context, Congress enacted several provisions related to air
ambulances in the No Surprises Act.
Although there is limited information on the air ambulance industry, what data exists suggests that there has
been an increase in the number of bases (where aircraft are stationed, typically airports or helipads) and
providers over the past few years, although the distribution may lead to issues of oversupply in some areas
and undersupply in others. 4 In addition, there has been an overall shift away from non-profit providers
associated with hospitals to for-profit providers that are unassociated with hospitals, as well as a growing
number of providers owned by venture capital firms. 5 These industry changes have the potential to
exacerbate issues with high prices and balance billing to patients.
Charges for air ambulance transports are typically substantial and have been increasing, and for patients with
private insurance, a large fraction of transports of privately-insured patients are out-of-network. An internal
ASPE analysis of 2016 MarketScan data suggested that over 50 percent of air ambulance transports are out-of-
network, while in a report using 2017 FAIR Health data, the GAO estimated that 69 percent of transports of
privately-insured individuals were out-of-network. 6 Information on reimbursement by private payers or how
much is paid by patients is sparse. Reimbursement rates for air ambulance transports for patients with
Medicare or Medicaid are typically significantly lower than provider/supplier charges, and these patients
* More information about the distinction between these terms is available: https://www.cms.gov/newsroom/fact-sheets/requirements-
related-surprise-billing-part-i-inter im-final-rule-comment-p eriod.
September 2021 ISSUE BRIEF 2cannot be balance billed for these services. Many air ambulance providers do not have contracts with
hospitals or private insurance plans that specify the price of their services, which allows them to charge a
higher price to privately insured and uninsured patients. Air ambulance providers, on the other hand, often
point to challenges with contracting with payors. They note that operating air ambulance services has high
fixed costs for maintaining fleets of helicopters/airplanes and medical staff to be constantly ready for
emergencies, and argue that the reimbursements received for Medicaid and Medicare patients are lower than
their costs. 7 They argue that in many instances the rates offered by private insurance companies are
inadequate, 8 or that private insurance companies would rather face a rare high cost air emergency transport
than invest resources in negotiations with air ambulance providers. 9
This report summarizes key policies and legislation related to air ambulances, including the No Surprises Act,
and provides an overview of data around the use and costs of air ambulance services.
PROVIDERS, SUPPLIERS, AND AIRCRAFT
Air ambulance organizations typically fall into one of a few different models. CMS defines an ambulance
“provider” as being hospital-based, while an ambulance “supplier” is not institutionally based and can include
privately owned suppliers, as well as those run by entities such as volunteer fire departments or state/local
governments. * For brevity, we generally refer to “providers” in this report.
In 2018, according to the Atlas & Database of Air Medical Services (ADAMS), there were 1,114 air ambulance
bases in the United States. At these bases, there were 1,461 aircraft, including 1,111 rotary-wing (RW) aircraft
(in this context, rotary-wing refers to helicopters) and 350 fixed-wing (FW) aircraft (i.e., airplanes). There were
300 providers of air ambulance services, including 188 RW only, 75 RW and FW, and 37 FW only. In their 2019
report using these data, the Government Accountability Office (GAO) found that there was an overall increase
in bases between 2012 and 2017, but also a fair amount of turnover, with many bases closing during that time.
The GAO found that approximately 60 percent of new RW bases and about half of new FW bases are in rural
areas. Slightly less than half of new RW bases were in areas with at least 50 percent overlap with areas that
already had an air ambulance provider/supplier servicing the area, suggesting they may not be moving into
areas with the greatest need for services. 10 Entry of a new air ambulance organizations within an area that
already has a provider or supplier does not necessarily lead to lower prices because patients generally do not
have a choice over which one they use (the choice is typically based on whichever is available the fastest) and
are not provided with information on how much they will be charged before the transport. In addition, air
ambulance companies have high fixed costs, so if they experience lower service volumes, they may need to
raise prices to remain sustainable. 11 The GAO (as well as others such as the air ambulance industry and its
advocacy/industry organizations, as well as academic researchers and medical professionals ) has used ADAMS
data in its reports on air ambulances but notes that this source is based on voluntary reporting. Thus, some of
the increase in the number of providers, bases, and aircraft over time may be attributable to increased
reporting, but it is difficult to know for sure or by how much. These data are also available from ADAMS by
state.
Figure 1 shows how air ambulance bases are distributed across the United States. These bases can have
multiple aircraft as well as multiple providers who use them, so it is not a representation of service volume. In
fact, the geographic distribution seems quite different from the service volume maps that are shown later in
the paper.
*More information about these definitions and how Medicare processes air ambulance claims can be found:
https://www.cms.gov/Regulations-and-Guidance/Guidance/Manuals/downloads/clm104c15.pdf.
September 2021 ISSUE BRIEF 3Figure 1: Distribution of Air Ambulance Bases in the United States, 2018
Source: Atlas & Database of Air Medical Services, Association of Air Medical Services
CONTRACTING AND FINANCIAL INFORMATION
The traditional, or hospital-based model, is one in which the hospital provides medical services and staff while
contracting out to the air ambulance provider/supplier for transport services or provides both their own air
ambulances and staff. Hospital-based providers tend to be non-profit. The second is an independent or
community-based model, in which a private company owns and operates services rather than a specific
medical facility. For the community-based model, the owner may directly employ or contract with firms for all
air ambulance services including aviation and medical. The largest air ambulance organizations in the United
States operate as community-based providers and are typically for-profit entities. Government or military units
may also operate air ambulances, representing a third model. 12 A final category is the hybrid model, in which
hospitals provide the medical crew but do not make business or price decisions.
Between 1999 and 2008 there was a shift from providers being primarily hospital-based to almost evenly split
between hospital-affiliated and independent, and that trend away from hospital affiliation has continued. 13,14
In 2015, three for-profit, independent providers operated approximately two-thirds of helicopters in the
industry. 15 This shift has helped air ambulance providers increase revenue. Many air ambulance providers do
not contract with providers or payers, in order to capture higher payments than they would command through
negotiating prices. For example, in North Dakota, payments for non-contracting air ambulance services were
240 percent higher than what providers received when they contracted with insurers. 16
Financial information about air ambulances (for instance, profit margins and costs to the air ambulance
companies) is limited. Many of the companies are not publicly traded (there is also a trend toward ownership
by equity firms) and what information might be available has not been gathered or is no longer recent. For
instance, of the three companies who were the largest providers according to the GAO, two have recently
been purchased by private equity firms and one is publicly traded but going through bankruptcy proceedings. 17
In a presentation given in 2017, the largest of the three, Air Methods, reported having net revenue per
transport of over $12,000 in 2016 with margins for air medical services increasing from approximately 28
percent in 2013 to 31 percent in 2016. Whether this is representative of other, smaller providers is unknown.
September 2021 ISSUE BRIEF 4The No Surprises Act, discussed below, when fully implemented, will make significantly more information
about air ambulances available.
NUMBER AND DISTRIBUTION OF TRANSPORTS
Data on the number of air ambulance transports and characteristics of those transports are limited. Most
analyses examining air ambulance utilization use either Medicare claims or private claims, which preclude a
direct assessment of the number of air ambulance transports across all payers.
An analysis of private insurance claims from 2016 MarketScan data, representing roughly 43.5 million people
(less than one-sixth of the full U.S. population), * indicated a total of 9,928 air ambulance transports, of which
11 percent were FW and 89 percent were RW. In general, FW transports tended to be much longer (median of
138 miles compared to 31 for RW). An equal proportion – approximately 40 percent of RW and FW transports
– were in rural areas, but there was regional variation between the two types of transports.
Figure 2 shows the regional distribution of air ambulance transports, by type. FW trips were predominately in
the West (45 percent) and South (35 percent), with smaller shares in the Midwest (15 percent) or Northeast (5
percent). RW trips were more heavily concentrated in the South (55 percent) with a smaller proportion of
transports taking place in the Midwest (20 percent), West (16 percent), or Northeast (9 percent). A number of
factors such as distance to appropriate care and factors influencing driving time, such as terrain, likely play a
role in these regional patterns.
Figure 2: Distribution of Private Air Ambulance Claims by Region and Type, 2016
60%
50%
40%
% of claims
30%
20%
10%
0%
West South Midwest Northeast
Fixed wing Rotary wing
Source: MarketScan (Truven) private insurance air ambulance claims (2016)
In a GAO analysis of FAIR Health claims data from 2017, representing approximately 150 million people, or just
under half the U.S. population, GAO reported 33,800 air ambulance transports but did not report geographic
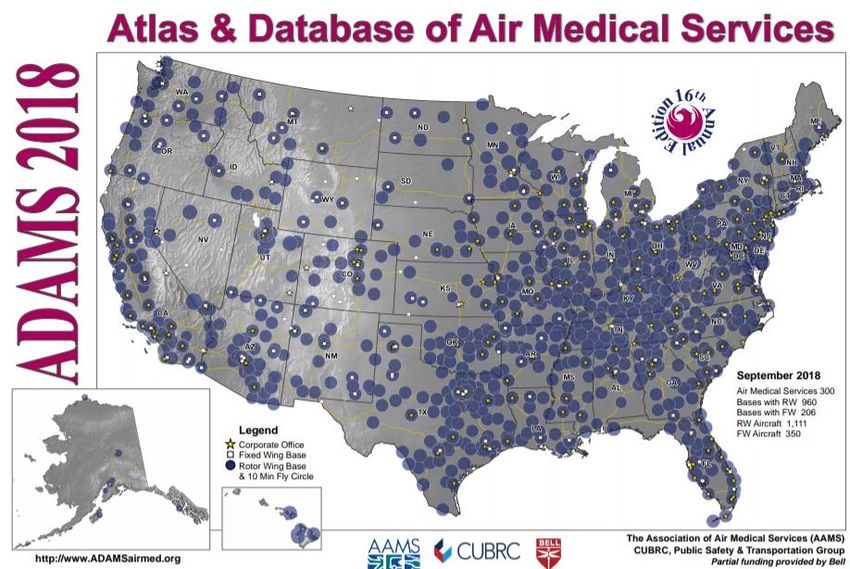
distribution. Figure 3 shows air ambulance transports as a percent of total ambulance transports by state,
*MarketScan data from Truven includes claims data primarily received from large employers (those covered by the individual mar ket and
most small employers are not included). Reports from GAO on air ambulances use an alternative source of private claims from FAIR
Health. Each of the possible sources of private claims coverage can give some sense of usage but does not provide a complete picture.
September 2021 ISSUE BRIEF 5comparing Medicare (2017) and MarketScan private claims (2016). The same figures for RW and FW
separately are in Appendix B.
Figure 3: Air Ambulance Transports as a Percentage of Total Ambulance Transports, by State
Based on the approximate population size in each dataset, both the Marketscan and FAIR Health claims data
point to a utilization rate of roughly 1 air ambulance transport per year per 4,000-4,500 privately insured
people. An analysis of Medicare claims data from 2014-2018 described in more length below showed a higher
utilization rate, roughly 1 transport per year per 350 people. By comparison, there were approximately 23
million ground ambulance visits to hospitals in 2016, for an approximate rate of 1 per year per 14 people. 18
The utilization of air ambulances also varies by rurality of residence. Table 1 shows the number of Medicare
beneficiaries utilizing air ambulances, the number of air ambulance transports, and Medicare payments over
2014-2018, comparing urban, rural, and super rural zip codes, based on our analysis of Medicare claims data. *
In general, rural areas have the highest number of air ambulance transports and beneficiaries, followed by
super rural areas, and these numbers have been slightly increasing over these years. Although the percent of
beneficiaries who take an air ambulance transport in a given year is small, it is higher in rural areas and has
been increasing over time. † Average Medicare payments for transports in super rural areas were higher than
in rural areas or urban areas, likely reflecting longer transport times in the former.
* Urban and rural are defined as either inside or outside of a metropolit an statistical area. Super-rural is a term unique to Medicare’s
ambulance fee schedule and is defined as zip codes located in a rural county that is among the lowest quartile of all rural c ounties in
terms of population density. More information is available: http://www.medpac.gov/docs/default-source/payment-
basics/medpac_payment_basics_16_ambulance_final.pdf?sfvrsn=0 .
† To account for beneficiaries who are enrolled for only part of a year in our calculation of total number of beneficiaries, we added the
number of months each beneficiary was enrolled in Part B (excluding those enrolled in Medicare Advantage) and divided by 12, to
annualize our total number of beneficiaries.
September 2021 ISSUE BRIEF 6Table 1: Air Ambulance Utilization of Medicare Beneficiaries by Rurality of Zip Code, 2014-2018
Number of beneficiaries Number of transports Total Medicare payments
(% of all beneficiaries) ($ million)
Urban Rural Super Total Urban Rural Super Total Urba Rural Super Total
Rural Rural n Rural
2014 19,274 39,009 27,673 85,956 19,713 40,451 30,168 90,332 $68.5 $213.0 $172.7 $454.2
(0.08%) (0.53%) (1.18%) (0.26%)
2015 20,492 40,591 29,848 90,931 20,943 42,049 32,623 95,615 $75.2 $221.5 $190.3 $487.0
(0.09%) (0.55%) (1.27%) (0.27%)
2016 24,519 40,078 29,746 94,343 25,091 41,695 32,341 99,127 $89.3 $225.1 $188.3 $502.7
(0.10%) (0.62%) (1.25%) (0.28%)
2017 24,824 40,506 30,803 96,133 25,358 42,170 33,898 101,426 $91.2 $230.8 $200.7 $522.7
(0.10%) (0.63%) (1.28%) (0.29%)
2018 24,735 39,405 31,474 95,614 25,269 41,010 34,561 100,840 $92.6 $228.6 $207.8 $529.0
(0.10%) (0.62%) (1.30%) (0.29%)
Note: Urban and rural are defined as either inside or outside of a metropolitan statistical area. Super -rural is a term unique to
Medicare’s ambulance fee schedule and is defined as zip codes located in a rural county that are among the lowest quartile of all rural
counties in terms of population density.
CHARGES AND REIMBURSEMENT
Air ambulance transports (both RW and FW) are generally covered by private insurance, Medicare, and
Medicaid only when ground ambulance transportation is inappropriate. The health insurance payer typically
makes the determination of whether an air ambulance transport was medically necessary. Particularly in
emergency situations where advance approval is not possible, this decision is often made retroactively and
creates additional risk of a patient receiving a surprise balance bill. Charges for air ambulance services typically
include both a fixed, service-level charge and an additional variable charge based on mileage. Other add-on
payments may also apply, such as geographic adjustments used by Medicare, based on whether the pick-up
location is urban or rural.
Using FAIR Health data from 2017, the GAO found that the median price charged for a RW transport was
$36,400 and the median price charged for a FW transport was $40,600, compared to $23,824 for a RW
transport and $24,344 for a FW transport in 2016 MarketScan data. 19 A recent study, analyzing Medicare
utilization data, found that average air ambulance charges in 2016 were approximately $39,000. 20 This study
also stratified median charges by the fixed service-level charge ($24,946 for rotary-wing; $17,838 for fixed-
wing) and by mileage ($238 per mile for rotary-wing; $104 per mile for fixed-wing). Providers in the northeast
generally had the lowest rates, but otherwise there was not a clear pattern across geographic areas.
Public programs reimburse air ambulance services at rates that are substantially less than typical charged
amounts (as is the case for most health care services). In 2016 the median Medicare service-level rate for
rotary wing aircraft was $4,814 and the mileage rate was $33. 21 These numbers include both the Medicare
payment amount as well as deductibles and coinsurance amounts. In fee-for-service Medicare, Part B covers
80 percent of the Medicare-approved amount. Medicare Advantage is required to cover at least the same
services as the traditional Medicare fee-for-service program, including ambulance services. However, the cost
structure of how MA reimburses may vary. Meanwhile, a study of Medicaid found that average payments for
providers ranged from $240 to $4,240 in 2016 (2017). Enrollees of Medicare and Medicaid cannot be balanced
billed for these services. Table 2 shows air ambulance and ground ambulance usage in 2017 in commercial
MarketScan claims and Medicare claims, and compares the charges in the private claims to the a llowed
charges in Medicare. Medicare allowed charges (including the amount paid by Medicare as well as deductibles
and coinsurance) for ground and air ambulance combined were over $6 billion in 2017 for over 15 million
September 2021 ISSUE BRIEF 7transports. For all types of ambulance transports, the charges for commercial claims is higher than the
Medicare allowed amount, but generally the ratio of commercial charges to Medicare allowed charges is
considerably higher for air ambulance claims than for most categories of ground ambulance claims. However,
these data do not indicate the negotiated rates actually paid by commercial payers , and it is likely that in many
cases for private insurers the charges may be higher than paid rates .
Table 2: Ground and Air Ambulances – Fee-for-Service Medicare Allowed Charges Compared to Commercial
Charges per Transport, 2017
Outcome Medicare MarketScan* Ratio of
(1% sample) MarketScan
charge per
Mean allowed Mean charge
transport to
charge
Medicare
allowed charge
per transport
Ground
Basic life support, non-emergency transport $191/transport $312/transport 1.63
Basic life support, emergency transport $334/transport $596/transport 1.78
Advanced life support, non-emergency, level 1 transport $244/transport $628/transport 2.58
Advanced life support, level 1 transport $404/transport $911/transport 2.26
Advanced life support, emergency, level 2 transport $576/transport $899/transport 1.56
Specialty care transport $676/transport $2,349/transport 3.47
Paramedic intercept $95/transport $572/transport 6.05
Air
Fixed wing transport $3,916/transport $16,112/transport 4.11
Rotary wing transport $4,499/transport $13,287/transport 2.95
Note: The Medicare allowed charges and Marketscan charges only include base per transport charges, not per mile additional charges.
For Medicare, for both base and mileage payments, there are add-on payments that vary by location (urban, rural, and super-rural). In
this table, these add-on payments are incorporated into the reported allowed charge . Medicare allowed charges include the amounts
paid by Medicare as well as deductibles and coinsurance. The charges from private insurers in MarketScan are likely in many cases
higher than the paid rates, which cannot be observed in these data.
* The charges from private insurers in MarketScan are likely in many cases higher than the paid rates, which cannot be observ ed in
these data.
Information on reimbursement by private payers is sparse. One analysis of claims from 2013-2017 covering a
large private insurer showed that while potential balance bills for ground ambulances were more common, the
median potential balance bill for air ambulance transportation was much larger ($21,698 for an air ambulance
versus $450 for ground ambulance). 22, * Some anecdotal evidence and information on balance bills suggests
that some insurers have negotiated rates with air ambulance providers and suppliers that are less than stated
charges, although higher than Medicare and Medicaid rates. An analysis of air ambulance services in Missouri
by the state’s Department of Insurance, Financial Institutions, and Professional Registration found that the
average insurance payment plus out-of-pocket spending for an air ambulance service was $23,087 in 2017,
compared to the average amount charged which was $41,321. 23 How much of the balance was sent to
patients or how much the patients ended up paying is unknown. Internal ASPE analysis using 2016
MarketScan data suggests that approximately half of both FW and RW transports in this dataset were out-of-
network, while the GAO report using FAIR Health data suggested that in 2017, 69 percent of those with
reported network status were out of network. These episodes may result in balance billing by the provider.
Other balance bill amounts analyzed by GAO in North Dakota, Maryland, and Montana were generally over
$10,000 with one as high as $66,600. 24
*
These are potential surprise bills because they are a comparison between out-of-network charges versus in-network prices for services. The authors do
not observe actual bills sent to patients or have knowledge about what, if anything, patients end up paying.
September 2021 ISSUE BRIEF 8LEGISLATION ADDRESSING AIR AMBULANCES
Federal Aviation Administration (FAA) Reauthorization Act
The Airline Deregulation Act of 1978 prohibits states from regulating the prices air carriers charge and their
routes and services. Any state law passed to regulate the prices of air ambulance services is preempted by this
law. In the private insurance sector, air ambulance transports are relatively rare events. There are few
incentives for either air ambulance providers and suppliers or insurers to enter into contracts with fixed rates
and fixed cost-sharing for enrollees. Thus, when an air ambulance incident occurs for privately insured
individuals, the air ambulance provider/supplier is frequently out-of-network, which can result in enrollees
receiving large bills to cover the costs. This situation does not occur with Medicare or Medicaid beneficiaries
since air ambulance services are covered, and balance bills for charges above what Medicare or Medicaid will
pay are prohibited. Prior attempts at the state level to address the issue of balance billing for privately insured
individuals have been unsuccessful in court due to federal preemption under the Airline Deregulation Act.
The FAA Reauthorization Act of 2018 (FAA Act) was signed into law October 5, 2018. Section 418 of the FAA
Act requires the Secretary of Transportation, in consultation with the Secretary of Health and Human Services,
to establish an advisory committee to “make recommendations with respect to disclosure of charges and fees
for air ambulance services and insurance coverage, consumer protection and enforcement authorities of both
the Department of Transportation and State authorities, and the prevention of balance billing to consumers ”
(see Appendix A for more detail).
The Department of Transportation, the parent organization of the FAA, has established this committee and it
has met three times, in January 2020, May 2021, and most recently in August 2021. *
No Surprises Act
The No Surprises Act, a component of the Consolidated Appropriations Act, 2021, addresses air ambulance
issues in two ways. First, in section 105, † it addresses the issue of surprise billing. Under the Act, plan
participants (individuals insured through employer-sponsored and commercial plans) are only required to pay
the in-network cost-sharing amount for out-of-network emergency care services, as well as for certain other
services. The Act also requires that any out-of-network expenses for the services covered under the Act
accumulate towards a plan participant’s in-network deductible and out-of-pocket maximum. These
requirements explicitly apply to providers of air ambulance services. The Act establishes an independent
dispute resolution process for resolution of differences between service providers and insurance plans and
issuers. However, the patient is not part of this process and cannot be balance billed. These provisions take
effect in January 2022, and HHS, together with the Department of Labor (which oversees self-insured
employer plans), the Department of Treasury (which oversees church plans), and the Office of Personnel
Management (OPM) (which oversees the Federal Employee Health Benefits Program) are developing rules to
implement these provisions. On July 1, 2021, HHS, the Department of Labor, the Department of the Treasury,
and OPM released an interim final rule with comment period (IFC) on the “Requirements Related to Surprise
Billing, Part 1.” This IFC implemented many of the No Surprises Act’s requirements relating to surprise billing
and cost-sharing for emergency services, including air ambulances services. 25
Another requirement of the No Surprises Act affecting air ambulances is an expanded information collection
effort. The elements of these information collections are to be established through rulemaking by HHS in
consultation with the Department of Transportation, taking into account the recommendations of the FAA’s
* See: https://www.transportation.gov/airconsumer/AAPB
† Consolidated Appropriations Act, 2021, No Surprises Act Section 105, https://www.congress.gov/bill/116th-congress/house-
bill/133/text
September 2021 ISSUE BRIEF 9Advisory Committee on Air Ambulance and Patient Billing, and will include information on items such as costs, locations of air ambulance bases, numbers and types of aircraft, number of transports by payer type, number of claims denied and reasons for denial and any additional information required by the HHS Secretary. Reporting will go into effect to cover the first full year after reporting requirements have been finalized, with civil money penalties for non-compliance. Reporting by plans, issuers and providers will be summarized into a comprehensive report by HHS in consultation with the Secretary of Transportation. The two Departments are also tasked with establishing an Advisory Committee on Air Ambulance Quality and Patient Safety. CONCLUSION The use of air ambulances is a rare but high cost event, with the potential of leading to large balance bills for privately insured and uninsured patients. Patients do not generally have a choice about whether to use an air ambulance or a choice of air ambulance providers. In addition, air ambulance providers typically do not inquire about a patient’s insurance status, and patients do not know ahead of time whether or how much of the cost of the transport their insurance will cover. Limited research and some anecdotal reports suggest the potential for balance bills is tens of thousands of dollars for a given transport. Over the past few years, the air ambulance industry appears to be changing, with fewer non-profit and hospital-based providers and more for-profit providers, and an increase in the overall number of air ambulance bases. There have also been concerns expressed by state insurance commissioners, among others, about geographic maldistribution of air ambulance providers, although this, like many aspects of the industry, has been hard to evaluate with existing data. For many years, there have also been legislative restrictions on state regulation of the industry. The No Surprises Act addresses several of these concerns by adding important surprise billing protections for patients for emergency services, as well as requiring collection of data on air ambulance use and costs. The data collection will enable more comprehensive assessment of the industry than was possible in this report as well as analysis of the impact of the balance billing protections in the No Surprises Act. September 2021 ISSUE BRIEF 10
APPENDIX A:
The Advisory Committee established in the 2018 reauthorization of the Airline Deregulation Act of 1978 shall
address, at a minimum—
         (1) the costs, benefits, practicability, and impact on all stakeholders of clearly distinguishing between
charges for air transportation services and charges for non-air transportation services in bills and invoices,
including the costs, benefits, and practicability of—
                  (A) developing cost-allocation methodologies to separate charges for air transportation
services from charges for non-air transportation services; and
                  (B) formats for bills and invoices that clearly distinguish between charges for air transportation
services and charges for non-air transportation services;
         (2) options, best practices, and identified standards to prevent instances of balance billing such as
improving network and contract negotiation, dispute resolution between health insurance and air medical
service providers, and explanation of insurance coverage and subscription programs to consumers;
         (3) steps that can be taken by State legislatures, State insurance regulators, State attorneys general,
and other State officials as appropriate, consistent with current legal authorities regarding consumer
protection;
         (4) recommendations made by the Comptroller General study, GAO–17–637, including what additional
data from air ambulance providers and other sources should be collected by the Department of Transportation
to improve its understanding of the air ambulance market and oversight of the air ambulance industry for the
purposes of pursuing action related to unfair or deceptive practices or unfair methods of competition, which
may include—
         (A) cost data;
         (B) standard charges and payments received per transport;
         (C) whether the provider is part of a hospital-sponsored program, municipality-sponsored program,
hospital-independent partnership (hybrid) program, or independent program;
         (D) number of transports per base and helicopter;
         (E) market shares of air ambulance providers inclusive of any parent or holding companies;
         (F) any data indicating the extent of competition among air ambulance providers on the basis of price
and service;
         (G) prices assessed to consumers and insurers for air transportation and any non-transportation
services provided by air ambulance providers; and
         (H) financial performance of air ambulance providers;
         (5) definitions of all applicable terms that are not defined in statute or regulations; and
         (6) other matters as determined necessary or appropriate.

 September 2021                                                                               ISSUE BRIEF    11
APPENDIX B:
Rotary-Wing Transports as a Percentage of Total Ambulance Transports by State
Fixed-Wing Transports as a Percentage of Total Ambulance Transports by State
September 2021 ISSUE BRIEF 12REFERENCES
1 GAO (2017). AIR AMBULANCE: Data Collection and Transparency Needed to Enhance DOT Oversight.
2 Ibid.
3 Ibid.
4 GAO (2019). AIR AMBULANCE: Available Data Show Privately-Insured Patients Are at Financial Risk.
5 GAO (2017). AIR AMBULANCE: Data Collection and Transparency Needed to Enhance DOT Oversight.
6 Ibid.
7 Myers, Chris. Three Reasons Health Insurers Are Bringing Air Medical Services In -Network. January 11, 2020. Managed Healthcare
Executive.https://ambulance.org/2017/11/22/response-kaiser-health-news-ambulance-billing-article/
8 Postma, Mark. Response to Kaiser Health News Ambulance Billing Article. American Ambulance Association.
November 22, 2020. https://ambulance.org/2017/11/22/response-kaiser-health-news-ambulance-billing-
article/
9 Brown ECF, Adler L, Chhabra KR, Richman BD, Trish E. The Unfinished Business of Air Ambulance Bills. Health
Affairs. March 26, 2021. https://www.healthaffairs.org/do/10.1377/hblog20210323.911379/full/
10 Ibid.
11 Ibid.
12 AHIP. State Policy Issue Brief: Air Ambulance Services. 2016. https://www.ahip.org/wp-
content/uploads/2018/01/AHIP-Air-Ambulance-Issue-Brief-10-24-16-FINAL.pdf.
13 GAO (2017). AIR AMBULANCE: Data Collection and Transparency Needed to Enhance DOT Oversight.
14 GAO (2010). AIR AMBULANCE: Effects of Industry Changes on Services Are Unclear.
15 GAO (2017). AIR AMBULANCE: Data Collection and Transparency Needed to Enhance DOT Oversight.
16 America’s Health Insurance Plans. State Policy Issue Brief: Air Ambulance Services. 2016. Available at:
https://www.ahip.org/wp-content/uploads/2018/01/AHIP-Air-Ambulance-Issue-Brief-10-24-16-FINAL.pdf
17 Ibid.
18 Rui P, Kang K, Ashman JJ. National Hospital Ambulatory Medical Care Survey: 2016 emergency department
summary tables. 2016. Available from:
https://www.cdc.gov/nchs/data/nhamcs/web_tables/2016_ed_web_tables.pdf.
19 GAO (2019). AIR AMBULANCE: Available Data Show Privately-Insured Patients Are at Financial Risk.
20 Bai G, Chanmugam A, Suslow VY, Anderson GF. 2019. Air Ambulanced with Sky-High Charges. Health
Affairs. 38(7).
21 Ibid.
22 Chhabra KF, McGuire K, Sheetz KH, Scott JW, Nuliyalu U, Ryan AM (2020). Most Patients Undergoing Ground
and Air Ambulance Transportation Receive Sizable Out-of-Network Bills. Health Affairs 39(5).
23 Missouri Department of Insurance, Financial Institutions, & Financial Registration (2019). Policy Brief: H ealth
Coverage for Air Ambulance Transport - Missourians Caught in the Middle. Available at:
https://insurance.mo.gov/reports/documents/TheAirAmbulanceCoverageGap2019ANAnnotations.pdf
24 GAO (2019). AIR AMBULANCE: Available Data Show Privately-Insured Patients Are at Financial Risk.
24 CMS https://www.cms.gov/newsroom/fact-sheets/requirements-related-surprise-billing-part-i-interim-final-
rule-comment-period
September 2021 ISSUE BRIEF 13HP-2021-20 U.S. DEPARTMENT OF HEALTH AND HUMAN SERVICES Office of the Assistant Secretary for Planning and Evaluation 200 Independence Avenue SW, Mailstop 447D Washington, D.C. 20201 For more ASPE briefs and other publications, visit: aspe.hhs.gov/reports ABOUT THE AUTHORS Gina Turrini is a Social Science Analyst in the Office of Health Policy in the Office of the Assistant Secretary for Planning and Evaluation. Joel Ruhter is an Analyst in the Office of Health Policy in the Office of the Assistant Secretary for Planning and Evaluation. Andre R. Chappel is the Director of the Division of Public Health Services in the Office of Health Policy in the Office of the Assistant Secretary for Planning and Evaluation. Nancy De Lew is the Associate Deputy Assistant Secretary for Health Policy in the Office of the Assistant Secretary for Planning and Evaluation SUGGESTED CITATION Turrini, G, Ruhter, J, Chappel, AR, and De Lew, N. Air Ambulance Use and Surprise Billing (Issue Brief No. HP-2021-20). Office of the Assistant Secretary for Planning and Evaluation, U.S. Department of Health and Human Services. September 2021. COPYRIGHT INFORMATION All material appearing in this report is in the public domain and may be reproduced or copied without permission; citation as to source, however, is appreciated. DISCLOSURE This communication was printed, published, or produced and disseminated at U.S. taxpayer expense. ___________________________________ Subscribe to ASPE mailing list to receive email updates on new publications: https://list.nih.gov/cgi-bin/wa.exe?SUBED1=ASPE-HEALTH-POLICY&A=1 For general questions or general information about ASPE: aspe.hhs.gov/about September 2021 ISSUE BRIEF 14
You can also read