Bank of America Merrill Lynch 2018 Media Communications & Entertainment Conference September 2018

Page created by Frances Obrien
 
CONTINUE READING
Bank of America Merrill Lynch 2018 Media Communications & Entertainment Conference September 2018
Bank of America Merrill Lynch
2018 Media Communications & Entertainment Conference
September 2018
Bank of America Merrill Lynch 2018 Media Communications & Entertainment Conference September 2018
Safe Harbor
This presentation may contain “forward-looking” statements, as defined in federal securities laws including the Private Securities Litigation Reform Act of 1995, which are based on
our current expectations, estimates, forecasts and projections. Statements that are not historical facts, including statements about the beliefs, expectations and future plans and
strategies of the Company, are forward-looking statements. Actual results may differ materially from those expressed in any forward-looking statements. The following important
factors, among other things, could cause or contribute to actual results being materially and adversely different from those described or implied by such forward-looking statements
including, but not limited to: those discussed in this release; we operate in highly competitive industries, and customers may not continue to purchase products or services, which
would result in reduced revenue and loss of market share; we may be unable to grow our revenues and cash flows despite the initiatives we have implemented; failure to anticipate
the need for and introduce new products and services or to compete with new technologies may compromise our success in the telecommunications industry; our access lines,
which generate a significant portion of our cash flows and profits, are decreasing in number and if we continue to experience access line losses similar to the past several years, our
revenues, earnings and cash flows from operations may be adversely impacted; our failure to meet performance standards under our agreements could result in customers
terminating their relationships with us or customers being entitled to receive financial compensation, which would lead to reduced revenues and/or increased costs; we generate a
substantial portion of our revenue by serving a limited geographic area; a large customer accounts for a significant portion of our revenues and accounts receivable and the loss or
significant reduction in business from this customer would cause operating revenues to decline and could negatively impact profitability and cash flows; maintaining our
telecommunications networks requires significant capital expenditures, and our inability or failure to maintain our telecommunications networks could have a material impact on
our market share and ability to generate revenue; increases in broadband usage may cause network capacity limitations, resulting in service disruptions or reduced capacity for
customers; we may be liable for material that content providers distribute on our networks; cyber attacks or other breaches of network or other information technology security
could have an adverse effect on our business; natural disasters, terrorists acts or acts of war could cause damage to our infrastructure and result in significant disruptions to our
operations; the regulation of our businesses by federal and state authorities may, among other things, place us at a competitive disadvantage, restrict our ability to price our
products and services and threaten our operating licenses; we depend on a number of third party providers, and the loss of, or problems with, one or more of these providers may
impede our growth or cause us to lose customers; a failure of back-office information technology systems could adversely affect our results of operations and financial condition; if
we fail to extend or renegotiate our collective bargaining agreements with our labor union when they expire or if our unionized employees were to engage in a strike or other work
stoppage, our business and operating results could be materially harmed; the loss of any of the senior management team or attrition among key sales associates could adversely
affect our business, financial condition, results of operations and cash flows; our debt could limit our ability to fund operations, raise additional capital, and fulfill our obligations,
which, in turn, would have a material adverse effect on our businesses and prospects generally; our indebtedness imposes significant restrictions on us; we depend on our loans and
credit facilities to provide for our short-term financing requirements in excess of amounts generated by operations, and the availability of those funds may be reduced or limited; the
servicing of our indebtedness is dependent on our ability to generate cash, which could be impacted by many factors beyond our control; we depend on the receipt of dividends or
other intercompany transfers from our subsidiaries and investments; the trading price of our common shares may be volatile, and the value of an investment in our common shares
may decline; the uncertain economic environment, including uncertainty in the U.S. and world securities markets, could impact our business and financial condition; our future cash
flows could be adversely affected if it is unable to fully realize our deferred tax assets; adverse changes in the value of assets or obligations associated with our employee benefit
plans could negatively impact shareowners’ deficit and liquidity; third parties may claim that we are infringing upon their intellectual property, and we could suffer significant
litigation or licensing expenses or be prevented from selling products; third parties may infringe upon our intellectual property, and we may expend significant resources enforcing
our rights or suffer competitive injury; we could be subject to a significant amount of litigation, which could require us to pay significant damages or settlements; we could incur
significant costs resulting from complying with, or potential violations of, environmental, health and human safety laws; the possibility that the expected synergies and value
creation from our acquisition of Hawaiian Telcom will not be realized or will not be realized within the expected time period; the risk that the businesses of the Company and
Hawaiian Telcom and other acquired companies will not be integrated successfully; the risk that unexpected costs will be incurred; and the other risks and uncertainties detailed in
our filings with the SEC, including our Form 10-K report, Form 10-Q reports and Form 8-K reports.
These forward-looking statements are based on information, plans and estimates as of the date hereof and there may be other factors that may cause our actual results to differ
materially from these forward-looking statements. We assume no obligation to update the information contained in this release except as required by applicable law.

                                                                                                                                                                                       2
Bank of America Merrill Lynch 2018 Media Communications & Entertainment Conference September 2018
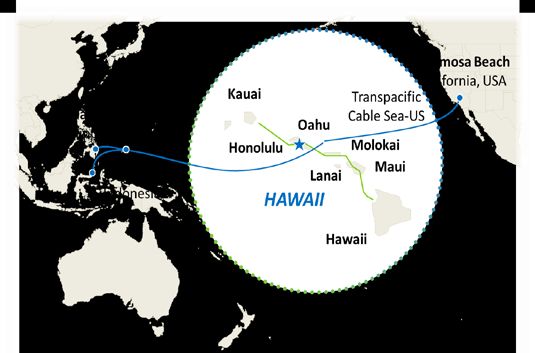
Non-GAAP Financial Measures
This presentation contains information about adjusted earnings before interest, taxes, depreciation and
amortization (Adjusted EBITDA), Adjusted EBITDA margin, net debt, net income (loss) applicable to common
shareholders excluding special items and free cash flow. These are non-GAAP financial measures used by
Cincinnati Bell management when evaluating results of operations and cash flow. Management believes these
measures also provide users of the financial statements with additional and useful comparisons of current results
of operations and cash flows with past and future periods. Non-GAAP financial measures should not be
construed as being more important than comparable GAAP measures. Detailed reconciliations of these non-
GAAP financial measures to comparable GAAP financial measures have been included in the tables distributed
with this release and are available in the Investor Relations section of www.cincinnatibell.com within the Investor
Relations section.

                                                                                                                 3
Cincinnati Bell’s Strategic
     Transformation
Cincinnati Bell’s Strategic Transformation
Enhanced Strategic Focus and Flexibility

      Building Two Distinct,                Entertainment & Communications                                 IT Services & Hardware
Complementary Lines of Business
With Expanded Geographic Reach,
  Customer Diversification and         Fiber continues to differentiate Cincinnati               Transform to become an international
 Increased Runway for Growth                  Bell from traditional carriers                        hybrid cloud solutions provider

        Focus on investing          • Strong demand for our fiber suite of products          • Strengthening North American platform
1       where we are
        winning
                                    • Combined network business with over 14k fiber
                                      route miles in Greater Cincinnati and Hawaii
                                                                                             • Growing UCaaS sales funnel – with more multi-
                                                                                               faceted wins nationwide

                                    • The more fiber, the greater the market                 • IT services business, combined with our network
2        Why we win                   penetration                                              expertise, while being faster and more flexible than
                                                                                               the competition

                                    • Continued investments in high speed, high              • Enhanced scale and expanded portfolio of
3        How we win                   bandwidth fiber network creates future-proof asset
                                      that has a high barrier to entry
                                                                                               complementary IT offerings to win larger, multi-
                                                                                               faceted deals

4       Significant market
        opportunity
                                    • Growth driven by IoT and 5G infrastructure spend       • Growth driven by UCaaS, cloud, and security

5        Multiple upside            • Network peers trading at ~8-11x                        • IT peers trading at ~8-10x

6        Capital structure                    • Leverage target of approximately 4.0x achievable through efficient integration of
                                                         Hawaiian Telcom and OnX – including realization of synergies

                                                                                                                                                  5
We Are Investing Where We Are Winning…                                                                                                                                            Entertainment &
                                                                                                                                                                                   Communications

• Expanded our fiber network to reach more than 70% of the homes and businesses in Greater Cincinnati (> 50% FTTP)
• We are winning against national competitors where we have fiber, with 40% Fioptics internet penetration
• Opportunity to replicate our fiber success in Hawaii, which has fiber to approximately 65% of the addresses on Oahu

           Wireline Capex Last 3 Years                                                   Fiber Availability                                                 Fioptics Growth
                as % of Revenue
                                                                                                                         +25 Mbps1
                                                                                                                                              ($ in mm)              LTM     Y/Y    Q2 2018    Y/Y
                                                                                                                         FTTP / 1 Gbps        Revenue                $327 +15%         $85 +11%
   32.1%                                                                 70.0%
                                                                                                                                              % of E&C Revenue       47%              49%

                                                                         17.0%                                                                Internet Subs (000s)                    235.3 +10%
                                                                                       54.0%                                                  % Penetration                            40%
                                                                                                      50.0%
                                                                                                                                              Video Subs (000s)                       145.1 +2%
                                                                                                                       42.0%                  % Penetration                            25%
                                                                                                                                  39.0%
               17.0%
                            15.5%         15.4%
                                                                        53.0%
                                                                                       39.0%          32.0%
                                                      13.7%                                                            20.0%
                                                                        1 Gbps
                                                                                                                                  24.0%
                                                                                                                                                                                            $310 $327
                                                                                                                                                                                     $254
                                                                                                       18.0%
                                                                                                                       22.0%
                                                                                                                                                                             $191
                                                                                                                       1 Gbps                                         $142
                                                                                                                                                          $68 $101
                                                                                        15.0%        +100 Mbps                     15.0%
                                                                                      +75 Mbps                                   +100 Mbps   $28   $47

     1           2           3             4           5
                                                                                                                                             2010 2011 2012 2013 2014 2015 2016 2017 LTM
                                      2           3           3                   4              5               5,6
                        1
                                                                                                                                                                                               Jun 30, 2018
                                                                                                                                                                  Fioptics Revenue

  Source: Company filings and Capital IQ (as of Dec 31, 2017)
  [1] Excludes Level 3 and adjusted for data centers
  [2] Pro forma for FairPoint
  [3] Historicals reflect actuals and are not adjusted to pro forma Verizon CTF, ELNK or Broadview
  [4] CBB reflects 50 Mbps or more; CTL reflects 40 Mbps or more as of Q2 2016
  [5] Not pro forma for Level 3 or EarthLink                                                                                                                                                         6
  [6] Expects 20% of homes with GPON / 1 Gbps by 2019
…Which Creates Competitive Advantages And Future                                                                                                                                      Entertainment &
                                                                                                                                                                                      Communications
Growth Opportunities
Not a matter of “IF” high bandwidth is necessary but a matter of when not having it makes you irrelevant

           Growth in Network Capacity and Speed Demands                                                                           5G and Small Cell Opportunity
                Forecast Global Data Traffic (PB/Month)1
                                                                                                           •        Market opportunity for 5G acceleration
                                                                                                                       –      Verizon plans to deploy 8k to 10k small cells in
                                                                                        278,108
                                                                     228,411                                                  Boston, investing $300 million over six years
                                              186,454
                         150,910                                                                                       –      AT&T plans to launch mobile 5G in 12 U.S. markets
     121,694                                                                                                                  this year
                                                                                                           •        UBS research estimates 500x increase in small cell sites to
                                                                                                                    support 5G densification in NYC, based on mmWave
       2017              2018                  2019                   2020         2021                             spectrum and 100 meter propagation distance
                     Fixed internet            Managed IP              Mobile data

                              Speed Capability (Mbps)                                                                                         Small Cells (000s) 4
                                                                                                                                                                                            455
   1,000       1,000        1,000                                    FTTN
                                                                                                                                                                                    350
                                                                                                                                                                       260
                                                                                                                                                         186
                                                        150                                                                                 125
                             ~200                      - 300          50 -
                                                                                                                               74
                                           300                                                                    25
                             - 300                                    100
                                                                                 3 - 25     3 - 12
                                                                 2           3
                                                                                                                 2016         2017         2018          2019         2020          2021    2022
    FTTH     Cable (DOCSIS 5G Wireless Cable (DOCSIS   G. Fast        VDSL        DSL       4G LTE
                  3.1)                      3.0)

                           Cincinnati Bell is Well-Positioned to Capitalize on IoT and wireless 5G Opportunities
  Source: Nokia, Wall Street research and news articles
  [1] Cisco VNI Forecast as of 6/6/17
  [2] G. Fast is “Fast access to subscriber terminals” and is a standard to offer fiber-like speeds over copper wires
  [3] VDSL stands for “very high bit rate digital subscriber line” and is digital subscriber line technology that provides data transmission faster than asymmetric data subscriber lines
  [4] SNL Small Cell and Tower Projections as of 8/30/17
                                                                                                                                                                                                   7
Completion of the Hawaiian Telcom Merger
    Combination with Hawaiian Telcom Represents Opportunity to Scale CBB’s Fiber Success in Another Attractive Market

                  • Adds operational scale and expands our metro-fiber fiber footprint and commercial opportunity in Hawaii
    Growth        • Opportunity to continue fiber investment in Hawaii – currently 65% coverage in Oahu, with opportunity to continue
  Opportunity       Oahu build and invest in other islands where ROI makes sense
                  • 2.6TB of Trans-Pacific fiber cable capacity connecting Asia and U.S.

   Business       • Hawaii’s fiber-centric technology leader providing voice, video, broadband, data center and cloud solutions
  Description     • Incumbent position with strong brand equity

    Closing       • Closed on July 2, 2018

   Expected       • ~$11M annually (to be realized within two years post-close, excluding potential revenue synergies from cross-selling
 Cost Synergies     opportunities)

              Hawaiian Telcom Network Map                                                 Hawaiian Telcom 2Q18 Results

                                                                        ($ in millions)            2Q18            Y/Y            Q/Q
                                                                        Revenue                     $89            - 2%           Flat
                                                                          Consumer                  $34            -1%            Flat
                                                                          Business                  $40            -4%            +2%
                                                                          Wholesale                 $13            Flat           -9%
                                                                          Other                     $2            -12%            +10%
• Fiber is available to more than 65% of the available                  Adj. EBITDA                 $22           - 18%           Flat
  325,000 homes and businesses on the island of Oahu

                                                                                                                                           8
Acquisition of OnX, Creating a Leading North American                                                                       IT Services &
                                                                                                                               Hardware
 IT Services Provider…
Combined IT Services business with a diversified customer base and increased geographic footprint

                    • OnX provides industry-leading technology services
    Business          and solutions to enterprise customers in the U.S.,
                                                                                                  20+            2,000+
   Description                                                                                    Offices        Customers
                      Canada and the U.K.

                    • Expansion of geographic footprint and addressable
                      market beyond Cincinnati to accelerate momentum
    Growth            in IT services
  Opportunity
                    • Attractive enterprise customer base adding                     Offices
                      diversification and cross-selling opportunities

                    • ~$10M annually
    Expected
                      *To be realized within two years post-close, and excluding
 Cost Synergies*      potential revenue synergies from cross-selling opportunities

                    • Closed on October 2, 2017                                          Key Technology Partners / Certifications
    Closing         • 2Q18 YTD Contribution:
 and 2Q18 YTD       − $90M in revenue
  Contribution

                                                                                                                                       9
                                                                                                                                       9
…which Positions Cincinnati Bell to Tap Into a                                                                                                    IT Services &
                                                                                                                                                    Hardware
Fragmented and Growing IT Services Market…

                     Fragmented IT Services Market1                                                                    Growing Markets
                                  $402B Market
                                                                                                                                       2017      2015-2020
                                             Top Provider
                                                                                            Market2
                                                                                                                                    Market Size3   CAGR
                                                  4%
                                                                                            Cloud-Based Unified Communications4          $109        13%
                                                                                            IaaS (Cloud)                                  18         32%
                                                            Next Top 10 Providers
                                                                     25%                    Enterprise Security Services                  22         10%
                                                                                            Tech Consulting & Implementation             120          3%

Other Service Providers
         71%                                                                                               Q2 ’18 YTD Service Revenue Mix

                                                                                                                                  Infrastruture
                                                                                                      Communications                Solutions
                                                                                                          32%                          20%
                 Scaling to Create Strategic Flexibility

             Goal of $100M Adj. EBITDA to create scale
                                                                                                                                     Consulting
                                                                                                                       Cloud           30%
                                                                                                                        18%

  [1] Based on Gartner research; Market defined as 2016A North America IT Services market
  [2] Based on Gartner research
  [3] Market size in billions, figures represent North America estimates
  [4] Includes cloud-based conferencing, telephony and messaging

                                                                                                                                                           10
                                                                                                                                                            10
…Focused on Growing Higher Margin, Recurring                                                                                                                          IT Services &
                                                                                                                                                                        Hardware
IT Services

                          Recent Strategic Initiatives                                                                  Growing Higher Margin Recurring Services
•        Launched nationwide SD-WAN and NaaS                                                          ($ in millions)
                                                                                                                                 Total Services Revenue1
         products
•        Reorganized segment adding CLEC commercial
         operations to highlight strength of growing                                                                     $317                   $331
                                                                                                                                                             $386

         UCaaS business
•        Continued demand for Communications                                                                             2016                   2017           LTM
                                                                                                                                                                            1

         services– recent 2Q18 YTD wins:                                                                                                                   Jun 30, 2018

                                                                                                                                 Diversifying Customer Mix
         •       UCaaS contract hosts 32,000 profiles
                                                                                                              GE Revenue % of IT Services & Hardware Revenue
                 across 96 locations (1Q18)
                                                                                                                                33%
         •       SD-WAN project delivers service to
                 approximately 50 sites (2Q18)
Transformation Has Created a Unique Scalable IT Services                                         IT Services &
                                                                                                   Hardware
Platform

                  1,500+                            2,800+                         2,400+
                  Employees                Technology Certifications                Customers

                25 Locations              Broad Solution Practices            Blue Chip Customer Base

                                     Communications              Cloud

                                       Consulting
                                        Services             Infrastructure

Note: Figures shown as of 12/31/17

                                                                                                          12
                                                                                                           12
Execution of Strategy Has Continued to Yield Results…

                          Disciplined Capital Allocation Strategy                             Reorganizing to Facilitate Growth and Cost Management

    •         Investments in fiber and IT solutions create                                •      Completed internal reorganization leading to
              platforms for long-term value
                                                                                                 two distinct business units, with the
    •         Monetized CyrusOne and wireless assets –                                           appropriate scale, structure and leadership
              improved leverage profile from ~6x in 2013 to ~4x                                  committed to driving their respective brands
              in 2017
                                                                                                 forward
    •         Ability to fund fiber investments through cash flow                         •      Reporting changes beginning 1Q’18 to improve
                                 Strategic Revenue Growth
                                                                                                 investors’ ability to appropriately value these
                                                                                                 services independently
        ($ in millions)
                                                                  $796                             –   Entertainment and Communications segment is
                          $727
                                                                                                       reported in the following three categories:
                                                                  $386
                          $331                                                                         Fioptics, Enterprise Fiber and Legacy

                           86                                         83
                                                                                                   –   IT Services and Hardware segment is reported in
                          310                                         327
                                                                                                       the following practices: Communications, Cloud,
                                                                                                       Consulting and Infrastructure Solutions
                        2017                                      LTM Jun 30, 2018
             Fioptics Revenue       Enterprise Fiber Revenue        IT Services Revenue                (previously referred to as Telecom and IT
                                                                                                       Hardware sales)
                                      % of Total Revenue

                           68%                                         69%

1. Represents Cincinnati Bell LTM Revenue, excludes Hawaiian Telcom

                                                                                                                                                         13
Strong Performance Through
      Transformation
Second Quarter 2018 YTD Highlights
Key Financial Metrics

                     Total Revenue                                               Adjusted EBITDA
                        ($ in millions)                                                   ($ in millions)
                                                                           $8                                           $14
                                                                            $8
                                                    $593                                                               $14
                                                                                 $151                                $159
              $509
          $85                                         $128
              $85                                   $256
             $166                                                                $15                                  $26
                                                                                  $3
               $5
                                                                           $72                                          $66
                                                                            $73                                       $67
                                                                               $138                                   $136
          $181$351                                  $348
                                                      $174
             $181                                     $174
                                                                                 $-5                                  -$3
             -$13                                 -$12
           2Q17 YTD                             2Q18 YTD                     2Q17 YTD                               2Q18 YTD
   Entertainment & Communications    One Time Fiber Build Project   Entertainment & Communications      One Time Fiber Build Project
   IT Services & Hardware            Intersegment                   IT Services & Hardware              Corporate

               Entertainment & Communications                                           IT Services & Hardware

                             Fioptics                                                     Communications
    Revenue of
                                                    589,200
                                                                     Revenue of                                     192,715
    $168M                                             addresses       $82M                                       Hosted UCaaS
                                                                                                                   Profiles
      +12% y/y                                         +6% y/y         +7% y/y
                                                                                                                     +24% y/y

                                                                                                                                       15
Continued Strong Demand for Fiber

Total Fioptics Subscribers                                          Fioptics Addresses                                Fioptics Penetration (y/y)
(in thousands)                                                      (in thousands)

                                                                                                             589        Video         25%
                                                                         557
                                                                                                                       Internet       40%
                                                                                                                         Voice        18%     =
   $214                                  $235
                                         235                                                       449
   214                                                                 416

                                                $145
                                                                                                                      Fioptics Monthly ARPU
          $143
          143                                   145
                  102                                  108
                                                                               141                              140
                                                                                                                        Video        $91    +5% y/y

                                                                                                                       Internet      $51    +3% y/y
          2Q17                                  2Q18                     2Q17                                2Q18

                 Internet      Video        Voice                                    FTTP (1)   FTTN   (2)               Voice       $30    +7% y/y

• Fioptics which includes a combination of FTTP and FTTN addresses, is
  available to 589,200 homes and businesses, or approximately 72% of                                                    CBB continues to win with
  Greater Cincinnati                                                                                                    fiber in a very competitive
• Cincinnati Bell offers FTTP to 55% of Cincinnati's total addressable market                                           environment

  1.   FTTP: fiber-to-the-premise   2.    FTTN: fiber-to-the-node

                                                                                                                                                      16
Hawaiian Telcom Performance & Integration
Consumer Market                                  Business Market                                 Carrier Market
• 2Q18 sequential revenue growth                 • Deployed fiber to the premise                 • Awarded major multi-year small
  from high-bandwidth fiber Internet               technology to 6,300 additional                  cell contract with a large national
  and video offset declines in legacy              small business addresses across                 wireless carrier to build 250 sites
  voice and DSL                                    the islands year-to-date                        in the next 12-18 months

                                                 • BVoIP and Ethernet growth                     • 2Q18 sequential revenue decline
       Internet    (y/y)       (q/q)               generated 2% sequential revenue                 primarily driven by pricing
     Revenue       14%          6%                 growth                                          pressure from national wireless
     Subscribers    4%          1%                                                                 carrier
     ARPU          10%          5%
                                                         BVoIP        (y/y)       (q/q)
       Video       (y/y)       (q/q)                  Revenue         20%          5%
     Revenue        4%           0%                   Subscribers     13%          1%
     Subscribers   10%           4%                   ARPU             5%          3%
     ARPU          -4%          -2%

                   Integration Focus Areas                                                 Hawaiian Telcom 2H18 Outlook

                                                                                    Revenue           • $175M - $185M
• Field Optimization                   • Improve Efficiency
• Network Optimization                 • Increase Penetration Rates            Adjusted EBITDA        • $43M - $49M

• Target Sales and Marketing           • Drive Higher Retention               Capital Expenditures    • $40M - $45M

• Customer Experience                    Rates                                                        • Plan to pass 2,000 new
                                                                                New Addresses
                                                                                                        addresses in Hawaii during 2H18

                                                                                                                                         17
IT Services &
                                                                                      Hardware

Strong Revenue Growth across Each Practice

  ($ in millions)            2Q18 YTD   Y/Y        Communications Metrics (y/y)
  Consulting                   $78      n/m             NaaS        782
  Cloud                         46      14%           Locations
  Communications                82      7%             SD-WAN                  Momentum in
                                                                   310        Communications
                                                       locations
  Infrastructure Solutions      50      n/m
                                                    Hosted UCaaS 192,715
  Total                        $256     54%
                                                      Profiles

                    Trusted provider of Voice services for more than 100 years

                                                                                               18
Free Cash Flow & Capital Structure
      ($ in millions)

 Free Cash Flow                                                                                         Capital Structure3
                                                                  2Q18      Y/Y
                                                                   YTD     Change
     Adjusted EBITDA (Non-GAAP)                                      $159       $8
                                                                                                       • Flexible capital structure with strong
     Interest Payments                                                (64)    (37)                       liquidity
     Pension and OPEB Payments                                         (6)      (1)
     Restructuring & Severance related payments                        (8)        9                    • No material maturities until 2024                                  $600
     Transaction and Integration Costs                                 (4)      (4)
     Income Tax Refunds                                                14       (3)
     Working Capital and Other                                         (1)      (5)
     Cash Provided by Operating Activities (GAAP)                     $90    ($33)
     Capital expenditures                                             (71)      34
                                                                                                                                                                            $625
     Restructuring & severance related payments                         8       (9)
     Preferred stock dividends                                         (5)    -                                                                                                    $350
     Transaction and Integration Costs                                  4       ( 4)                                                             $154   $35                               $88
                                                                                                                                                                  $22
     Free Cash Flow (Non-GAAP)                                        $26     ($4)

                                                                                                                              Bonds       Term Loan B         AR Facility      Credit Agreement
 Net Debt                                                        4.6x
                                                            Net Leverage(2)
                                                                                                         • Merger with Hawaiian Telcom
                              4.1x
                         Net Leverage(1)                                                                     ⁻ Cash payments totaled $560M including the repayment
                                                                                                               of Hawaiian Telcom debt and merger related fees and
                                                                 $1,907                                        expenses
                             $1,347
                                                                                                             ⁻ Issued 7.7M new Cincinnati Bell common shares for
                                                                                                               Hawaiian Telcom merger consideration
                         2Q18 Actuals                      2Q18 Proforma

1.    Calculated as net debt divided by original 2018 Adjusted EBITDA Guidance (mid-point) as provided on February 15, 2018
2.    Calculated as 2Q18 net debt actuals plus cash payments for Hawaiian Telcom merger divided by the sum of the original 2018 Adjusted EBITDA
      (mid-point) provided on February 15, 2018 plus Hawaiian Telcom year-to-date June 30, 2018 results plus the mid-point of expected contribution
      from Hawaiian Telcom for 2H18
3.    Excludes capital leases of $78 million as of period ending June 30, 2018
                                                                                                                                                                                                19
Capital Expenditures
 ($ in millions)

Capital Expenditures                                                              • Invested $38 million in Fioptics
                                                         YTD 2Q18
                                                                      FY 2018
                                                                     Guidance
                                                                                    year-to-date, passing an
                                        Construction       $15       $35 – $45      additional 17,000 new
                                        Installation        18        45 – 50       addresses
                                        Other               5           15

                                        Total Fioptics     $38      $95 – $110
                                                                                  • Expect to pass 40,000 new
                                                                                    addresses during 2018, up
Total IT Services & Hardware   Enterprise Fiber             8           20

$6                             Maintenance                  13          40          from original 35,000 target
$12      Total Entertainment & Communications              $59      $155 – $170
                                                                                  • Hawaiian Telcom plans to pass
$35 - $40                                                                           an additional 1,000 addresses
                   Total IT Services & Hardware            $12       $35 – $40      on Oahu and 1,000 addresses
        Actuals/Original Target                            $71      $190 – $210
                                                                                    on neighbor islands during
                                                                                    2H18

                   Total Hawaiian Telcom                    –        $40 – $45

        Actuals/Revised Target                             $71      $230 – $255

                                                                                                                       20
2018 Outlook

                                                             •    Updated previous 2018 financial guidance to
                           Revenue         Adjusted EBITDA        include the merger with Hawaiian Telcom,
                                                                  which closed on July 2, 2018
Previous Guidance      $1,200M – $1,275M   $320M – $330M

Hawaiian Telcom         $175M – $185M       $43M – $49M
                                                             •    Revenue guidance reflects adoption of new
                                                                  revenue recognition standard
Revised Guidance       $1,375M – $1,460M   $363M – $379M          ⁻ Infrastructure Solutions sales recognized
                                                                      net of product cost

                                                                               Impact of New Revenue Standard
            Selected 2018 Free Cash Flow Items
                                                             ($ in millions)                               Revenue
Capital Expenditures                 $230M – $255M
                                                             Revised Guidance                           $1,375 – $1,460
Interest payments                    $120M – $130M
                                                             Impact of new revenue recognition
                                                                                                             $505
Pension and OPEB payments            $20M – $30M             “ASC 606”

                                                             Revenue Guidance “Pre ASC 606”             $1,880 – $1,965

                                                                                                                          21
You can also read