Forecast of the COVID-19 trend in India: a simple modelling approach - Research Square
←
→
Page content transcription
If your browser does not render page correctly, please read the page content below
Forecast of the COVID-19 trend in India: a simple modelling approach Haitao Song Shanxi University Guihong Fan Columbus State University Shi Zhao The Chinese University of Hong Kong Huichen Li Shandong Provincial Hospital Qihua Huang Southwest University Daihai He ( daihai.he@polyu.edu.hk ) Hong Kong Polytechnic University https://orcid.org/0000-0003-3253-654X Research Article Keywords: COVID-19, India, mathematical modelling, iterated ltering, forecast DOI: https://doi.org/10.21203/rs.3.rs-502990/v1 License: This work is licensed under a Creative Commons Attribution 4.0 International License. Read Full License
Forecast of the COVID-19 trend in India: a simple modelling approach
 Haitao Song1, Guihong Fan2, Shi Zhao3, Huichen Li4, Qihua Huang5, Daihai He6,*

1 Complex Systems Research Center, Shanxi University, Taiyuan 030006, China
2 Department of Mathematics, Columbus State University, Columbus 31907, USA
3 JC School of Public Health and Primary Care, Chinese University of Hong Kong, Hong Kong, China
4 Department of Pulmonary and Critical Care Medicine, Shandong Provincial Hospital Affiliated to
Shandong University, Jinan, China.
5 School of Mathematical and Statistical Sciences, Southwest University, Chongqing 400715, China
6 Department of Applied Mathematics, Hong Kong Polytechnic University, Hong Kong, China

*Author for correspondence: Daihai He (daihai.he@polyu.edu.hk)

Abstract
By February 2021, the overall impact of the COVID-19 pandemic in India had been relatively mild in terms
of total reported cases and deaths. Surprisingly, the second wave in early April becomes devastating and
attracts worldwide attention. On April 30, 2021, India became the first country reporting over 400,000 daily
new cases. Multiple factors drove the rapid growth of the epidemic in India and caused a large number of
deaths within a very short period. These factors include a new variant with increased transmissibility, a lack
of preparations exists national wide, and health and safety precautions poorly implemented or enforced
during festivals, sporting events, and state/local elections. Moreover, India's cases and deaths are vastly
underreported due to poor infrastructure, and low testing rates. In this paper, we use the COVID-19
mortality data in India and a mathematical model to calculate the effective reproduction number and to
model the wave pattern in India. We propose a new approach to forecast the epidemic size and peak timing
in India with the aim to inform mitigation in India. Our model simulation matched the reported deaths
accurately and is reasonably close to results of serological study. We forecast that the IAR could reach 43%
by June 13, 2021 under the current trend, which means 532,629 reported deaths with a 95% CI (552,445,
513,194) ie., double the current total deaths. Our approach is readily applicable in other countries and with
other type of data (e.g. excess deaths).

Keywords: COVID-19; India; mathematical modelling; iterated filtering; forecast

Introduction
 The COVID-19 pandemic has lasted for more than a year now. The severity of the impact of
COVID-19 varied wildly across nations. While the pandemic started to slow down in most developed
countries due to the combined effects of high infection attack rate and high vaccination coverage, the impact
in India had been mild in terms of the total number of deaths and cases, until April 2021. An on-going
second wave of the COVID-19 devastates India ‘unexpectedly’ since early April 2021.
The unfold of the COVID-19 in India is as follows. On January 30, 2020, the first case of COVID-19 was
reported in Thrissur, India(1). On March 12, 2020, the first COVID-19 fatality in India was reported (2). On
March 31, 2020, a Tablighi Jamaat religious congregation event in Delhi resulted in a quarantine of 22,000
people. In March 2020, the cluster-containment campaign was carried out. However, by March 15, 2020,
only 10% of the testing capacity had been used per day in India. By early July 2020(3), the seroprevalence
reached 57% or 16% among inhabitants in three slums or other areas of Mumbai, which is the commercial
capital of India. These high infection attack rate (IAR, proportion of population got infected) caught wide
media attention. A supermodel for COVID-19 progression developed by a government-appointed committee
(4) estimated that the COVID-19 (first wave) peaked in October 2020 and it would be under control by
February 2021. Unexpectedly, a new variant, named Lineage B.1.617, was detected in India in October 2020
(5, 6) and is blamed as one of the factors for the second wave. In October 2020, B.1.617.3 (the first
sublineage of this variant) was first detected in India. Subsequently, B.1.617.1 and B.1.617.2 were detected
in December 2020 (7). From February 2021, new cases of B.1.617 increase rapidly in India (5). From the
global initiative on sharing all influenza database (8), B.1.617 contributed to 63.6% infections of COVID-19
in India in April 2021.
The early stage of COVID-19 epidemic mitigation in India was promising. As reported in (9), it had the highest number of daily tests in the world by the third quarter of the year 2020. The vaccination program was also initiated on 16 January 2021. By February 2021, the confirmed cases of COVID-19 had dropped to 9,000 people per day. However, the pandemic changed dramatically thereafter. A major second wave of the COVID-19 emerged in India in early April 2021. By the end of April, an average of 300,000 daily new cases and 2000 daily deaths were reported. For instance, on April 30, a total of 400,000 daily new cases and 3500 daily deaths were reported. Multiple factors drove the rapid expansion of the epidemic in India and caused a large number of deaths, which include the appearance of a new SARS-CoV-2 variant (Lineage B.1.617), the lack of preparation, poorly-implemented or enforced health and safety precautions during festivals, sporting events, state/local elections. As of May 3, 2021, nearly 20 million confirmed cases and 218,959 deaths were reported in total. During the period of the second wave in India, test positivity has increased dramatically from 2% on March 1 to 22% on May 1. Seroprevalence estimated that the prevalence of infection among people ten years or older was 6.6% and a cumulative 74.3 million people had be infected with COVID-19 by August 2020 (10). However, only 3,621,245 cases and 64,469 deaths were reported by August 2020 (9). A survey (7) conducted by the Indian Council of Medical Research (ICMR) found that 21.4% of 28,589 surveyed people above 18 years old had been infected by Feb 4, 2021.These serological studies found a much higher IAR than reported cases, namely a very low ascertainment rate or reporting rate. Therefore, one needs to take into account these serological studies into modelling to yield reasonable IAR estimation and useful forecast for pandemic mitigation. Mathematical modelling can be successfully used to explain and predict the spread of infectious diseases (11, 12). In this work, we adopt a simple compartmental epidemic model. The model assumes a time-dependent transmission rate due to the changes in human behaviour and the implementation of control measures. Thus models for forecast need to incorporate time-varying transmission rate. Other epidemic parameters, including the generation interval, the reporting rate, and the infection fatality rate may vary as well. But for the sake of simplicity of the model and identification issues (whether the change can be detected via model fitting), we focus on time-varying transmission rate and assume other parameters to be constant. Methods We download daily reported COVID-19 cases and deaths from (9). To have a better understanding of the historical seasonality of respiratory diseases, we also download weekly reported influenza cases from (13). We adopt a susceptible-exposed-infectious-hospitalized-death-recovered (SEIHDR) model with a time-varying transmission rate: ̇ = − , ̇ = − , ̇ = − , ̇ = − , ̇ = , ̇ = (1 − ) + (1 − ) . Here, the compartments S, E, I, H, D, and R denote susceptible, exposed, infectious, hospitalized, total death, and recovered individuals, respectively. Parameter ( ) is the transmission rate, is the infectiousness emergence rate (0.5 per day), is the infectiousness disappearance rate (1/3 per day), is the removed rate (1/14 per day), is the ratio of hospitalized cases out of all infected cases, and is the proportion of deaths out of hospitalized cases. All parameters are constant except ( ) being time-varying. Since we did not fit model to the daily hospitalized cases, the exact definition of hospitalized class is not relevant. Namely, the H class can be viewed as severe cases or symptomatic cases. We consider that ≪ 1 and ≪ 1. The product equals the infection fatality rate. These two cannot be disentangled with purely death data and without additional reliable data (e.g. hospitalized data). Thus we fix at 0.05 and estimate . The result is insensitive to the value choice of . The choice of the fixed values for (0.5 per day), (1/3 per day), and (1/14 per day) imply a generation time of 5 days (14, 15) and a delay from symptom onset to death about 14 days (16).
Based on previous works (17-19), ( ) = exp(cubic spline with nodes) as an exponential cubic spline with nodes evenly distributed over the study period. Using standard model selection technique, we found =8 attains the smallest the second order Akaike Information Criterion (AICc). Thus =8 is used in this work. The time step size is one day and Dt is the daily deaths. The reported deaths were defined as Ct with Ct ~ NegativeBinomial (mean Dt , variance Dt (1 Dt )). Here, the parameter denotes the overdispersion and accounts for the measurement noise due to surveillance and heterogeneity among individuals. The basic reproductive number 0 ( ) = ( )/ is a function of time. We fit the model to reported deaths with state-of-the-art iterated filtering (20, 21), and assume that death report is relatively insensitive to testing policy, testing effort, and testing availability. Although an even better way would be to use the excess deaths (22), our modelling approach is readily applicable to excess deaths. Our study period (training part) is from March 12, 2020, to April 28, 2021. We append 45 days of N.A. value (not applicable) to the end of the training data. Then we fit our model to the whole time series. The last 45 days (from April 29 to June 13, forecast part) play no role in the fitting since the data for that period are N.A. Our cubic spline spans from the whole time series anyway (both training part and forecast part). Thus the transmission rate over the training part is estimated from the data, the transmission rate over the forecast part is a natural extension of that over the training part. Thus we can simulate our model and yield both the training part and the forecast, for we have the initial state (end state of the training part) and transmission rate (natural extension) for the forecast part. Results Figure 1 plots daily reported COVID-19 cases and deaths in India, compared with reported weekly influenza in the previous five years and the current year. Influenza persisted yearly in the previous five years with peaks in March and April, which could be associated with religious holidays and/or large gatherings (e.g. elections). For instance, Holi (a popular ancient Hindu festival, also known as the Festival of Love) is on March 29, and Haridwar Kunbh Mela is celebrated in April 2021. At the same time, the elections in India in 2021 were held in April 2021. The cohort of these large gatherings and celebrations is a driving factor of the spread of COVID-19 and causes a dramatic increase of new cases and deaths in India. Figure 1. Reported daily Covid-19 cases and deaths in India, compared with reported weekly influenza in the previous five years and the current year. Influenza persists through a year in the previous five years with a peak in March-April, which could be associated with religious holidays and/or large gatherings (e.g. elections).
United States of Amer ica Brazil
 5 1 5 1
 vaccine coverage= 44.79 % vaccine coverage= 13.272 %

 vaccination coverage

 vaccination coverage
 daily deaths per 1m

 daily deaths per 1m
 4 0.8 4 0.8

 3 0.6 3 0.6

 2 0.4 2 0.4

 1 0.2 1 0.2

 0 0 0 0

 Mar May Jul Sep Nov Jan Mar May Mar May Jul Sep Nov Jan Mar May
 2020 2021 2020 2021
 India Mexico
 5 1 5 1
 vaccine coverage= 9.42 % vaccine coverage= 4.253 %

 vaccination coverage

 vaccination coverage
 daily deaths per 1m

 daily deaths per 1m
 4 0.8 4 0.8

 3 0.6 3 0.6

 2 0.4 2 0.4

 1 0.2 1 0.2

 0 0 0 0

 Mar May Jul Sep Nov Jan Mar May Mar May Jul Sep Nov Jan Mar May
 2020 2021 2020 2021

Figure 2. Comparison of the population standardized report of Covid-19 deaths (black curve) in four
countries and vaccination coverage (two doses, blue circle, and line). Overall, the COVID-19 impact in
terms of death per capita in India is relatively low (thus a very large susceptible pool), compared with the
other three countries. But the recent rapid increasing trend is troubling given the very large baseline
population. The vaccination coverage is at a relatively low level.

 Figure 2 compares the population standardized report of Covid-19 deaths in four countries. The daily
death per capita in India is still at a relatively low level compared to the other three countries. However,
from the beginning of April 2021, the rapid elevation of the second wave of COVID-19 in India is
devastating with 300,000 daily new cases for14 consecutive days and 3,000 daily deaths for 5 consecutive
days. Such a dramatic increase in daily cases attracted worldwide attention and global concern.
 Figure 2 also shows that the vaccination coverage rate is 44.79% in the United States of America while
9.42% coverage in India. The vaccination program was launched on January 16, 2021, in India, and 4
million doses per day were administered by April 2021. However, the overall coverage of vaccines at the
population level is still low. Some states in India were unable to begin vaccination due to the shortage of
vaccination supplies. The shortage of vaccination supplies makes the epidemic of COVID-19 in India even
worse.
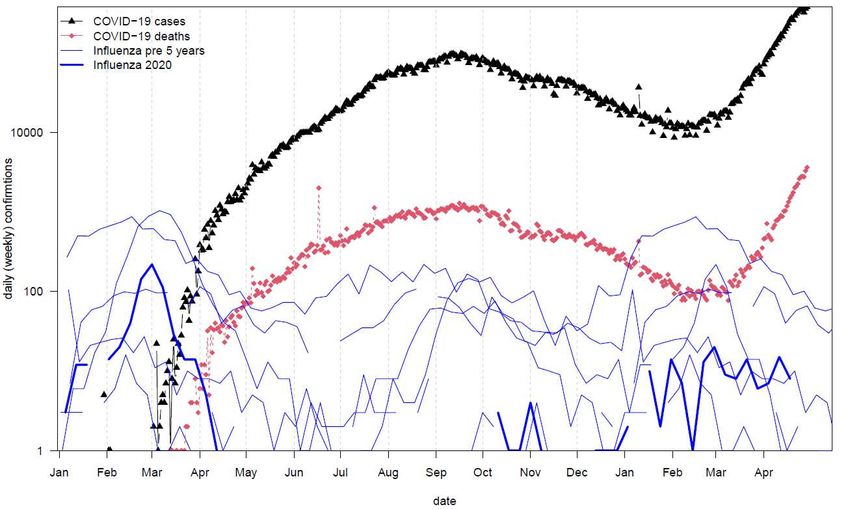
3.0
 100 reported cases
 simulation median
 transmission rate
 2.5
 80

 2.0
 daily deaths

 60

 R 0(t)
 1.5

 40
 1.0

 20
 0.5

 0 0.0
 Apr Jun Aug Oct Dec Feb Apr Jun

Figure 3. Fitting an SEIHDR model to the reported death in India with a flexible transmission rate. The
estimated infection attack rate could reach 43%by June 13, 2021. The training part of the data is from March
13, 2020, to Apr 28, 2021. The forecast part is from April 29 to June 13, 2021. The red circles denote daily
reported COVID-19 deaths. The black curve denotes the median of 1000 model simulations. The shaded
region denotes the 95% region of the 1000 model simulations. The blue dashed curve denotes the
reconstructed transmission rate. The transmission rate showed a decreasing trend in the next 1.5 months
which resembles the decrease in transmission rate last year March-April.

Figure 3 shows the fitting and forecast results. Our model simulation well matched the reported deaths.
The reconstructed transmission rate ( 0 ( ), blue dashed curve) showed a decreasing trend in March-April
2020 and a wave pattern in March-April 2021 with a peak on May 11, 2021. The daily reported deaths will
peak on May 26, 2021, with a two-week delay to the peak of the transmission rate. The daily reported deaths
could reach a peak level of about 10131. The infection attack rate will reach 43% by June 13, 2021, under
the current trend, which means 532,629 reported deaths with a 95% CI (552,445, 513,194) ie., double the
current total deaths by June 13, 2021. Our estimated IAR is about 10% by Feb 2021, which is lower than the
estimates of serological study of ICMR 21.4% (23). However, our estimated IAR is about 5.4% by August
2020, which is very close to the serological study of 6.6% (10).

Discussion and Conclusion

 We proposed a simple model approach for modeling and forecast the COVID-19 epidemic in India.
The method can be readily applied to other countries. Given the daily reported death data with a length of 13
months, we forecast the trend of COVID-19 in the next 45 days (April 29 to June 13, 2021), by fitting a
model with a cubic spline type of transmission rate function to the whole study period including both the 13
months observed data and the 1.5 months N.A. deaths. In calculating the fitting performance, each N.A. will
yield a likelihood of 1, thus zero contribution to the log-likelihood. In other words, if an N.A. data point
appears in the middle of the training data part, it will yield a conditional likelihood 1, thus zero contribution
to log-likelihood, whereas the transmission rate is not only continuous at that data point but also continuous
on the second order derivative. Here we add N.A. data at the end of the observed data, but the logic is
similar. When the forecast part is relatively short, this method should work well. Hence, the reconstructed
transmission rate naturally contains a part over the forecast period, which shows a decreasing trend. This
decreasing trend mimics the decreasing trend in last March-April. This decreasing trend means that the
current spreading of COVID-19 in India has already started to slow down (e.g., on the second order
derivative).
The objective of this study is to model and forecast the transmission of COVID-19 in India. The
estimated infection attack rate (IAR) could reach 43% by June 13, 2021. Huang et al. (24) predicted that
33,470,999 (upper bound) confirmed cases would be reported by May 31, 2021, which means a 2.4%
infection attack rate (case/population). This is obviously low. If a 1/10 (or 1/20) reporting rate is considered,
then the IAR becomes 24% (or 48%). This is largely reasonable. Namely, a reporting rate needs to be
assumed. In our case, we explicitly modeled infection fatality rate (IFR) and assumed that the death data is
relatively reliable. The estimated infection fatality rate is 0.1%, which is significantly lower than a
biologically reasonable level 0.6%. For instance, Russell et al. (17) estimated an IFR of 0.6% in China. This
implies that the COVID-19 death is under-reported by a factor of 1/5 or 1/6 (25). Thus, these estimates of
IFR relied on the confidence of the COVID-19 death data. If death data are under reported by a factor, then
the IFR could be under estimated by the same factor.
 The long-term prediction is very difficult, due to the ever-changing reality like human behavioral
change and governmental action. Here we proposed a simple modeling approach. We assumed that the
transmission rate in the forecast part is a natural extension of the training part. Both parts constitute a whole
(exp-) cubic spline function. Ranjan et al. (26) estimated the peak for the second wave to occur in mid-May
2021 with a daily count exceeding 0.35 million. However, on April 30, 2021, a total of 400,000 daily new
cases and 3,500 daily deaths were reported, and there are 300,000 daily new cases for14 consecutive days
and 3,000 daily deaths for 5 consecutive days. The prediction in (26) is apparently lower than reality.
According to the seroprevalence results (6), Murhekar et al. estimated a cumulative 74.3 million infection
while 3,621,245 cases were reported in India by August 2020.Then mortality data of COVID-19 in India
was used to predict the transmission of COVID-19 in India, which is largely reasonable.
 The strength of this work includes that we fit a simple model to the reported death which is believed
insensitive to COVID-19 testing efforts compared to reported cases. Mild cases will less likely to be tested.
Thus fluctuation in the reported cases likely contains variation in testing efforts. We assume the transmission
rate in the forecast period is a natural extension of that over the training part. Both the first and second
derivatives are continuous in the transition point between training and forecast. To our knowledge, this
approach is novel. We compared our estimated IAR to the reported serological studies. To our knowledge,
very few studies have done such a comparison. We argue that it is important that the model output is largely
in line with the serological study at different time points.
 The limitation of this work includes: we assume all parameters are constant except for the transmission
rate; the model is for the whole country while we ignore the heterogeneity across regions. We only relied on
the reported data and adopted a non-mechanistic cubic spline function type of transmission rate.
Alternatively, one could consider explicitly incorporate all kinds of control measures (e.g. google mobility
matrix, etc.) We ignored the effects of vaccination since the two-dose coverage only reached a lecvel
Scientific Activities of Selected Returned Overseas Professionals in Shanxi Province (20200001).

Acknowledgments
None.

Disclaimer
The funding agencies had no role in the design and conduct of the study; collection, management, analysis,
and interpretation of the data; preparation, review, or approval of the manuscript; or decision to submit the
manuscript for publication.

Conflict of interests
None.

Author’s contributions
DH, HS, and GF conceived the study, carried out the analysis, and wrote the draft. SZ, HL, and QH
discussed the results, revised the manuscript critically, and approved it for publishing.

Reference

1. Andrews M, Areekal B, Rajesh K, Krishnan J, Suryakala R, Krishnan B, et al. First confirmed case of
COVID-19 infection in India: A case report. The Indian Journal of Medical Research. 2020;151(5):490.
2. Kaushik S, Kaushik S, Sharma Y, Kumar R, Yadav JP. The Indian perspective of COVID-19 outbreak.
Virusdisease. 2020;31(2):146-53.
3. Biswas S. India coronavirus: 'More than half of Mumbai slum-dwellers had Covid-19'. 2020.
4. Biswas P. Covid-19 peak over; pandemic can be controlled by February 2 ..
 [Available from:
http://timesofindia.indiatimes.com/articleshow/78732643.cms?from=mdr&utm_source=contentofinterest
&utm_medium=text&utm_campaign=cppst.
5. cov-lineages.org. PANGO lineages Lineage B.1.617 [Available from:
https://cov-lineages.org/lineages/lineage_B.1.617.html.
6. Rambaut A, Holmes E, O’Toole Á, Hill V, McCrone J, Ruis C, et al. A dynamic nomenclature proposal for
SARS-CoV-2 lineages to assist genomic epidemiology. Nat Microbiol 2020. Preprint] July. 2020;15.
7. WHO. Weekly epidemiological update on COVID-19 - 27 April 2021. 2021.
8. Sahoo JP, Mishra AP, Samal KC. Triple Mutant Bengal Strain (B. 1.618) of Coronavirus and the Worst
COVID Outbreak in India. Biotica Research Today. 2021;3(4):261-5.
9. WHO. WHO Coronavirus (COVID-19) Dashboard [Available from: WHO Coronavirus (COVID-19)
Dashboard.
10. Murhekar M, Bhatnagar T, Selvaraju S, Kumar VS, Thangaraj JWV, Shah N, et al. SARS-CoV-2 Antibody
Prevalence in India: Findings from the Second Nationwide Household Serosurvey, August-September 2020.
2020.
11. Earn DJ, Rohani P, Bolker BM, Grenfell BT. A simple model for complex dynamical transitions in
epidemics. Science. 2000;287(5453):667-70.
12. Keeling MJ, Rohani P. Modeling infectious diseases in humans and animals: Princeton university press;
2011.
13. WHO. FLUNET [Available from: https://www.who.int/influenza/gisrs_laboratory/flunet/en/.
14. Griffin J, Casey M, Collins Á, Hunt K, McEvoy D, Byrne A, et al. Rapid review of available evidence on
the serial interval and generation time of COVID-19. BMJ Open. 2020;10(11):e040263.
15. Svensson Å. A note on generation times in epidemic models. Math Biosci. 2007;208(1):300-11.
16. de Souza WM, Buss LF, da Silva Candido D, Carrera J-P, Li S, Zarebski AE, et al. Epidemiological and
clinical characteristics of the COVID-19 epidemic in Brazil. Nature Human Behaviour. 2020;4(8):856-65.
17. He D, Zhao S, Lin Q, Musa SS, Stone L. New estimates of the Zika virus epidemic attack rate in
Northeastern Brazil from 2015 to 2016: A modelling analysis based on Guillain-Barré Syndrome (GBS)
surveillance data. PLoS Negl Trop Dis. 2020;14(4):e0007502.
18. Stone L, He D, Lehnstaedt S, Artzy-Randrup Y. Extraordinary curtailment of massive typhus epidemic in
the Warsaw Ghetto. Science Advances. 2020;6(30):eabc0927.
19. Zhao S, Stone L, Gao D, He D. Modelling the large-scale yellow fever outbreak in Luanda, Angola, and
the impact of vaccination. PLoS Negl Trop Dis. 2018;12(1):e0006158.
20. He D, Ionides EL, King AA. Plug-and-play inference for disease dynamics: measles in large and small
populations as a case study. J Royal Society Interface. 2010;7(43):271-83.
21. Ionides EL, Bretó C, King AA. Inference for nonlinear dynamical systems. Proceedings of the National
Academy of Sciences. 2006;103(49):18438-43.
22. USCDC. Excess Deaths Associated with COVID-19. 2021.
23. ANON. ICMR sero survey. In: Research ICoM, editor. India2021.
24. Huang S WF, Peng Z, Jin Z, et al. The epidemic in India remains on an upward trend, which may cause
total of 200 million cases in the world 2021 [updated May 2, 2021.
25. Krishnan M. Coronavirus: Is India counting all COVID deaths? 2021 [Available from:
https://www.dw.com/en/india-coronavirus-death-toll/a-57338733.
26. Ranjan R SA, K. Verma M. Characterization of the Second Wave of COVID-19 in India. MedRxiv. 2021.
You can also read