NEW ZEALAND - IMF eLibrary
←
→
Page content transcription
If your browser does not render page correctly, please read the page content below
NEW ZEALAND
 SELECTED ISSUES
April 20, 2021

 Approved By Prepared by Yosuke Kido, Siddharth Kothari, and Yu Ching
 Asia and Pacific Wong (all APD), with additional inputs from Ioana Hussiada
 Department and assistance from Nadine Dubost (both APD).

 CONTENTS
 THE UNEVEN IMPACT OF THE PANDEMIC ON NEW ZEALAND’S LABOR MARKET 3
 A. Introduction _________________________________________________________________________ 3
 B. Labor Market and Inequality Before the Pandemic ___________________________________ 3
 C. Impact of the Pandemic on New Zealand’s Labor Market ____________________________ 6
 D. Scarring Effects ______________________________________________________________________ 9
 E. Active Labor Market Policies ________________________________________________________ 10
 F. Policy Options to Address Emerging Labor Market Issues and Inequalities in New
 Zealand ________________________________________________________________________________ 12
 G. Conclusion __________________________________________________________________________ 14
 References _____________________________________________________________________________ 15

 TABLES
 1. Cross-Country Evidence: Impact of Youth Unemployment on Future Unemployment
 Rates __________________________________________________________________________________ 10
 2. Effects of Active Labor Market Policies ______________________________________________ 11
 3. Labor Market Policies and Income Support Measures Introduced After
 the Pandemic __________________________________________________________________________ 13

 ANNEXES
 I. Okun’s Law Equations________________________________________________________________ 16
 II. Additional Results on Impact of Youth Unemployment on Future Unemployment
 Rates __________________________________________________________________________________ 18

 ©International Monetary Fund. Not for Redistribution
NEW ZEALAND

THE PANDEMIC'S IMPACT ON NEW ZEALAND'S HOUSEHOLD AND NON-FINANCIAL
CORPORATE BALANCE SHEETS _____________________________________________________________ 19
A. Introduction_________________________________________________________________________________ 19
B. What Has Been the Impact on Household Balance Sheets? _________________________________ 19
C. How Vulnerable Are Non-Financial Corporations? __________________________________________ 25
D. Implications from Findings and Policy Options _____________________________________________ 30
References _____________________________________________________________________________________ 34

BOXES
1. Estimates of Corporate Debt at Risk _________________________________________________________ 29
2. Risk of Liquidity Shortages and Equity Shortfalls ____________________________________________ 31

FIGURE
1. Selected Financial Indicators for Non=Financial Corporations, 2014-19 _____________________ 33

ANNEX
I. Additional Data and Background of the Firm-Level Analysis _________________________________ 35

HOW FAST CAN NEW ZEALAND GROW AFTER THE PANDEMIC? CHALLENGES AND
OPPORTUNITIES ____________________________________________________________________________ 37
A. Introduction_________________________________________________________________________________ 37
B. Drivers of Growth in New Zealand Before the Pandemic ____________________________________ 37
C. Lessons from Previous Recessions in Advanced Economies _________________________________ 39
D. Impact of the Pandemic on New Zealand’s Medium-Term Output__________________________ 40
E. Policy Options to Address Medium-Term Fallout of the Pandemic __________________________ 42

References _____________________________________________________________________________________ 48

ANNEXES
I. Firm-Level Determinants of Business Investment ____________________________________________ 50
II. The Effect of Product Market Reforms on Business Investment _____________________________ 51

2 INTERNATIONAL MONETARY FUND

 ©International Monetary Fund. Not for Redistribution
NEW ZEALAND

THE UNEVEN IMPACT OF THE PANDEMIC ON NEW
ZEALAND’S LABOR MARKET1
While the pandemic’s impact on New Zealand’s labor market has been relatively mild by international
comparison, it has disproportionately affected the youth, female workers, and some ethnic groups. The
pandemic could thus lead to scarring and aggravate already relatively high inequality. Strong labor
market policy support, including training and hiring subsidies, is warranted to facilitate the
reallocation of workers affected by the pandemic.

A. Introduction

1. The pandemic has had an uneven impact on New Zealand’s labor market, calling for
renewed policy efforts. Despite the severe initial lockdown, a proactive policy response, especially
the large-scale job retention policy, helped cushion the impact of the pandemic on labor market
outcomes. However, the COVID-19 shock has had an uneven impact on different groups of workers,
with more severe effects on youth, female and low-skilled workers, along with some ethnic groups.
Experience from past recessions suggests that poor labor market outcomes, especially for the youth,
can have persistent effects leading to scarring. Furthermore, the larger impact on already
disadvantaged groups is likely to aggravate inequality. Therefore, strong policy support is warranted.

2. This paper analyzes the impact of the pandemic on New Zealand’s labor market and
discusses policy options. Section B discusses the pre-COVID landscape of New Zealand’s labor
market and inequality. Section C analyzes the labor market developments since the onset of the
pandemic, delving into labor market indicators of different worker groups. Section D considers the
possible scarring effects of the pandemic by drawing on cross-country labor market data. Section E
analyzes the effectiveness of labor market policies to address emerging labor market issues, utilizing
a cross-country dataset of labor market policies. Section F discusses policy options for New Zealand.
Section G concludes by distilling policy implications from the paper’s findings.

B. Labor Market and Inequality Before the Pandemic

3. Despite relatively low unemployment before the pandemic, there was significant
dispersion, with higher unemployment in some groups. Following a persistent increase after the
global financial crisis, the unemployment rate decreased gradually to 4.1 percent in 2019. However,
the youth unemployment rate was relatively high even before the pandemic, standing at
11.3 percent in 2019, similar to the OECD average, but higher than the average of major advanced
economies (G7 average: 9.4 percent). Female unemployment was higher than male unemployment
in most age groups, with a relatively large gap in the age group of 35-44.

1
 Prepared by Yosuke Kido and Siddharth Kothari (both APD). The chapter benefited from valuable comments by the
Treasury of New Zealand, the Ministry of Business, Innovation and Employment (MBIE), the Ministry of Social
Development (MSD), and participants at a virtual seminar.

 INTERNATIONAL MONETARY FUND 3

 ©International Monetary Fund. Not for Redistribution
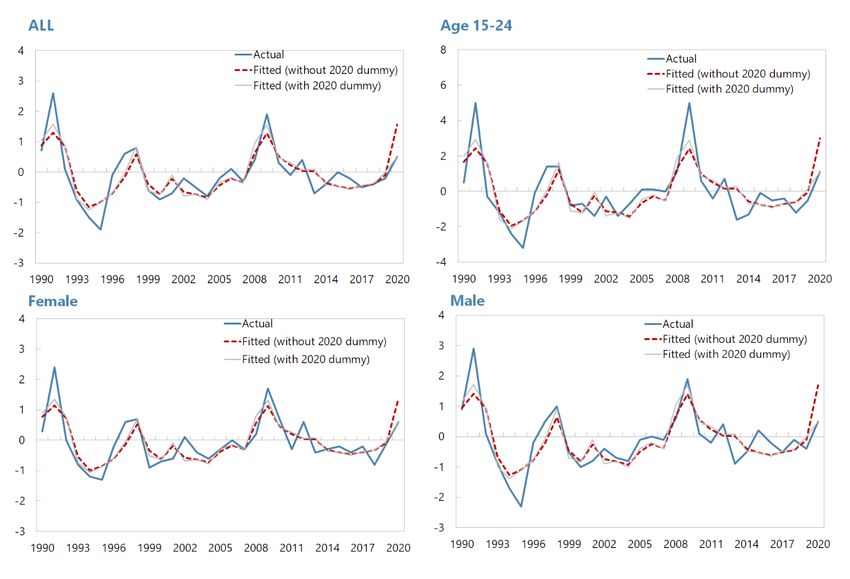
NEW ZEALAND

4. Some ethnic groups faced higher unemployment. Historically, there has been large
dispersion of labor market conditions between ethnic groups, with high unemployment rates among
Māori and Pacific people, while their labor force participation rates have been lower. Such dispersion
is observed in all age groups, suggesting that factors other than mere age distribution play a role. In
part due to the dispersion in labor market outcomes across groups, inequality in New Zealand was
relatively high compared to other advanced economies.

 Youth and Female Unemployment Rates Are Large Dispersion Among Ethnic Groups
 Higher (Unemployment rate by ethinicity, 2019, percent)
 (Unemployment rate by age and gender, 2019,
 percent)
 14 9

 Total 8
 12
 Female
 7
 10
 6

 8 5

 4
 6
 3
 4
 2

 2 1

 0
 0
 European Māori Pacific People Asian
 Total 15-24 25-34 35-44 45-54 55-64

 Sources: Stats NZ and IMF staff calculations. Sources: Stats NZ and IMF staff calculations.

 Gaps Among Ethnic Groups Are Observed in All Inequality in New Zealand Was Relatively High
 Age Groups Before the Pandemic
 (Unemployment rate by age and ethinicity, 2019, (Gini coefficient, latest, 2017-19)
 percent)
 18 0.5

 16 European
 0.4
 14 Māori
 Pacific People
 12 0.3
 Asian
 10

 8 0.2

 6
 0.1
 4

 2 0
 Japan
 Denmark
 Norway

 Finland
 Sweden

 Germany
 Ireland

 France
 Canada
 Estonia
 OECD median

 Italy

 Latvia
 Lithuania
 Slovak Republic

 Slovenia
 Iceland
 Belgium

 Austria
 Poland

 Spain

 Korea

 United States

 Chile
 Czech Republic

 Hungary
 Portugal
 Luxembourg
 Australia

 Israel

 United Kingdom

 Mexico
 Netherlands

 Switzerland

 Greece

 New Zealand

 Turkey

 0
 15-24 25-34 35-44 45-54 55-64

 Sources: Stats NZ and IMF staff calculations. Sources: OECD and IMF staff calculations.

5. In previous recessions, young workers and low-skilled workers were affected more
strongly. Output fluctuations affect unemployment differently across worker groups. Estimates of
Okun’s law, the relationship between changes in unemployment and output growth, suggest that
the unemployment rate among youth in New Zealand is more sensitive to economic cycles than that

4 INTERNATIONAL MONETARY FUND

 ©International Monetary Fund. Not for Redistribution
NEW ZEALAND

among other age groups, with the sensitivity nearly twice as large as the average of all age groups.
Similarly, low-skilled workers are also more prone to lose their jobs during economic downturns.
Employment of female workers, on average, tended to be less sensitive to macroeconomic
conditions in previous business cycles, as they have higher representation in typically less procyclical
service sectors. 2

 Youth Unemployment Tends to Increase More Young Workers Are More Sensitive to
 Sharply During Downturns Economic Cycles
 (Unemployment rates by age group, percent) (Okun’s law coefficient)
 30 0
 15 to 24
 -0.1
 25 to 34
 25 35 to 44 -0.2
 45 to 54
 -0.3
 55 to 64
 20 *** ***
 -0.4 ***

 ***
 -0.5 ***
 15
 -0.6

 -0.7
 10
 -0.8 ***

 -0.9
 5
 ALL Age 15-24 Age 25-34 Age 35-44 Age 45-54 Age 55-64

 0
 1986 1989 1992 1995 1998 2001 2004 2007 2010 2013 2016 2019

 Sources: Stats NZ and IMF staff calculations. Source: IMF staff calculations.
 Note: Shaded area indicates New Zealand recessions Note: Bars show the senstivity of the unemployment
 defined by Hall (2014). rate to GDP growth. See Appendix I for methodology.
 *** denotes significance at the 1 percent level.

 Low-Skilled Workers Tend to be Affected by Female Employment Tended to be Less
 Economic Fluctuations Procyclical in Previous Business Cycles
 (Okun’s law coefficient) (Okun’s law coefficient)
 0 0

 -0.1 -0.1
 ***

 -0.2 -0.2

 -0.3
 -0.3
 -0.4
 -0.4
 ***
 ***

 -0.5
 ***
 -0.5 ***
 -0.6

 -0.7 -0.6
 Lower Second. Edu. Upper Second. Edu. Tertiary Female Male

 Source: IMF staff calculations Source: IMF staff calculations.
 Note: Bars show the senstivity of the unemployment Note: Bars show the senstivity of the unemployment
 rate to GDP growth. See Annex I for methodology. rate to GDP growth. See Annex I for methodology.
 *** denotes significance at the 1 percent level. *** denotes significance at the 1 percent level.

2
 Similar difference by gender is also observed in other countries (Zanin 2014).

 INTERNATIONAL MONETARY FUND 5

 ©International Monetary Fund. Not for Redistribution
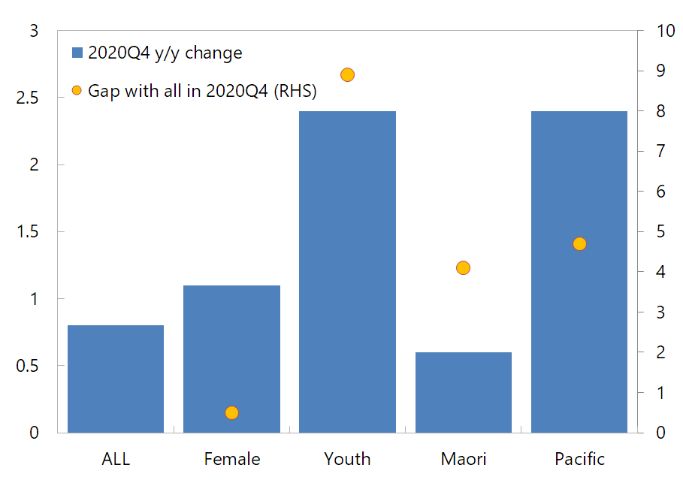
NEW ZEALAND

C. Impact of the Pandemic on New Zealand’s Labor Market

6. The pandemic’s labor market impact has been relatively contained. New Zealand
introduced a strict lockdown and border closure in March 2020. Hours worked declined by close to
9 percent in 2020Q2 before recovering in Q3. To alleviate the impact of the pandemic and the
containment measures, the government introduced a wage subsidy scheme covering more than
60 percent of workers, the widest coverage among such schemes in the world. 3 As a result, the
impact on labor market aggregates has been relatively small so far. The aggregate unemployment
rate increased modestly to 4.9 percent in 2020Q4 from 4.1 percent in 2019Q4, while the
underutilization rate increased more sharply from 10.1 percent in 2019Q4 to 11.9 percent in 2020Q4.

 New Zealand Introduced a Large Job Labor Market Conditions Have Deteriorated
 Retention Program During the Pandemic Somewhat Since the Onset of the Pandemic
 (Workers receiving job retention benefits, (Unemployment rate and underutilization rate,
 percent) percent)
 70 8 18

 60
 7 16
 50
 6 14
 40

 30
 5 12

 20
 4 10
 10
 Unemployment rate

 0 3 8
 Underutilization rate (rhs)
 UK

 Germany
 Austria

 Denmark
 Australia

 Czech

 Spain

 Canada

 Sweden

 Norway
 New Zealand

 France

 Finland
 Netherland

 Ireland

 2 6
 2006 2008 2010 2012 2014 2016 2018 2020

 Source: OECD. Source: Stats NZ.

7. Job losses have been concentrated in contact-dependent service sectors. Labor market
adjustment has been uneven across sectors, and job losses have been concentrated in some service
sectors dependent on tourism, such as accommodation, food services, and recreational services. The
adjustment is different from previous recessions, where manufacturing and constructions were
affected more severely.

8. The impact of the pandemic has been uneven, with a more severe impact on youth,
female, and low-skilled workers. 4 Youth employment has seen the largest adjustment, with a
2.4 percentage point y/y increase in the unemployment rate. Furthermore, as job losses have been
concentrated in contact-intensive service sectors, this has resulted in a larger increase in female
unemployment and underutilization. By ethnicity, as pointed out in the Budget Policy Statement

3
 See OECD (2020) for detail of other countries’ schemes and IMF Policy Tracker (https://www.imf.org/en/Topics/imf-
and-covid19/Policy-Responses-to-COVID-19) for fiscal costs of these responses. Wage subsidies in New Zealand
expired in October 2020, and subsidies are expected to be re-instated contingent on COVID-19 resurgence.
4 Similar uneven effects of the pandemic are observed in many other economies. See IMF (2020) and references
therein for detail.

6 INTERNATIONAL MONETARY FUND

 ©International Monetary Fund. Not for Redistribution
NEW ZEALAND

2021, Māori and Pacific people have been more affected than other ethnic groups. 5 Workers with
lower levels of education also appear to be more severely impacted compared with those with
higher levels of education.

 Job Losses are Concentrated in Some Service Labor Market Adjustment Has Been Uneven
 Sectors Among Worker Groups
 (Employment by industry, y/y percent change, in (Unemployment rate, percent)
 Dec. 2020)
 8
 20
 6 ALL Female
 18
 4 Youth Māori
 16
 2 Pacific
 14
 0
 12
 -2
 10
 -4
 8
 -6
 6
 -8
 4
 -10
 2
 Wholesale
 Agri.

 Mining
 Communications

 Transport
 Education
 Health

 Other Services

 Professional Services
 Public Admin
 Finance

 Retail

 Hotels, Restaurants
 Property Services
 Construction

 Manufacturing
 Utilities

 Admin Services
 Recretional Services

 0
 2008 2010 2012 2014 2016 2018 2020

 Sources: Stats NZ and IMF staff calculations. Source: Stats NZ.
 Note: Employment growth rates caluclated from tax Note: Unemployment rates for all workers and female
 data released by Stats NZ. workers are seasonality adjusted.
 Some Worker Groups Have Been Affected The Gender Gap Has Widened
 More Severely (Female minus male, ppts)
 (Unemployment rate, percentage points)

 Sources: Stats NZ and IMF staff calculations. Sources: Stats NZ and IMF staff calculations.

5
 Based on the analysis by New Zealand Treasury, Budget Policy Statement 2021 pointed out that Māori and Pacific
workers were more likely to have dropped into a low-income bracket (of between NZ$200 and NZ$300 per week)
from March to August 2020. Māori indicators in Household Labour Force Survey have been volatile. The employment
rate declined sharply in 2020Q3 but recovered in 2020Q4. A gap with overall workers remains high. The
unemployment rate of Asian workers has increased more sharply than the aggregate after the pandemic, although it
remains well below unemployment rates of Māori and Pacific people.

 INTERNATIONAL MONETARY FUND 7

 ©International Monetary Fund. Not for Redistribution
NEW ZEALAND

9. The wage subsidy program has played an important role in cushioning the labor
market impact of the crisis. International comparison suggests that countries with larger coverage
of job retention programs tended to have more benign labor market outcomes compared to
predictions based on Okun’s law, the
 Job Retention Programs Tended to Cushion the Labor
historical relationship between output
 Market Impact
and the unemployment rate (see (International comparison, 2020)
Annex I for details). 6 In New Zealand, Deviation of unemployment rates from Okun's law in 2020 (%pts)
 3
especially the youth unemployment
 USA
rate increased by less than predicted 2

based on historical Okun’s law 1 NOR
 CAN

estimates, suggesting that wage 0
subsidies (and the broader policy
 DEU
 FIN SWE
 -1
response) were particularly effective in DNK NLD AUT
 AUS
 -2
cushioning the impact on young NZL
 GBR
workers. Furthermore, while helpful for -3
 FRA
 PRT ITA
female workers, male workers tended to -4
benefit more. These observations are 0 20 40 60 80

consistent with the Ministry of Social Workers recieving job retention benefits (%)

Development (MSD) administrative Sources: OECD and IMF staff estimates
 Note: See Annex I for methodology.
data, which shows that the proportion
of young workers and male workers that received wage subsidies was higher than that of other
groups.

 Wage Subsidies Helped Young Workers More Male Workers Benefited More From Wage
 (Deviation of unemployment rates from Okun’s Subsidies
 law in New Zealand in 2020, percentage points) (Deviation of unemployment rates from Okun’s
 law in New Zealand in 2020, percentage points)
 0
 0
 -0.2
 -0.5
 -0.4

 -1 -0.6
 ***
 -0.8
 -1.5
 **
 -1
 -2 **
 -1.2 **

 -1.4
 -2.5
 -1.6
 -3 **
 -1.8
 **

 -3.5 -2
 ALL Age 15-24 Age 25-34 Age 35-44 Age 45-54 Age 55-64 Female Male

 Source: IMF staff calculations Source: IMF staff calculations
 Notes: ** and *** denote significance at the 5 and 1 Notes: ** and *** denote significance at the 5 and 1
 percent levels, respectively. See Annex I for percent levels, respectively. See Annex I for
 methodology. methodology.

6
 For the international comparison, in addition to the coverage of job retention schemes, the duration of the schemes
may affect the impact of the job retention policies as well.

8 INTERNATIONAL MONETARY FUND

 ©International Monetary Fund. Not for Redistribution
NEW ZEALAND

D. Scarring Effects

10. Although the economy has embarked on a quick recovery, concerns about the
potential for labor-market scarring remain. Labor market conditions at the time when people
graduate from school can have significant effects on medium-term outcomes (see Cockx, 2016, for
an overview). As youth unemployment has seen a significant spike following the COVID-19 shock,
this raises the possibility that unemployment rates may remain high for an extended period for the
cohort that is entering the labor market at this time.

11. In this section, cross-country data is used to conduct cohort analysis to assess the
possible magnitude of scarring in the labor market. The empirical framework is that of
Kawaguchi and Murao (2014), which assesses the extent to which higher unemployment rates faced
by a cohort in their youth translates into higher unemployment rates for the same cohort in later
years. The regression equation takes the form:

 = α + ∗ ℎ, ∗ + ∗ + +

Where is the unemployment rate of cohort ‘c’ in country ‘i’ at time ‘t’, ℎ, is the
unemployment rate faced by the cohort in their youth (15 to 24 years of age), and is a
vector of dummies which takes value 1 for ages corresponding to the groups 25–29, 30–34, 35–39,
and 40–44. The vector of coefficients indicates the extent to which higher youth unemployment
for a cohort translates into higher unemployment at different ages in the future. controls for
country-year shocks which impact all cohort/age groups equally (e.g. a recession which pushes up
unemployment rate for all cohorts in a country) and standard errors are clustered at the country
level. Unemployment rates by age group (five-year intervals) from the OECD for 30 countries from
the period 1960 to 2019 are used to construct the dataset at the country-cohort-year level.

12. The results confirm that high youth unemployment can have persistent effects. A
cohort which experiences a 1 percentage point higher unemployment rate during its youth also
suffers from about a 0.2 percentage point higher unemployment rate when they are 25 to 29 years
of age, and about 0.05 percentage point higher (+0.208-0.150) unemployment rate when they are
30 to 34 years of age. Beyond age 35, the effect of youth unemployment becomes insignificant.

13. The extent of scarring is larger for women and for countries with less flexible labor
markets. Columns 2 and 3 of Table 1 repeat the regression for males and females separately. High
youth unemployment translates to unemployment rates at 25 to 29 years of age being
0.21 percentage point higher for women, slightly more than the estimated 0.19 percentage point for
men. Importantly, while women continue to have higher unemployment at age 30 to 34, the effect
becomes insignificant for men at this age. Finally, column 4 adds an interaction term with a country-
level measure of employment protection restrictions to the regression, which Kawaguchi and Murao
(2014) used as a proxy for flexibility of labor markets. As expected, persistent effects of youth
unemployment are larger for countries with more restrictive employment protections. This indicates
that countries with more flexible labor markets are likely to experience less scarring from high youth

 INTERNATIONAL MONETARY FUND 9

 ©International Monetary Fund. Not for Redistribution
NEW ZEALAND

unemployment. 7 Conditional on the level of New Zealand’s (relatively mild) employment
protections, the average increase of New Zealand’s youth unemployment rate in previous recessions
(8-9 percentage points) translates to about a 0.4-0.5 percentage point higher unemployment rate at
ages 25 to 29, compared to an impact of about 2.5 percentage points in a country with the average
level of employment protections.

 Table 1. New Zealand: Cross-Country Evidence: Impact of Youth Unemployment on
 Future Unemployment Rates
 (1) (2) (3) (4)
 VARIABLES All Male Female EPL Interaction

 Youth unemployment 0.208*** 0.185*** 0.212*** 0.132***
 (0.0414) (0.0463) (0.0319) (0.0381)
 Reference age group: 25 to 29
 Youth unemployment*Age dummy for 30 to 34 -0.150*** -0.143*** -0.142*** -0.106***
 (0.0295) (0.0299) (0.0255) (0.0174)
 Youth unemployment*Age dummy for 35 to 39 -0.212*** -0.197*** -0.199*** -0.139***
 (0.0455) (0.0467) (0.0401) (0.0245)
 Youth unemployment*Age dummy for 40 to 44 -0.246*** -0.227*** -0.229*** -0.160***
 (0.0550) (0.0547) (0.0509) (0.0273)

 Youth unemployment*EPL 0.156**
 (0.0597)
 Reference age group: 25 to 29
 Youth unemployment*EPL*Age dummy for 30 to 34 -0.120**
 (0.0465)
 Youth unemployment*EPL*Age dummy for 35 to 39 -0.208***
 (0.0632)
 Youth unemployment*EPL*Age dummy for 40 to 44 -0.257***
 (0.0693)
 Constant 6.139*** 6.181*** 6.501*** 7.152***
 (0.587) (0.633) (0.476) (0.587)

 Observations 14,379 14,379 14,379 14,379
 R-squared 0.961 0.945 0.967 0.968
 Notes: Data on unemployment rate at the country-cohort-age level from OECD. EPL stands for Employment Protection
 Legislation Index also sourced from OECD. Sample consists of 30 countries from 1960 to 2019.

E. Active Labor Market Policies

14. The literature generally points to the effectiveness of active labor market policies in
fostering employability. At the aggregate level, with OECD cross-country samples, Bassanini and
Duval (2006) find that some types of active labor market policies, such as training, are associated
with lower unemployment. With samples from selected advanced economies, Estevao (2003, 2007)
finds positive effects of active labor market policies on the employment rate of the business sector.
Micro-level evidence often finds heterogenous effects among different groups of workers,
suggesting that the design, targeting, and implementation of a policy are paramount in ensuring its

7
 Results are qualitatively similar if we look at the impact on employment rates instead of unemployment rates. In
particular, lower youth employment rates are associated with lower employment rates at older ages, with the effect
being somewhat larger for women (see Annex II, Table 1).

10 INTERNATIONAL MONETARY FUND

 ©International Monetary Fund. Not for Redistribution
NEW ZEALAND

effectiveness. With a meta-analysis of over 200 micro-level studies of active labor market policies in
advanced and emerging economies, Card and others (2018) find that active labor market policies,
such as training and private sector employment subsidy programs, have been generally effective,
especially in the medium- to long-term, and their effects tend to increase in recessions. Direct job
creation is often found to be less effective compared to training and hiring subsidies (Kleuv 2010).

15. In this section, a cross-country dataset of active labor market policies is used to
analyze the effectiveness of active labor market policies. The effectiveness of active labor market
policies in improving labor market conditions can be quantified by examining the experience of
different advanced economies that have had a variety of labor market policies over multiple years.
This section uses cross-country panel data of OECD countries, which includes labor market
indicators and key policy variables. The empirical framework is based on the standard Okun’s law
model, augmented with active labor market policies. The regression equation takes the form

 , = + + � , , −1 + 1 ∗ ln� , � + 2 ∗ ln� , −1 � + ,
 =1

where , denotes a change in the unemployment rate of country i at time t, and ,j,
denotes a change in the spending in percent of GDP on active labor market policy j. In this exercise,
we include three types of active labor market policies: training; employment incentives (e.g.
recruitment incentives and employment maintenance incentives); and other policies, which include
direct job creation, start-up incentives, and rehabilitation. 8 In the regression, the average of previous
two years is used as active labor market policies typically impact outcomes with lags (e.g. Card and
others 2018). ln� , � denotes GDP growth rate. The panel dataset covers OECD economies
from 1994 to 2019. We run this regression for the overall, female, and youth unemployment rates.

 Table 2. New Zealand: Effects of Active Labor Market Policies
 ALL Female Young

 Training (lagged) -0.68 -0.65 -3.61*
 (0.86) (1) (2.07)
 Employment Incentives (lagged) -2.59** -3.02* -5.03**
 (0.99) (1.71) (2.1)
 Other ALMP (lagged) 0.47 -0.21 -0.16
 (1.16) (1.32) (2.46)
 GDP growth -0.22*** -0.19*** -0.42***
 (0.04) (0.04) (0.11)
 GDP growth (lagged) -0.11*** -0.11*** -0.22***
 (0.02) (0.02) (0.03)
 Country FE Y Y Y
 Time FE Y Y Y
 Observations 545 545 545
 Sample Period 1994-2019 1994-2019 1994-2019

 Source: IMF staff estimates.
 Notes: The depandent variable is a change in unemployment rate. Clustered robust standard
 errors are estimated.

8
 Spending on public employment services (e.g. cost of running unemployment insurance offices) is excluded from
this exercise to alleviate endogeneity concerns.

 INTERNATIONAL MONETARY FUND 11

 ©International Monetary Fund. Not for Redistribution
NEW ZEALAND

16. The cross-country estimation results generally support the effectiveness of active
labor market policies. Estimation results show that employment incentives are particularly effective
for the overall population. 9 Subgroup analysis suggests that training programs are particularly
effective for young people, which tend to have weaker occupational skills, suggesting that
appropriate targeting is essential to improve the effectiveness of labor market policies. Employment
incentives tend to be more effective for female workers. Other active labor market policies, such as
direct job creation, are not found to be effective for all types of workers. 10

17. The design and targeting of schemes matter to maximize the effectiveness of active
labor market policies. Micro-level evidence often suggests that training is particularly effective for
low-skilled workers and for reducing long-term unemployment (e.g. Card and others, 2018). Some
literature argues that specific skill training tends to have larger effects compared to general training
(e.g. Greenberg and others, 2003 and Jacobson et al, 2005) and that training can be particularly
effective when combined with job search assistance (Dorsett 2006). Hiring subsidies would have a
larger impact on employment if targeted at small firms, low-wage workers, and jobs with rigid
wages, and would be more cost-effective if they are used temporarily during recessions (Cahuc,
2019).

F. Policy Options to Address Emerging Labor Market Issues and Inequalities
in New Zealand

18. New Zealand can further increase its spending to address emerging labor market
issues and growing inequalities. Spending on active labor market policies in New Zealand has
been relatively low and was on a declining trend before the pandemic. 11 Public spending on active
labor market policies has been reduced to 0.2 percent of GDP in 2017 from 0.5 percent in 2004, with
a marked decline in spending on training (Welfare Expert Advisory Group, 2018). Like in some other
advanced economies, active labor market policies were not deployed actively during the global
financial crisis. Since the onset of the pandemic, New Zealand has expanded active labor market
policies, including direct job creation, hiring subsidies, and free access to training (see Table 3), in
addition to the large-scale wage subsidy scheme that was central in supporting workers affected by
the pandemic. Going forward, more can be done in some areas to foster employability and promote
human capital accumulation.

9
 Using a meta analysis of European labor markets, Kluve (2010) finds that private sector incentive schemes, such as
hiring subsidies, tend to have a larger impact on employment compared to training.
10
 Results are robust to adding a lagged change in the spending on passive labor market policies.
11
 It should be noted that gap with other countries will be smaller after the size of unemployment is controlled for.
The data (Public expenditure and participation stock on LMP, obtained from OECD.stat) do not include broader
support measures, such as education spending and childcare.

12 INTERNATIONAL MONETARY FUND

 ©International Monetary Fund. Not for Redistribution
NEW ZEALAND

 Table 3. New Zealand: Labor Market Policies and Income Support
 Measures Introduced After the Pandemic
 • Wage subsidies (NZ$ 14.8 bn)
 • Permanent increase in social benefits (NZ$ 2.4 bn)
 • COVID-19 leave and self-isolation support (NZ$ 0.1 bn)
 • Income Relief Payment (NZ$ 0.6 bn)
 • Increase in Winter Energy Payment (NZ$ 0.5 bn)
 • Job creation in environmental projects (NZ$ 1.1 bn)
 • Targeted Training and Apprenticeship Fund (NZ$ 0.3 bn)
 • MSD capacity expansion (NZ$ 0.4 bn)
 • Expansion of Flexi-Wage Subsidies (NZ$ 0.3 bn)
 • He Poutama Rangatahi – youth employment support (NZ$ 0.1 bn)
 Source: New Zealand authorities.

19. New Zealand can step up support for displaced workers and alleviate skill mismatches
in the labor market. In New Zealand, training schemes cover only a limited part of the labor force. 12
The coverage of training programs can be expanded to support broader workers in transition, in
particular low-skilled workers and long-term unemployed individuals. Training programs should also
be upgraded to reflect needs from industry, and the ongoing Reform of Vocational Education
(RoVE) is a step in the right direction and should enhance effectiveness of training programs. The
recent expansion of Flexi-Wage subsidies (hiring subsidies) is a welcome development, and support
targeted at displaced low-wage workers can be scaled up if long-term unemployment persists.
Strong job search assistance would also facilitate reallocation of workers at relatively low fiscal costs.
In addition to scaling up policies, it will also be important to review and reinforce the quality of
interventions. While training and hiring subsidies are assessed to be effective, other programs may
have some room for improvement (MSD 2019). More generally, as the employment likelihood
decreases with duration of the unemployment spell, early activation is crucial to limit scarring in the
labor market and promote long-term human capital accumulation.

20. Policies should also address inequality and the gender gap. There are large disparities in
education achievement in New Zealand, with Māori and Pacific People’s education achievement
remaining below the rest of the population. Targeted education support for these groups would
promote human capital accumulation and reduce inequality in the longer run. Expanding childcare
support would promote labor force participation of female workers and would help close the gender
gap, which has deteriorated after the pandemic.

12
 Training programs in New Zealand are narrowly targeted to those who are receiving benefits (e.g. Jobseeker
Support).

 INTERNATIONAL MONETARY FUND 13

 ©International Monetary Fund. Not for Redistribution
NEW ZEALAND

 There Is Scope for Scaling Up ALMP Spending Coverage of Training Programs is Limited
 (Spending on active labor market policies, percent (Participants of training programs, percentage of
 of GDP, average of 2010-18) labor force, as of 2017)
 2.5
 3

 2 2.5

 1.5 2

 1.5
 1

 1
 0.5

 0.5
 0
 Canada

 United Kingdom

 Belgium
 Slovak Republic

 New Zealand

 Austria

 France
 Israel
 Japan

 Latvia
 Australia

 Czech Republic

 Portugal
 Poland

 Spain
 Ireland
 Germany

 Hungary
 Netherlands

 Finland

 Denmark
 Estonia

 Slovenia
 Korea

 Sweden
 Mexico
 United States
 Chile

 Italy

 Norway
 OECD countries
 Switzerland
 Luxembourg

 0

 Norway

 Portugal
 Australia

 New Zealand

 Luxembourg

 Germany

 Netherlands
 Hungary

 Canada

 Italy

 Austria
 Switzerland

 Ireland

 Denmark
 France

 Belgium

 Finland
 Slovak Republic

 Sweden

 Spain
 Source: OECD Source: OECD

G. Conclusion

21. The pandemic has had a relatively mild yet uneven impact on New Zealand’s labor
market, aggravating pre-existing disparities in labor market outcomes. Even before the
COVID-19 shock, unemployment was significantly higher among the youth, women, low-skilled
workers, and particular ethnic groups (Māori and Pacific peoples). The large-scale wage subsidy
program has mitigated the impact of the crisis on labor market outcomes. However, the groups with
worse outcomes before the crisis have generally also suffered relatively more during the pandemic,
especially youth who have seen the largest drop in employment.

22. The relatively large impact of the crisis on youth and women raises concerns about the
potential for labor market scarring. Our cross-country estimates based on cohort analysis suggest
that a 1 percentage point increase in youth (between 15 and 24 years of age) unemployment is
associated with a 0.2 percentage point higher unemployment rate between the ages of 25 and 29.
Furthermore, the scarring effects are larger and more persistent for women.

23. Continued macroeconomic policy support and active labor market policies can help
mitigate the distributional effects of the crisis and reduce scarring. Active labor market policies,
such as training, especially for young workers, and hiring subsidies would facilitate reallocation of
workers affected by the pandemic, thereby limiting the scarring. Spending on active labor market
policies in New Zealand has been relatively low, suggesting that there is scope for scaling up policy
support. New Zealand can upgrade training programs and expand their coverage to broader
workers, including low-skilled people. Hiring subsidies targeted to low-wage workers would foster
employability in New Zealand. Strong policy actions would also promote long-term human capital
accumulation and reduce growing inequality.

14 INTERNATIONAL MONETARY FUND

 ©International Monetary Fund. Not for Redistribution
NEW ZEALAND

 References
Bassanini, A. and Duval, R. (2006). “Employment Patterns in OECD Countries: Reassessing the Role of
 Policies and Institutions.“ OECD Economics Department Working Papers No. 486. OECD
 Publishing (NJ1).

Card, D., Kluve, J., and Weber, A. (2018). “What Works? A Meta Analysis of Recent Active Labor
 Market Program Evaluations.“ Journal of the European Economic Association, 16(3), 894-931.

Cahuc, P., Carcillo, S., and Le Barbanchon, T. (2019). “The Effectiveness of Hiring Credits.“ The Review
 of Economic Studies, 86(2), 593-626.

Dorsett, R. (2006). “The New Deal for Young People: Effect on The Labour Market Status of Young
 Men. “Labour economics, 13(3), 405-422.

Estevão, M. (2003). “Do Active Labor Market Policies Increase Employment?“ IMF Working Paper
 WP/03/234.

Estevão, M. (2007). “Labor Policies to Raise Employment.“ IMF Staff Papers, 54(1), 113-138.

Greenberg, D. H., Michalopoulos, C., and Robins, P. K. (2003). “A Meta-analysis of Government-
 sponsored Training Programs.“ ILR Review, 57(1), 31-53.

International Monetary Fund (2020). “The Great Lockdown: Dissecting The Economic Effects.“ World
Economic Outlook, October 2020.

Jacobson, L., LaLonde, R., and Sullivan, D. G. (2005). “Estimating the Returns to Community College
 Schooling for Displaced Workers.“ Journal of Econometrics, 125(1-2), 271-304.

Kawaguchi, D. and Murao, T. (2014). “Labor‐Market Institutions and Long‐Term Effects of Youth
 Unemployment.” Journal of Money, Credit and Banking, 46(S2), 95-116.

Kluve, J. (2010). “The Effectiveness of European Active Labor Market Programs.“ Labour
 Economics, 17(6), 904-918.

Ministry of Social Development. (2019). “Cost-effectiveness of MSD Employment Assistance.“

OECD (2020), “Worker Security and the COVID-19 Crisis.” OECD Employment Outlook 2020

Welfare Expert Advisory Group. (2018). “Employment and Labor Market -Active Labour Market
 Policies in the New Zealand Context.“

Zanin, L. (2014). “On Okun’s Law in OECD Countries: An Analysis By Age Cohorts.“ Economics
 Letters, 125(2), 243-248

 INTERNATIONAL MONETARY FUND 15

 ©International Monetary Fund. Not for Redistribution
NEW ZEALAND

 Annex I. Okun’s Law Equations
Okun’s law regressions are estimated to analyze the sensitivity of the unemployment rates of
different worker groups to macroeconomic conditions. Specifically, the following regression is
estimated:
 = α + 1 ∗ ln( ) + 2 ∗ ln( −1 ) + γ ∗ 2020 + ,

where denotes a change in the unemployment rate at time t of different groups, ln( )
denotes GDP growth rate, and 2020 denotes a dummy variable that takes 1 in 2020, which is
included to control for policy effects, including wage subsidies. 1 Parameters are estimated at the
annual frequency. For comparison, regression without the dummy variable is also estimated.
Tables I.1 and I.2 report estimated parameters for different worker groups in New Zealand and
Table I.3 shows the international comparison.
The charts in Section B report estimated sensitivities of the unemployment rate to GDP growth
( 1 + 2 ) from these tables. Section C reports the estimated coefficients of the dummy variable (γ) for
different worker groups, as well as the international comparison. This coefficient reflects the extent
to which unemployment in 2020 deviated from the historical relation between output and
unemployment, capturing the impact of the policy response, especially job retention schemes, in
cushioning the labor market impact of the pandemic. Figure I.1 shows actual and predicted values of
the unemployment rate for selected worker groups.

 Table I.1. New Zealand: Okun’s Law Equations by Age Groups
 ALL Age 15-24 Age 25-34 Age 35-44 Age 45-44 Age 54-64 ALL Age 15-24 Age 25-34 Age 35-44 Age 45-44 Age 54-64

 GDP growth -0.377*** -0.7*** -0.419*** -0.279*** -0.227*** -0.215*** -0.288*** -0.538*** -0.317*** -0.212*** -0.184*** -0.157***
 (0.058) (0.134) (0.083) (0.036) (0.048) (0.063) (0.053) (0.118) (0.073) (0.035) (0.04) (0.053)
 GDP growth (lagged) -0.052 -0.066 -0.049 -0.07* -0.07 -0.088 -0.098 -0.15 -0.102 -0.104** -0.092* -0.118*
 (0.057) (0.13) (0.08) (0.035) (0.046) (0.061) (0.06) (0.132) (0.082) (0.039) (0.045) (0.06)
 Dummy_2020 -1.591** -2.882** -1.823** -1.187*** -0.772 -1.024 - - - - - -
 (0.583) (1.341) (0.828) (0.361) (0.476) (0.628) - - - - - -
 Constant 1.072*** 2.017*** 1.17*** 0.909*** 0.75*** 0.784*** 0.915*** 1.734*** 0.99*** 0.792*** 0.674*** 0.683***
 (0.17) (0.39) (0.241) (0.105) (0.139) (0.183) (0.177) (0.39) (0.242) (0.115) (0.134) (0.177)
 Adj R-squared 0.70 0.59 0.58 0.80 0.62 0.46 0.64 0.54 0.52 0.73 0.59 0.43
 Sample Period 1990-2020 1990-2020 1990-2020 1990-2020 1990-2020 1990-2020 1990-2020 1990-2020 1990-2020 1990-2020 1990-2020 1990-2020

 Source: IMF staff estimates.

 Table I.2. New Zealand: Okun’s Law Equations by Gender and Education Groups
 Female Male Female Male Lower Second. Upper Second. Tertiary

 GDP growth -0.319*** -0.417*** -0.254*** -0.315*** -0.5*** -0.344*** -0.138***
 (0.056) (0.067) (0.049) (0.061) (0.079) (0.073) (0.049)
 GDP growth (lagged) -0.048 -0.055 -0.082 -0.108 0.0004 -0.058 0.024
 (0.055) (0.065) (0.055) (0.069) (0.076) (0.07) (0.047)
 Dummy_2020 -1.172** -1.804** - - - - -
 (0.565) (0.674) - - - - -
 Constant 0.918*** 1.172*** 0.802*** 0.994*** 1.301*** 1.07*** 0.249
 (0.164) (0.196) (0.164) (0.204) (0.24) (0.221) (0.148)
 Adj R-squared 0.65 0.68 0.61 0.61 0.66 0.57 0.21
 Sample Period 1990-2020 1990-2020 1990-2020 1990-2020 1991-2019 1991-2019 1991-2019

 Source: IMF staff estimates.

1
 Of course, to the extent that the policy response also mitigated the decline in GDP, the overall effect of policies on
the unemployment rate is likely larger. It should also be noted that the dummy variable may capture other factors,
including structural changes and possible measurement errors during the lockdown.
16 INTERNATIONAL MONETARY FUND

 ©International Monetary Fund. Not for Redistribution
NEW ZEALAND

 Table I.3. New Zealand: Okun’s Law Equations for Selected Advanced Economies

 NZL AUT AUS CAN DEU DNK FIN FRA GBR ITA NLD NOR PRT SWE USA

GDP growth -0.377*** -0.203*** -0.425*** -0.36*** -0.196*** -0.335*** -0.257*** -0.252*** -0.306*** -0.223*** -0.216*** -0.13* -0.413*** -0.318*** -0.41***
 (0.058) (0.051) (0.075) (0.039) (0.067) (0.048) (0.056) (0.059) (0.055) (0.063) (0.066) (0.069) (0.115) (0.05) (0.084)
GDP growth (lagged) -0.052 -0.006 -0.212*** -0.058 -0.055 -0.122** -0.221*** -0.119** -0.097* -0.137** -0.166** -0.055 -0.013 -0.208*** -0.089
 (0.057) (0.051) (0.073) (0.039) (0.061) (0.049) (0.055) (0.055) (0.055) (0.061) (0.065) (0.069) (0.114) (0.05) (0.083)
Dummy_2020 -1.591** -0.965 -1.143* 1.115** -0.223 -0.661 -0.278 -3.028*** -3.006*** -3.117*** -0.85 0.402 -3.248** -0.413 1.995**
 (0.583) (0.589) (0.607) (0.457) (0.814) (0.519) (0.97) (0.726) (0.805) (0.855) (0.679) (0.503) (1.525) (0.658) (0.807)
Constant 1.072*** 0.371** 1.86*** 0.857*** 0.261 0.676*** 0.927*** 0.597*** 0.673*** 0.282** 0.703*** 0.376** 0.5* 1.282*** 1.166***
 (0.17) (0.14) (0.27) (0.115) (0.181) (0.135) (0.196) (0.132) (0.14) (0.119) (0.173) (0.166) (0.249) (0.172) (0.252)
Adj R-squared 0.70 0.44 0.68 0.89 0.25 0.72 0.67 0.54 0.64 0.45 0.51 0.25 0.44 0.71 0.73

Sample Period 1990-2020 1997-2020 1988-2020 1990-2020 1992-2020 1993-2020 1989-2020 1990-2020 1990-2020 1990-2020 1990-2020 1990-2020 1997-2020 1990-2020 1990-2020

 Source: IMF staff estimates.

 Figure I.1. Actual and Fitted Unemployment Rates (Changes in Unemployment Rates, ppts)

 Note: Fitted values are based on Okun’s law equations reported in Appendix Table 1 and 2 (with and without 2020 dummies).
 Sources: IMF staff estimates.

 INTERNATIONAL MONETARY FUND 17

 ©International Monetary Fund. Not for Redistribution
NEW ZEALAND

 Annex II. Additional Results on Impact of Youth Unemployment
 on Future Unemployment Rates

 Table II.1. New Zealand: Impact of Youth Employment on Future Employment Rates
 (1) (2) (3) (4)
 VARIABLES All Male Female EPL Interaction

 Youth employment rate 0.170** 0.169*** 0.195* 0.0927
 (0.0705) (0.0513) (0.111) (0.0820)
 Reference age group: 25 to 29
 Youth employment*Age dummy for 30 to 34 -0.0920** -0.142*** -0.0614 -0.0556
 (0.0398) (0.0491) (0.0444) (0.0350)
 Youth employment*Age dummy for 35 to 39 -0.133** -0.191*** -0.0872 -0.0868*
 (0.0519) (0.0664) (0.0565) (0.0465)
 Youth employment*Age dummy for 40 to 44 -0.144** -0.220*** -0.0598 -0.106*
 (0.0554) (0.0768) (0.0633) (0.0540)

 Youth employment*EPL 0.131
 (0.105)
 Reference age group: 25 to 29
 Youth employment*EPL*Age dummy for 30 to 34 -0.0923*
 (0.0511)
 Youth employment*EPL*Age dummy for 35 to 39 -0.155**
 (0.0598)
 Youth employment*EPL*Age dummy for 40 to 44 -0.185**
 (0.0683)
 Constant 66.57*** 73.60*** 58.47*** 70.81***
 (3.138) (2.656) (4.674) (3.768)

 Observations 14,406 14,406 14,406 14,406
 R-squared 0.940 0.930 0.932 0.948

 Notes: Data on employment rate at the country-cohort-age level from OECD. EPL stands for Employment Protection Legislation
 Index also sourced from OECD. Sample consists of 30 countries from 1960 to 2019.

18 INTERNATIONAL MONETARY FUND

 ©International Monetary Fund. Not for Redistribution
You can also read