Spatial Rainfall Rate Estimation from Multi-Source Data in Klang Valley, Malaysia
←
→
Page content transcription
If your browser does not render page correctly, please read the page content below
1

Spatial Rainfall Rate Estimation from Multi-Source Data

 Spatial Rainfall Rate Estimation from Multi-Source Data in Klang Valley, Malaysia 1-8
in Klang Valley, Malaysia

Asmat, A.,1,2* Hazali, N. A.,1 Sahak, N.,1 Tahir, W.3 and Ramli, S.3
1
 School of Chemistry and Environment, Faculty of Applied Sciences, Universiti Teknologi MARA (UiTM),
 40450 Shah Alam Selangor, Malaysia, E-mail: rnis_annis@uitm.edu.my, atiqahazali92@gmail.com,
 nurainshafikasahak06@gmail.com
2
 Climate Change & Carbon Footprint Research Group, Universiti Teknologi MARA (UiTM), 40450, Shah
 Alam, Selangor, Malaysia, E-mail: rnis_annis@uitm.edu.my
3
 Faculty of Civil Engineering, Universiti Teknologi Mara (UiTM), 40450 Shah Alam Selangor, Malaysia
 E-mail: warda053@uitm.edu.my, suzana799@uitm.edu.my
*Correspondence Author

Abstract
This study investigates rainfall distribution by estimating rainfall rate from multi-source data of rain gauge,
radar image and TRMM in Klang Valley, Malaysia. The study is also looking into rainfall intensity to identify
rainfall types based on 35mm/hr thresholds for 5-minute interval using ground rain gauge data measurement.
The results revealed that during the study period, the stratiform rainfall type was found dominant, and most of
the rainfall events occurred during the evening. The simple regression and bias error analysis have conducted
to assess the potential of radar image and TRMM for rainfall estimation rate. It has shown a positive but
relatively weak relationship of regression coefficient between the rain gauge measurements and both data
sources. The results indicated that radar image has better performance than TRMM satellite in rainfall rate
estimation over Klang Valley. The radar has estimated a total rainfall rate of about 42.5mm/hour with
percent bias are (-14.49%) of error relative to rain gauge data measurement. Meanwhile, the per cent bias
for TRMM tends to underestimate the rainfall measurement by (-42.05%) with only 28.8mm/hour total
rainfall rate were estimated. The spatial interpolation of the IDW technique reveals the rainfall distribution
pattern in the study area, interpolated rainfall distribution from a radar image has shown a good agreement
with rainfall distribution from rain gauge data measurement. Although radar image has higher accuracy in
rainfall rate, estimation due to limited data availability used in this study was unable to reveal the rainfall
pattern. Furthermore, both data products used in this study show a lower ability to detect high-intensity
rainfall events due to limited data availability appropriately.

1. Introduction
Over the past two decades, a large number Damages and losses caused by flash floods are
of rainfall products have been developed on increased over the years (D/iya et al., 2014). The
satellite-based, radar-based and rain gauge storms of convective origin by a sudden burst of
observations (Kumar et al., 2020 and Kidd and heavy rainfall over a short period are generally
Huffman, 2011). However, the uncertainties of known to be responsible for much of flash flood
rainfall variability due to the space-time variability events in urban areas (Syafrina et al., 2015). Despite
of rainfall at many scales and the spatial and the strong association between rainfall pattern and
temporal sampling hampered the optimal rainfall major flash flood, the linkages have not yet to be
estimation data (Long et al., 2016). In addition to sufficiently established (Nandargi and Mulye,
ground measurement, the used radar-based and 2012). The main reason is the difficulty in getting
satellite-based rainfall products have become reliable convective rain data, which has not readily
immensely important since ground observation identified in meteorological records. Besides, the
locations are scattered sparsely (Hur et al., 2016). rainfall pattern also can be affected by many factors
 In Malaysia, flash flood events often occur in like topography (Wong et al., 2016 and Huang et al.,
urban areas such as the Klang Valley, where the 2015), temperature (Huang et al., 2015), wind
significant factors that have influenced the flood (Wong et al., 2016) and seasonal and transition
formation are its variability in time and space (Kidd monsoon (Bharti and Singh, 2015 and
and Huffman, 2011 and Akbari et al., 2011). Fadzilatulhusni et al., 2011).

International Journal of Geoinformatics, Volume 17, No. 2, April 2021
Online ISSN 2673-0014/ © Geoinformatics International
2

 Conventionally, rainfall data is collected at monsoon and Southwest monsoon are two

 Spatial Rainfall Rate Estimation from Multi-Source Data in Klang Valley, Malaysia 1-8
discrete point locations over space at rain gauges significant monsoons that blow a wet season from
meteorological stations (Muller, 2011) and limited October to March and h blows a dry season from
in their spatial coverage (Yang and Luo, 2014 and June to September (Zad et al., 2018 and Fadhilah et
Wetchayont et al., 2013). In a small area, obtaining al., 2007). Geographically, the study site is situated
accurate rainfall information is a considerable in the hub of one of the busiest areas in Malaysia
challenge, and this has influenced temporally and between Selangor and Kuala Lumpur. This area is
spatially variation of rainfall (Hur et al., 2016). Data also pressing from its rapid urbanization and a high
acquired from rain gauges often have missing population (Al Mamun et al., 2018; Varikoden et al.,
rainfall data in the observation or insufficient 2011). The area susceptibility to flash-flood prone
rainfall stations (Wong et al., 2016). Errors of due to the high occurrence of convectional rainfalls
sparsely located (Yang and Luo, 2014) can arise and large areas of the impervious surface
using point rain gauges to represent rainfall in radar (Varikoden et al., 2011), especially during April to
or satellite pixels (Wetchayont et al., 2013). May and October inter-monsoon occurred (Lung,
 The remote sensing technology offers high 2016). These two shorter periods of inter-monsoon
temporal and spatial resolution (Wetchayont et al., seasons are marked by heavy rainfall as it yields
2013) and has excellent coverage over mountainous uniform periodic changes in the wind flow patterns
areas (Yang and Luo, 2014). However, there are still over the study site (Mohd Akhir et al., 2014).
some limits due to inter-radar calibration and radar The rain gauge rainfall data are obtained from
beam blockages by topography (Wetchayont et al., the Department of Irrigation and Drainage (DID)
2013). Meanwhile, satellite TRMM has provided Selangor. One year of rainfall data between March
accurate global tropical precipitation estimates (Su 2007-April 2008 at eighteen stations in Klang
et al., 2008) and accurately detected precipitation Valley was used for rainfall types classification
occurrences on a daily scale. Despite this limitation, using 5-minutes interval rainfall intensity. The
both data mentioned are produced better space-time threshold with less than 35mm/hr categorizes as a
distribution of precipitation and has consistency stratiform rainfall type. Meanwhile, convective
with rain gauge observations (Bharti and Singh, rainfall should occur more than 35mm/hr (Ahmad et
2015 and Yang and Luo, 2014). The drawback from al., 2008). Satellite estimate of TRMM 3B42RT
TRMM estimates is due to the temporal and spatial version 7 datasets were obtained from
scale, which lead to uncertainties in estimating https://pmm.nasa.gov/data-access/downloads/trmm
rainfall at the small-scale region (Mahmud et al., product 3B42RT version 7 with a 3-hours temporal
2015); besides, the TRMM precipitation algorithm resolution and 0.25◦ × 0.25◦ approximately 27.8 km
also poor sensitivity to low and high precipitation × 27.8 km spatial resolution (Varikoden et al.,
clouds (Varikoden et al., 2010). The effect of 2011). The data extracted for the region covering
upscaling the rainfall rate to a practical temporal Klang Valley was dated on the 29th February 2008
scale (Prasetia et al., 2013) and the coarse grid size and 1st March 2008 using GIS 10.9. To ensure all
of the TRMM data for solving local rainfall patterns the data used in this study were temporally closed to
(Zad et al., 2018) also hampered the accuracy of the each other, the TRMM rainfall values were retrieved
estimation. Therefore, it is essential to investigate by cells within an average of three hours before and
rainfall distribution by estimating rainfall rate from three hours after the event, which was similar
multi-source data of rain gauge, radar image and approached used by (Akbari et al., 2011).
TRMM in Klang Valley, Malaysia. Typically, Meanwhile, as for radar image, only available on
rainfall rate measurement based on rainfall intensity the 1st March 2008 was obtained from Malaysia
by calculating the amount of rainfall in a given time Meteorological Department (MMD). Radar
interval and expressing length (depth) per unit time. reflectivity data was obtained from S-band Terminal
The study is also looking into rainfall intensity to Doppler Radar in KLIA, operated by MMD
identify rainfall types based on 35mm/hr thresholds (Malaysia Meteorological Department) and located
for 5-minute interval using ground rain gauge data at an elevation of 37 m MSL. The conventional
measurement. radar data are collected every 10 minutes up to the
 effective range of 230 km for three elevation scans
2. Data and Method (PPI) with elevation angles of 1.0°, 2.0° and 3.0°
The study's location is in Klang Valley, Malaysia is (Ramli and Tahir, 2011). Later, the rainfall values
delineated by the Titiwangsa Range to the are retrieved from a radar image using a digitizing
northwest, Semenyih in the southeast and Port process in ArcGIS 10.9.
Klang in the Southwest and receives yearly rainfall The differences between estimated rainfall
of about 2946.8mm. In Malaysia, the Northeast values were derived using percent of error (PE)
International Journal of Geoinformatics, Volume 17, No. 2, April 2021
Online ISSN 2673-0014/ © Geoinformatics International
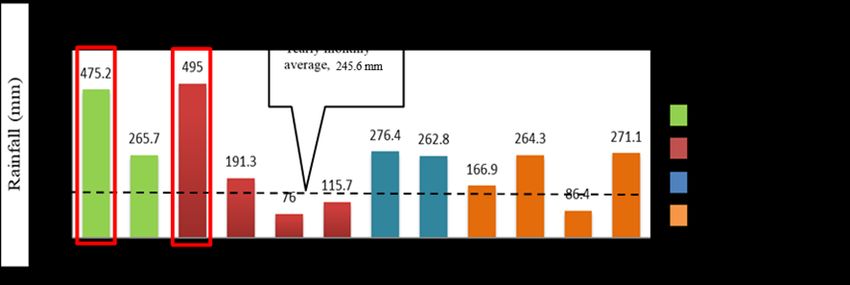
3

relative bias (Bharti and Singh, 2015 and Akbari et
 3. Results and Discussion

 Spatial Rainfall Rate Estimation from Multi-Source Data in Klang Valley, Malaysia 1-8
al., 2011) as follows:
 ( − ) In Figure 1, a plot of one-year rainfall data from rain
 Relative Bias = × 100 gauge data measurement. The results show about

 Equation 1 68% of the total rainfall has occurred during a
 daytime period at 0700h until late evening at 1900h
Ei estimates the imaging data, and is the as compared to 32% of total rainfall recorded after
observation from the rain gauge data. The spatial 1900h and onwards. Besides, the highest amount of
interpolation techniques are a reliable approach to rainfall was recorded at about 542.2mm at 1700h. It
estimate climate information for unobserved shows the pattern of rainfall events in the afternoon
locations from nearby measurements (Berndt and at 1400h until it has reached the highest peak in the
Haberlandt, 2018).This approach resolves such late afternoon at 1700h. A similar study by
partial rainfall data; probable rainfall data can be (Varikoden et al., 2011) also found that the rise of
estimated using the technique (Chen and Liu, 2012). rain occurrences observed at 1700h. High rainfall
In this study, to observe rainfall distributions, an events in the late afternoon and late evening may
Inverse Distance Weighting (IDW) was applied on happen due to warm moist air by diurnal heating
rain gauge, radar and TRMM (Waken et al., 2018). associated with the strong solar irradiance at low
The drawback with this technique is that it assumes latitudes (Wu et al., 2009). Figure 2 shows the
that maximum and minimum values are measured at highest rainfall rate has been recorded in June, about
the sampled points, and all other unsampled points 495mm, and in April, with a total amount of rainfall
have values between those values (Grimpylakos et has recorded about 475.2mm.
al., 2013).

 Hourly average,
 122.8 mm

Figure 1: Rainfall amount in mm with the 24-hours measurement for April 2007 until March 2008. Diurnal
rainfall shows the rain falls starts in the afternoon at 14:00hr and reach its highest peak at the 17:00hr

Figure 2: The monthly amount of rainfall during four dominants seasonal in April 2007 until March 2018. The
graph shows that the rainfall intensity exceeded the yearly monthly average (245.6mm) for most of the
months regardless of specific monsoon
International Journal of Geoinformatics, Volume 17, No. 2, April 2021
Online ISSN 2673-0014/ © Geoinformatics International
4

 Spatial Rainfall Rate Estimation from Multi-Source Data in Klang Valley, Malaysia 1-8
Many studies have found a similar trend of extreme and magnitude of the error (Wong et al., 2016 and
rainfall in Peninsular Malaysia, which occurs during Varikoden et al., 2011). Also, rainfall trend is not
April-May throughout the year (Syafrina et al., only affected by weather and climate, but sparsely
2015). As stated by (Zad et al., 2018 and Mohd location of the station, topographic location of
Akhir et al., 2014), these two inter-monsoon seasons station and data measurement instrument will also
typically happened in a short period with uniform influence the homogeneity of rainfall time series
periodic changes in low wind pattern has yielded (Waken et al., 2018).
heavy rainfall. The magnitude of rainfall during The estimated rainfall rate from a rain gauge,
inter-monsoon can also enter the other season (Al radar image and TRMM is tabulated in Table 1. The
Mamun et al., 2018). Climate change has been one results show the total rainfall rate was measured
reason for the distribution and rainfall rate (Kidd from the rain gauge measurement of about 49.7 mm.
and Huffman, 2011). This scenario can be observed Radar image has produced a slight difference with
on total rainfall in June, which falls during the the total estimated rainfall rate of 42.5mm.
Southeast Monsoon and has recorded about 495mm. Meanwhile, the estimated total rainfall rate from
Furthermore, a study by (Syafrina et al., 2015) has TRMM was too low, with only recorded about
revealed the extreme rainfall events patterns from 28.8mm. Overall results from all stations; showed
1975-2010 in Peninsular Malaysia normally occurs discrepancies of rainfall rate estimated between rain
during April-May. They also found the rainfall gauge and both data sources: radar and TRMM.
amount during these periods can be up to 49.93mm Inconsistent rainfall estimation was showed at
to 491.87mm. station R14 and station R15, where radar has
 As the study area is located in a tropical country, recorded high rainfall rate values and TRMM has
the convective rainfall types are expected to be recorded low rainfall rate compared to rainfall
dominant (Ahmad et al., 2008), which is not the measured from the rain gauge. Similar results can be
case during the study period. Several factors may found from (Ahmad et al., 2008) where substantial
contribute to the finding, one of the significant differences of value were found between radar and
caused are limited data availability (Huang et al., rain gauge measurement. The evaporation process
2015), underestimated ground measurement data of precipitation can cause a different reading
due to the effect of wind at the mouth of the rain between rainfall and radar before reaching the
gauge, wetting, evaporation, splashing, and the ground, which may be more intense in the tropic
inadequate spatial coverage of rain gauge stations region (Bharti and Singh, 2015; Yu et al., 2014).

 Table 1: The estimated rainfall rate in (mm/hr) from rain gauge measurement, radar and TRMM on
 the 1st March 2008
 Ground Radar TRMM
 No. Stations
 Observation Image
 Rainfall Rate (mm/hr)
 R1 3116006 - Ldg Edinburgh Site 2 2.0 0.8 2.19
 R2 3217003 - KM11 Gombak 1.0 1.0 1.57
 R3 3216001 - Kg Sg Tua 5.0 0.5 1.17
 R4 3116003 - JPS Malaysia 3.5 0.4 2.42
 R5 3018101 - Emp. Semenyih 0 0 1.83
 R6 3118102 - SK Kg Lui 0 0 1.85
 R7 3119104 - Jln Genting Peres 0 0 2.05
 R8 2917001 - JPS Kajang 0 0 1.37
 R9 3117070 - JPS Ampang 0 0.6 2.21
 R10 3115079 - Pusat Penyelidikan Sg Buloh 10.0 10.0 2.44
 R11 3315037 - Tmn Bkt Rawang 3.0 1.1 1.02
 R12 3315038 - Country Home 2.1 1.1 1.77
 R13 3217004 - Kg Kuala Sleh 3.0 0 1.35
 R14 3217002 - Emp. Genting Klang 4.1 13.0 1.54
 R15 3317001 - Air Terjun Sg Batu 5.0 12.0 0.57
 R16 3317004 - Genting Sempah 6.0 2.0 0.41
 R17 3014091 - UiTM Shah Alam 3.0 0 1.32
 R18 3014084 - JPS Klang 2.0 0 1.72
 TOTAL 49.7 42.5 28.8

International Journal of Geoinformatics, Volume 17, No. 2, April 2021
Online ISSN 2673-0014/ © Geoinformatics International
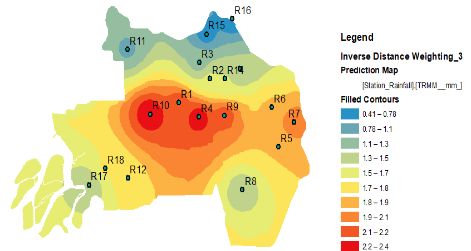
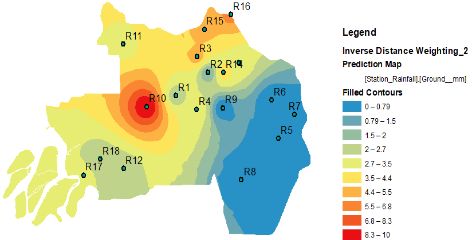
5

The wind movement can also be affected (Wong et 2011). The negative bias has indicated that the

 Spatial Rainfall Rate Estimation from Multi-Source Data in Klang Valley, Malaysia 1-8
al., 2016) when the winds are carried away by rainfall rate estimated from radar and TRMM is less
precipitation from beneath the rain-producing cloud. than from rain gauge data measurement and vice-
The discontinuities in the vertical distribution of versa for positive bias (Akbari et al., 2011). A
rainfall in the cloud may also affect the reflectivity study by (Hur et al., 2016) also found
and other errors (Kumar et al., 2020). underestimated rainfall rate on satellite-based
 The regression coefficient generally shows a estimation. Several reasons have made intrinsically
positive but weak relationship between the rain different between satellite-based measurement and
gauge measurements and both data sources of radar ground observation. The satellite's rainfall
and TRMM with R2 (0.3792) and R2 (0.0374), measurement is based on the average value within a
respectively. The results in Table 2 has indicated pixel due to its field-of-view and point value from
that radar image has better performance than ground measurement (Zad et al., 2018).
TRMM satellite in rainfall rate estimation over the The spatial distributions of rainfall were derived
Klang Valley region. The estimated total rainfall by inverse distance weighting (IDW) on rain gauge,
rate from the radar is about 42.5mm/hour with radar and TRMM. The interpolated rainfall
percentage bias are (-14.49%) of error relative to distributions from the radar image have shown good
rain gauge data measurement. Meanwhile, the agreement with rainfall distribution from rain gauge
percent bias shows that TRMM tends to data measurement, as shown in Figure 3a-3c. The
underestimate the rainfall measurement by (-42.05%) rainfall contour patterns of radar data have exhibited
with only 28.8mm/hour rainfall rate were estimated. similar patterns with rain gauge data measurement.
Overall, rainfall estimated from radar was slightly However, rainfall distribution from TRMM failed to
underestimated with rain gauge measurement, and show good agreements between radar and rain
similar finding has been found by (Muller, 2011). gauge data. Overall, the isohyetal lines derived from
Several factors may influence the negative bias, i.e., the rain gauge, radar and TRMM data are smoothly
altitude (Yu et al., 2014), where radar rainfall produced by IDW. Moreover, the spatial
intensity observes almost instantaneously at the distributions between TRMM and radar rainfall are
volume of the atmosphere with 1km2 surface remarkably different, especially at a low rainfall
projection, while rain gauge accumulates continuous rate.
rain falling on the area smaller than 1m 2 (Muller,

 Table 2: The percent error (PE) % derived from estimated rainfall rate from radar and TRMM on
 the 1st March 2008
 Radar
 Ground TRMM
 No Station Image PE % PE %
 (mm) (mm)
 (mm)
 R1 3116006 - Ldg Edinburgh Site 2 2 0.8 -2.41 2.19 0.38
 R2 3217003 - KM11 Gombak 1 1 0.00 1.57 1.15
 R3 3216001 - Kg Sg Tua 5 0.5 -9.05 1.17 -7.71
 R4 3116003 - JPS Malaysia 3.5 0.4 -6.24 2.42 -2.17
 R5 3018101 - Emp. Semenyih 0 0 0.00 1.83 3.68
 R6 3118102 - SK Kg Lui 0 0 0.00 1.85 3.72
 R7 3119104 - Jln Genting Peres 0 0 0.00 2.05 4.12
 R8 2917001 - JPS Kajang 0 0 0.00 1.37 2.76
 R9 3117070 - JPS Ampang 0 0.6 1.21 2.21 4.45
 R10 3115079 - Pusat Penyelidikan Sg. Buloh 10 10 0.00 2.44 -15.21
 R11 3315037 - Tmn Bkt Rawang 3 1.1 -3.82 1.02 -3.98
 R12 3315038 - Country Home 2.1 1.1 -2.01 1.77 -0.66
 R13 3217004 - Kg Kuala Sleh 3 0 -6.04 1.35 -3.32
 R14 3217002 - Emp. Genting Klang 4.1 13 17.91 1.54 -5.15
 R15 3317001 - Air Terjun Sg Batu 5 12 14.08 0.57 -8.91
 R16 3317004 - Genting Sempah 6 2 -8.05 0.41 -11.25
 R17 3014091 - UiTM Shah Alam 3 0 -6.04 1.32 -3.38
 R18 3014084 - JPS Klang 2 0 -4.02 1.72 -0.56
 TOTAL 49.7 42.5 28.8
 Relative -14.49 Relative -42.05
 Bias Bias

International Journal of Geoinformatics, Volume 17, No. 2, April 2021
Online ISSN 2673-0014/ © Geoinformatics International
6

 Spatial Rainfall Rate Estimation from Multi-Source Data in Klang Valley, Malaysia 1-8
 a) b)

 c)
Figure 3: Rainfall distribution pattern on the 1st March 2018 using an Interpolation Distance Weighted (IDW)
for a) ground observation b) Radar and c) TRMM

This happened might be due to the uncertainties of availability of the TRMM precipitation algorithm to
TRMM (Mahmud et al., 2015 and Chokngamwong be more sensitive to low and high precipitation
and Chiu, 2008) and further complicated by is the clouds, the effect of upscaling the rainfall rate to a
occurrence of missing data for some of the events. practical temporal scale, and the coarse grid size of
 the TRMM data hold back in solving local rainfall
4. Conclusion patterns.
This study explored the potential of estimating the Moreover, the 'non-representative sampling'
rainfall from multi-source data of rain gauge, radar error has also limited radar's ability to detect small
and TRMM for rainfall estimation rate in Klang particles, which occurs predominantly during weak
Valley, Malaysia. However, estimating rainfall from rainfall events. Since rainfall significantly varies
high spatiotemporal rainfall fields is challenging over distance and change during the time interval, it
when only a sparse rain gauge network and coarse seems the gauge measurement may not entirely
spatial resolution of satellite data are available. The represent the area sampled by radar. It is suggested
results of this investigation showed that the radar that the 'non-representative sampling' error could be
and TRMM products used in this study offer a lower reduced by interpolating rain gauge values (before
ability to detect high-intensity rainfall events analysis) into a grid (mean areal precipitation)
appropriately. Regardless of the limitation, yet radar matching the size of radar's pixels.
has performed better in estimating rainfall rate than The point-based observations of rainfall
TRMM data in the study areas. Since satellite-based provided by rain gauges are not always dense
rainfall products are estimates from indirect enough to accurately represent a region's rainfall, as
measures (e.g., IR cloud-top temperature), they are presented in this study. Hence, smaller sampling,
prone to errors greater than radar-based rainfall and random errors can arise in using point rain
measurements. Many studies reported that the gauges to represent rainfall of a radar or satellite
temporal and spatial scale is crucial in affecting the pixel, particularly in areas where the rain gauge
performance for both data radar and TRMM rainfall network is relatively sparse. In contrast, it has been
estimates, especially for local-scale rainfall in a found that radar provides pixel-based area rainfall
small region. Also, the uncertainties include the measurements with better spatial coverage that is

International Journal of Geoinformatics, Volume 17, No. 2, April 2021
Online ISSN 2673-0014/ © Geoinformatics International
7

more comparable to the scale of satellite imagery. Valley, Malaysia. Characterization of

 Spatial Rainfall Rate Estimation from Multi-Source Data in Klang Valley, Malaysia 1-8
This encourages the use of high-resolution rainfall Convective Rain in Klang Valley, Malaysia.
product, which can be obtained from combined Akbari, A., Othman, F. and Samah, A. A., 2011,
satellite-based estimates with radar-based. To Probing on Suitability of TRMM Data to
improve the accuracy, the bias of any of the Explain Spatio-Temporal Pattern of Severe
products relative to each other should be removed. Storms in Tropic Region. Hydrol. Earth Syst.
In the absence of ground-based radar data over the Sci. Discuss, Vol. 8, 9435–9468.
study, the region makes the evaluation methods rely Al Mamun, A., Bin Salleh, M. N. and Noor, H. M.,
solely on rain gauges; therefore, the validation 2018, Estimation of Short-Duration Rainfall
approaches are limited. On the other hand, more Intensity from Daily Rainfall Values in Klang
data for radar and TRMM measurement are Valley, Malaysia. Applied Water Science, Vol.
critically needed to improve the accuracy of existing 8(7), 1–10.
work and provide better insight into the study area's Bharti, V. and Singh, C., 2015, Evaluation of Error
rainfall rate pattern. in TRMM 3B42V7 Precipitation Estimates over
 Besides, understanding rainfall estimates at a the Himalayan Region. Journal of Geophysical
finer scale over the study site, cloud formation, Research: Atmospheres, Vol. 120(24), 12458-
classification, and characteristics are essential in 12473.
precipitation. Each of these factors should be Berndt, C. and Haberlandt, U., 2018, Spatial
analyzed to get more accurate results in rainfall Interpolation of Climate Variables in Northern
estimation. In this study, rainfall is based only on Germany—Influence of Temporal Resolution
the clouds' top temperature, ignoring their and Network Density. Journal of Hydrology:
characteristics. The type of precipitation (convective Regional Studies, Vol. 15, 184–202.
or stratiform) will determine the rainfall rate, Chen, F. W. and Liu, C. W., 2012, Estimation of the
whereas identifying the precipitation type using Spatial Rainfall Distribution using Inverse
remote sensing techniques is still a challenge. Distance Weighting (IDW) in the Middle of
TRMM shows a weak to moderate performance at Taiwan. Paddy and Water Environment, Vol.
the daily scale which is better suited to estimate 10(3), 209–222.
monthly cumulative rainfall than shorter time Chokngamwong, R. and Chiu, L. S., 2008, Thailand
ranges. Daily Rainfall and Comparison with TRMM
 Similarly, radar estimated rain rates observed Products. Journal of Hydrometeorology, Vol.
instantaneously at any given measurement cell may 9(2), 256–266.
not represent intensities during the intervals between D/iya, S., Gasim, M., Toriman, M. and Abdullahi,
observations. Also, limitation in the existing rainfall M., 2014, Floods in Malaysia: Historical
estimation method that provides radar rainfall on Reviews, Causes, Effects and Mitigation
average instead of the actual rainfall may result in Approach. International Journal of
underestimated rain by radar. Nevertheless, these Interdisciplinary Research and Innovations,
deficiencies could be refined by improving rainfall Vol.2 (4), 59-65.
retrieval by distinguishing between convective and Fadhilah, Y., Zalina, M. D., Nguyen, V. T. V.,
stratiform clouds where the precipitation growth in Suhaila, S. and Zulkifly, Y., 2007, Fitting the
both conditions is different. Best–Fit Distribution for the Hourly Rainfall
 Amount in the Wilayah Persekutuan. Jurnal
Acknowledgements Teknologi, Vol. 46, 49–58.
The authors gratefully acknowledge the Department Fadzilatulhusni, S., Sani, M. and Rindam, M., 2011,
of Irrigation and Drainage (DID) and the Analisis Taburan Hujan dan Impaknya kepada
Department of Meteorological Malaysia for Sumber Air di Pulau Pinang. Malaysia Journal
providing the rainfall data. The authors are also of Society and Space, Vol. 7(1), 53–63.
thankful to the Office of Deputy Vice-Chancellor Grimpylakos, G., Karacostas, T, S. and Albanakis,
(Research and Innovation), Universiti Teknologi K., 2013, Spatial and Temporal Distribution of
MARA (UiTM), for the financial support under the Rainfall and Temperature in Macedonia, Greece,
Mitra Perdana Research Grant No. 600- over a Thirty Year Period using GIS. Bulletin of
Irmi/Perdana 5/3/Mitra (004/2018)-2. the Geological Society of Greece, Vol. 47,
 1458–1471.
References Huang, Y. F., Puah, Y. J., Chua, K. C. and Lee, T.
 S., 2015, Analysis of Monthly and Seasonal
Ahmad, N., Yusop, Z. and Daud, Z. M., 2008, Rainfall Trends using the Holt’s Test.
 Characterization of Convective Rain in Klang
International Journal of Geoinformatics, Volume 17, No. 2, April 2021
Online ISSN 2673-0014/ © Geoinformatics International
8

 International Journal of Climatology, Vol. 35, Analysis (TMPA) and Its Utility in Hydrologic

 Spatial Rainfall Rate Estimation from Multi-Source Data in Klang Valley, Malaysia 1-8
 1500-1509. Prediction in the La Plata Basin. Journal of
Hur, J., Raghavan, S. V., Nguyen, N. S. and Liong, Hydrometeorology, Vol. 9, 622–640.
 S. Y., 2016, Evaluation of High-Resolution Syafrina, A. H., Zalina, M. D. and Juneng, L., 2015,
 Satellite Rainfall Data over Singapore. Procedia Historical Trend of Hourly Extreme Rainfall in
 Engineering, Vol. 154, 158–167. Peninsular Malaysia. Theoretical and Applied
Kidd, C. and Huffman, G., 2011, Review Global Climatology, Vol. 120, 259–285.
 Precipitation Measurement. Meteorological Varikoden, H., Preethi, B., Samah, A. A. and Babu,
 Applications, Vol. 18, 334-353. C. A., 2011, Seasonal Variation of Rainfall
Kumar, S., Del Castillo-Velarde, C., Prado, J. M. Characteristics in Different Intensity Classes
 V., Rojas, J. L. F., Gutierrez, S. M. C., Alvarez, over Peninsular Malaysia. Journal of Hydrology,
 A. S. M. and Silva, Y., 2020, Rainfall Vol. 404, 99–108.
 Characteristics in the Mantaro Basin over Varikoden, H., Samah, A. A. and Babu, C. A., 2010,
 Tropical Andes from a Vertically Pointed Profile Spatial and Temporal Characteristics of Rain
 Rain Radar and In-Situ Field Campaign. Intensity in the Peninsular Malaysia using
 Atmosphere, Vol. 11(3), 1-21. TRMM Rain Rate. Journal of Hydrology, Vol.
Long, Y., Zhang, Y. and Ma, Q., 2016, A Merging 387, 312–319.
 Framework for Rainfall Estimation at High Waken, R. J., Song, J. J., Kwon, S., Min, K. H. and
 Spatiotemporal Resolution for Distributed Lee, G. W., 2018, A Flexible and Efficient
 Hydrological Modeling in a Data-Scarce Area. Spatial Interpolator for Radar Rainfall
 Remote Sensing, Vol. 8(7), 1-18. Estimation. Journal of Applied Statistics, Vol.
Lung, C. H., 2016, Statistical Models for Daily 45(5), 829-844.
 Rainfall Data: A Case Study in Selangor, Wetchayont, P., Hayasaka, T., Satomura, T.,
 Malaysia. Katagiri, S. and Baimoung, S., 2013, Retrieval
Mahmud, M. R., Numata, S., Matsuyama, H., of Rainfall by Combining Rain Gauge, Ground-
 Hosaka, T. and Hashim, M., 2015, Assessment Based Radar and Satellite Measurements over
 of Effective Seasonal Downscaling of TRMM Phimai, Thailand. Scientific Online Letters on
 Precipitation Data in Peninsular Malaysia. the Atmosphere: SOLA, Vol. 9, 166–169.
 Remote Sensing, Vol. 7(4), 4092–4111. Wong, C. L., Liew, J., Yusop, Z., Ismail, T.,
Muller, A., 2011, Analyzing Radar-Measured Venneker, R. and Uhlenbrook, S., 2016, Rainfall
 Rainfall Vs. Rain Gauges in GIS. GIS Ostrava Characteristics and Regionalization in
 2011. Peninsular Malaysia Based an a High Resolution
Mohd Akhir, M. F., Zakaria, N. Z. and Tangang, F., Gridded Data Set. Water, Vol. 8(11), 1-16.
 2014, Intermonsoon Variation of Physical Wu, P., Hara, M., Hamada, J. I., Yamanaka, M. D.
 Characteristics and Current Circulation Along and Kimura, F., 2009, Why a Large Amount of
 The East Coast of Peninsular Malaysia. Rain Falls over the Sea in the Vicinity of
 International Journal of Oceanography, Vol. Western Sumatra Island during Nighttime.
 2014, 1–9. Journal of Applied Meteorology and
Nandargi, S. and Mulye, S. S., 2012, Relationships Climatology, Vol. 48(7), 1345–1361.
 between Rainy Days, Mean Daily Intensity, and Yang, Y. and Luo, Y., 2014, Evaluating the
 Seasonal Rainfall over the Koyna Catchment Performance of Remote Sensing Precipitation
 During 1961–2005. The Scientific World Products CMORPH, PERSIANN, and TMPA, in
 Journal, Vol. 2012, 1-10. the arid region of Northwest China. Theoretical
Prasetia, R., As-Syakur, A. R., and Osawa, T., 2013, and Applied Climatology, Vol. 118, 429-445.
 Validation of TRMM Precipitation Radar Yu, N., Barthe, C. and Plu, M., 2014, Evaluating
 Satellite Data over Indonesian Region. Intense Precipitation in High-Resolution
 Theoretical and Applied Climatology, Vol. 112 Numerical Model over a Tropical Island: Impact
 (3-4), 575–587. of Model Horizontal Resolution. Natural
Ramli, S. and Tahir, W., 2011, Radar Hydrology: Hazards and Earth System Sciences Discuss.,
 New Z/R Relationships for Klang River Basin, Vol. 2, 999-1032.
 Malaysia. International Conference on Zad, S. N. M., Zulkafli, Z. and Muharram, F. M.,
 Environment Science and Engineering, Vol. 8, 2018, Satellite Rainfall (TRMM 3B42-V7)
 248–251. Performance Assessment and Adjustment over
Su, F., Hong, Y. and Lettenmaier, D. P., 2008, Pahang River Basin, Malaysia. Remote Sensing,
 Evaluation of TRMM Multisatellite Precipitation Vol. 10(3), 1-24.

International Journal of Geoinformatics, Volume 17, No. 2, April 2021
Online ISSN 2673-0014/ © Geoinformatics International
You can also read