Benchmarks Practical Applications - Return - Kevin Webb, CFA - PowerPoint Presentation
←
→
Page content transcription
If your browser does not render page correctly, please read the page content below

Benchmarks
Practical Applications - Return
                                  Kevin Webb, CFA
                                   Kevin.Webb@psc.com
                                       Piper Sandler
Philosophy, Strategy & Tactics
Sleep-Adusted returns via Suitability Benchmark using evidence based methods.

                                               Philosophy                                    A plan of action or policy to
Investment philsophy is a                                                                     achieve one or more goals
coherent way of thinking                                                                        (e.g., demonstrate good
about the markets, risk,                                                                     stewardship via a suitability
return, investor behaviour,                                                                                 benchmark).
etc.

                              Tactics                                             Strategy
Resources, skills &
methods used to
achieve the goal of a                                                                                   The intersection of
strategy (e.g.,                                                                                     philosophy, strategy &
education, formulas,                                                                                 tactics is the world of
data, software, etc.)                                                                               portfolio management
              The difference between strategy and tactics: Strategy is done above the
                         shoulders, Tactics are done below the shoulders.
                                        Designed and created by Kevin Webb, CFA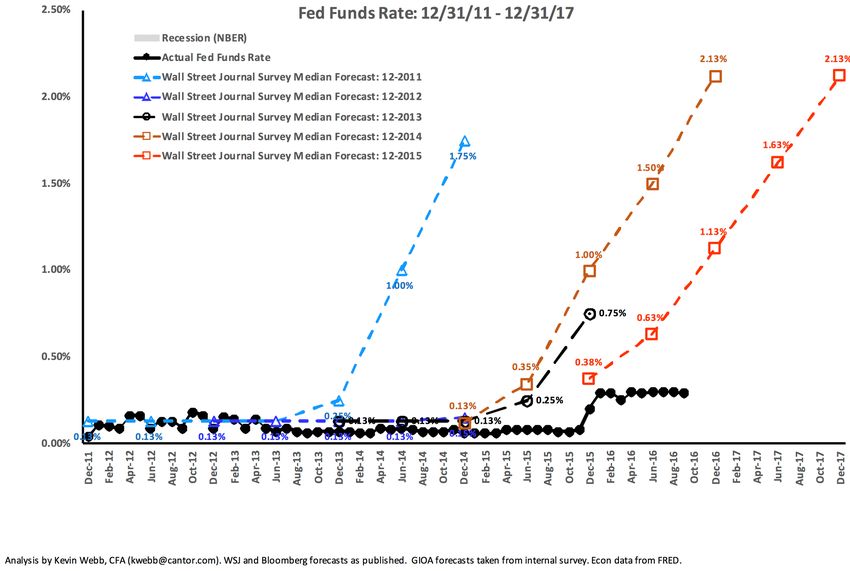
Benchmark Practical Applications - Return
Agenda

         Assumptions/Definitions

         Return: Forecasting

         Return: Book Yield / Total Return

         Return: Gain/Loss

         Return: Weighted Equivalent Bond Benchmarks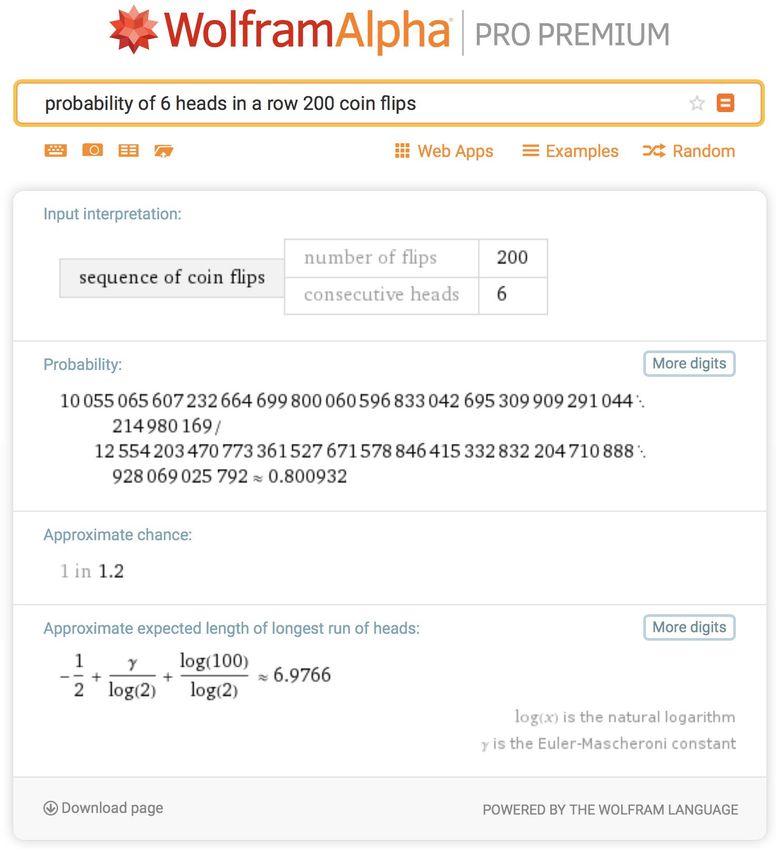
Benchmark Practical Applications - Return
Agenda

         Assumptions/Definitions

         Return: Forecasting

         Return: Book Yield / Total Return

         Return: Gain/Loss

         Return: Weighted Equivalent Bond Benchmarks
Definitions
                                                       “Knowledge is knowing a tomato
                                                       is a fruit; Wisdom is not putting it
                                                       in a fruit salad.”

    Brandreth, Gyles. Oxford Dictionary of Humorous Quotations (Kindle Location 4265). OUP Oxford. Kindle Edition.
See this useful Microsoft Help page for Microsoft Word on the definition/history of “Lorem Ipsum Dolor Sit Amet Etiam”:
                                    https://support.microsoft.com/en-us/kb/114222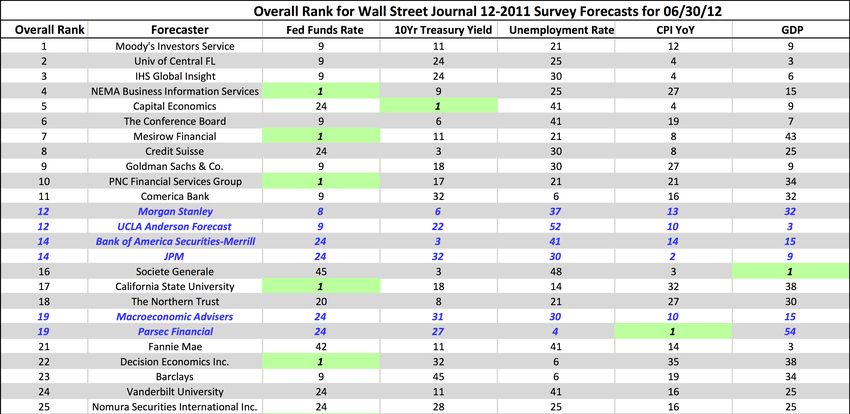
Risk Defined
More things can happen than will happen.

   … It has been philosophically
   defined by finance professor Elroy
   Dimson of London Business School
   this way: “Risk means more
   things can happen than will
   happen.” In the end, risk is the
   gap between what investors think
   they know and what they end up
   learning— about their
   investments, about the financial
   markets, and about themselves.

          Zweig, Jason. The Devil's Financial Dictionary (p. 182). PublicAffairs. Kindle Edition. Emphasis added.
Return Defined
“A rate of return is the gain received from an investment over a period of time
expressed as a percentage. Returns are a ratio relating how much was gained given
how much was risked. …
There are several reasons that returns have emerged as the preferred statistic for
summarizing investment performance:

*The rate of return concentrates a lot of information into a single statistic. ...

*This single number, the return, is a ratio. It is faster for an investor to analyze
proportions than absolute numbers. ...

*Returns are comparable even if the underlying figures are not. ...

*Returns calculated for different periods are comparable; that is, an investor can
compare this year's return to last year’s. …

*The interpretation of the rate of return is intuitive. Return is the value reconciling the
beginning investment value to the ending value over the time period we are
measuring. … “

     The Theory and Practice of Investment Management (Frank J. Fabozzi Series) (Kindle Locations 1180-1189). Kindle Edition. Emphasis
                                                                added.
Risk & Return are Related
Finding the right trade-off is the key

  *The scientist who developed the
  Saturn 5 rocket that launched the
  first Apollo mission to the moon put
  it this way: "You want a valve that
  doesn't leak and you try everything
  possible to develop one. But the real
  world provides you with a leaky
  valve. You have to determine how
  much leaking you can tolerate."
  (Obituary of Arthur Rudolph, in The
  New York Times, January 3, 1996.)

    Peter L. Bernstein. Against the Gods: The Remarkable Story of Risk (Kindle Locations 69-71). Kindle Edition. Emphasis added.
Benchmark

WolframAlpha, http://www.wolframalpha.com/input/?i=benchmark&rawformassumption=%7B%22C%22,+%22benchmark%22%7D+-
      %3E+%7B%22Word%22%7D&rawformassumption=%7B%22DPClash%22,+%22FinancialE%22,+%22benchmark%22%7D+-
                                   %3E+%7B%22NYSE:BHE%22%7D (December 30, 2016).
Benchmarks ~ Expectations
What Should I Benchmark?
             Prudent Person                                                        Prudent Investor
   Investments shall be made with                                        A U.S. law that sets the standard of
       judgment and care, under                                           fiduciary duty for those entrusted
circumstances then prevailing, which                                     with the responsibility of managing
persons of prudence, discretion and                                      others' money, such as trustees and
      intelligence exercise in the                                      estate administrators. It requires that
  management of their own affairs,                                        a trustee weigh risk versus reward
      not for speculation, but for                                       when making investment decisions,
     investment, considering the                                         taking into account the income that
  probable safety of their capital as                                   may be generated by the investment
  well as the probable income to be                                      as well as the probable safety of the
                derived.                                                            invested capital.
                               Prudent Investor vs Prudent Man/Person
  1. Trust accounts are judged on their entire portfolio, rather than whether the investment was
                                    prudent at the time of purchase.
                2. Diversification is explicitly required under the Prudent Investor Act
                3. Suitability is deemed more important than individual investments
      4. Fiduciaries are allowed to delegate investment management to qualified third parties
         https://www.investopedia.com/terms/p/prudent-investor-rule.asp & https://www.investopedia.com/terms/p/prudentmanrule.asp
What Should I Benchmark?
General Objectives
“The primary objectives, in priority order...
1. Safety
Safety of principal is the foremost objective… The goal will be to
mitigate credit risk and interest rate risk.
2. Liquidity
The investment portfolio shall remain sufficiently liquid to meet all
operating requirements that may be reasonably anticipated.
3. Return
The investment portfolio shall be designed with the objective of
attaining a market rate of return throughout budgetary and
economic cycles, taking into account the investment risk
constraints of safety and liquidity needs.”
GFOA Sample Investment Policy, accessed 12/31/16, pages 1-2. Emphasis added.Benchmark Suitability
Gain/Loss is not listed! Why not?
Primary
Primary Liquidity
Liquidity Port: 20.0%
Plan:15.0%
Secondary
Secondary Liquidity
Liquidity Port: 15.0%
Plan:15.0%
Total
Total Liquidity
Liquidity Port: 35.0%
Plan:30.0%
Effective
Effective Duration
Duration Port: 1.93
Plan:1.80
Composite
Credit Rating
Composite Port: AAA
Credit Rating Plan:AAA
Market Rate of Return
Port: 1.65%
Market Rate Plan:1.34%
Return
For the background and concepts behind this visualization see the presentation “Understanding Benchmarks: Concepts” by Kevin Webb, CFABenchmark Practical Applications - Return
Agenda
Assumptions/Definitions
Return: Forecasting
Return: Book Yield / Total Return
Return: Gain/Loss
Return: Weighted Equivalent Bond Benchmarks"The only function of economic forecasting is to make astrology look respectable." - John Kenneth Galbraith
Prediction Forecast
Verb
noun (past and past participle
a thing predicted; a forecast or forecasted) [
forecast: a prediction with obj. ]
that the Greeks would predict or estimate (a
destroy the Persian future event or trend):
empire. rain is forecast for
• the action of Prediction Forecast eastern Ohio | [ with
predicting something: obj. and infinitive ] : coal
the prediction of future consumption is forecast
behavior. to increase.
ORIGIN noun
mid 16th cent.: from a prediction or estimate
Latin praedictio(n-), of future events,
from praedicere ‘make especially coming
known beforehand’ weather or a financial
(see predict) . trend.
forecaster |ˈfôrˌkastər| noun: a person who predicts or estimates a
future event or trend: economic forecasters are predicting a downturn.Financial experts kNOw better, right?
Franklin Raines (CEO of
Fannie Mae), 10th June
2004: "These subprime
assets are so riskless
that their capital for
holding them should
be under 2 percent."
http://www.zerohedge.com/news/2013-12-09/10-worst-economic-predictions-everFinancial experts kNOw better, right?
Ben Bernanke, 10th
January 2008 - "The
Federal Reserve is
currently not
forecasting a
recession."
http://www.zerohedge.com/news/2013-12-09/10-worst-economic-predictions-ever“Generate a long series of coin
flips producing heads and tails
with 50% odds each and fill up
sheets of paper. If the series is
long enough you may get eight
heads or eight tails in a row,
perhaps even ten of each. Yet
you know that in spite of these
wins the conditional odds of
getting a head or a tail is still
50%.”
Taleb, Nassim Nicholas (2008-10-06). Fooled by Randomness: The Hidden Role of Chance in Life and in the Markets (Incerto)
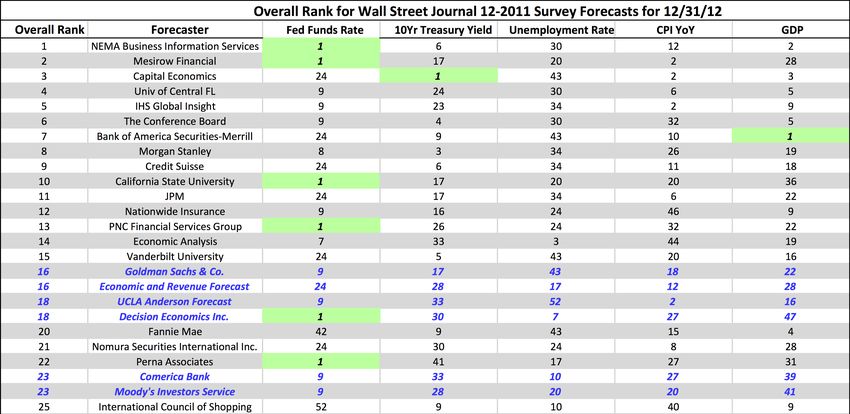
(Kindle Locations 2813-2815). Random House Publishing Group. Kindle Edition.100 Simulations: Avg~4.7 / # >=4 ~ 70 Analysis by Kevin Webb, CFA. WSJ and Bloomberg forecasts as published. Econ data from FRED.
Odds of 6 Heads in a row on 200 flips? http://www.wolframalpha.com/input/?i=probability+of+6+heads+in+a+row+200+coin+flips
Who did the best? Analysis by Kevin Webb, CFA. WSJ and Bloomberg forecasts as published. Econ data from FRED.
Who did the best the next time? Not the same firms.
Analysis by Kevin Webb, CFA. WSJ and Bloomberg forecasts as published. Econ data from FRED.What about the FED? 12/14/2016 Forecasts
Benchmark Practical Applications - Return
Agenda

         Assumptions/Definitions

         Return: Forecasting

         Return: Book Yield / Total Return

         Return: Gain/Loss

Return: Weighted Equivalent Bond BenchmarksTotal Return Defined
Total Return assumes indifference between Price return & Income return.
“Total rate of return measures the increase in the investor’s wealth
due to both investment income (for example, dividends and interest)
and capital gains (both realized and unrealized). The total rate of
return implies that a dollar of wealth is equally meaningful to the
investor whether that wealth is generated by the secure income from
a 90-day Treasury bill or by the unrealized appreciation in the price of
a share of common stock.”
Price
Income
Price Income
Managing Investment Portfolios: A Dynamic Process (CFA Institute Investment Series) (p. 723). Wiley. Kindle Edition. Emphasis added.
Mark P. Kritzman. The Portable Financial Analyst: What Practitioners Need to Know (Wiley Finance) (Kindle Locations 452-454). Kindle Edition.What are your Return Preferences?
Total Return assumes indifference between Price return & Income return.
Total rate of return measures the increase in the investor’s wealth due
to both investment income (for example, dividends and interest) and
capital gains (both realized and unrealized). The total rate of return
implies that a dollar of wealth is equally meaningful to the investor
whether that wealth is generated by the secure income from a 90-
day Treasury bill or by the unrealized appreciation in the price of a
share of common stock.
Price Income
Most public funds are income
Incomeoriented and put more
Price weight on income. If you don’t budget gains/losses and
aren’t tasked with portfolio growth from investments
then you likely have an income preference.
Income
Managing Investment Portfolios: A Dynamic Process (CFA Institute Investment Series) (p. 723). Wiley. Kindle Edition. Emphasis added.We are told that Total Return is “better” than yield.
“Yield to maturity (YTM hereafter) is “the standard
measure of the total rate of return of the bond over its
life. …… This interest rate is often viewed as a measure of
the average rate of return that will be earned on a bond
if it is bought now and held until maturity” (Bodie, et al,
2002, p. 426). And it is considered “the most accurate
measure of interest rate” (Mishkin, 2004, p. 64).
Unfortunately, due to a fact that “yield to maturity will
equal the rate of return realized over the life of the bond
if all coupons are reinvested at an interest rate equal to
the bond’s yield to maturity (Bodie, et al, 2002, p. 429),
YTM has been widely misinterpreted as “the true rate of
return an investor would receive by holding the security
until its maturity if each … interest payment is reinvested
at the yield to maturity” (Strong, 2004, p.70, italic
original). Similar interpretations can be also found in, to
name a few, Reilly and Brown (1997, pp.530-531),
Madura (1998, p. 217), and Fabozzi and Modigliani (2002,
p. 364). “
Richard Cebula & Bill Yang, “Yield to Maturity is Always Received as Promised”, Journal of Economics and Finance Education Volume
7, no. 1 (2008): 43i = Yield = IRR = Required Rate of Return = etc…
i = (FV/PV)^(1/n)-1
INTEREST 1. cost of using money, YIELD TO MATURITY (YTM) concept used to
expressed as a rate per period of time, determine the rate of return an investor will receive if
usually one year, in which case it is called a long-term, interest-bearing investment, such as a
an annual rate of interest. (1) bond, is held to its MATURITY DATE. It takes into
account purchase price, REDEMPTION value, time to
REQUIRED RATE OF RETURN return required by maturity, COUPON yield, and the time between
investors before they will commit money to an interest payments. Recognizing time value of money,
investment at a given level of risk. Unless the it is the DISCOUNT RATE at which the PRESENT VALUE
expected return exceeds the required return, an of all future payments would equal the present price
investment is unacceptable. See also HURDLE of the bond, also known as INTERNAL RATE OF
RATE; INTERNAL RATE OF RETURN; MEAN RETURN. It is implicitly assumed that coupons are
RETURN. (2) reinvested at the YTM rate. YTM can be
approximated using a bond value table (also called a
bond yield table) or can be determined using a
INTERNAL RATE OF RETURN (IRR) discount rate at
programmable calculator equipped for bond
which the present value of the future cash flows of
mathematics calculations. See also DURATION;
an investment equal the cost of the investment.
HORIZON ANALYSIS; YIELD TO AVERAGE LIFE, YIELD
When the net present values of cash outflows (the
TO CALL.
cost of the investment) and cash inflows (returns on
the investment) equal zero, the rate of discount
YIELD TO WORST bond yield assuming worst-case
being used is the IRR. When IRR is greater than the
scenario, that is, earliest redemption possible under
required return-called the hurdle rate in capital
terms of the INDENTURE. See also YIELD TO CALL;
budgeting-the the investment is acceptable. (3)
YIELD TO MATURITY. (4)
1. John Downes;Jordan Elliot Goodman. Dictionary of Finance and Investment Terms (Barron's Financial Guides) (Kindle Locations 4807-4808). Kindle Edition.
2. John Downes;Jordan Elliot Goodman. Dictionary of Finance and Investment Terms (Barron's Financial Guides) (Kindle Locations 8221-8222). Kindle Edition.
3. John Downes;Jordan Elliot Goodman. Dictionary of Finance and Investment Terms (Barron's Financial Guides) (Kindle Locations 4849-4852). Kindle Edition.
4. John Downes;Jordan Elliot Goodman. Dictionary of Finance and Investment Terms (Barron's Financial Guides) (Kindle Locations 11433-11438). Kindle Edition.Strategy Webb Constant Maturity Treasury Yield, Duration & Convexity Calculations
Par Amount: $1,000,000.00 Treasury Yield Curve on 08/31/17
Treasury Maturity (Yrs): 5.00 Maturity Duration Yield Slope(bp) Slope(bp) to 3Mo
Treasury Settlement Date: 08/31/17 0.00 0.00 1.07%
Treasury Maturity Date: 08/31/22 0.25 0.25 1.01%
Coupon Rate: 1.70% 0.50 0.50 1.08% 7.00 7.00
Yield: 1.70% 1.00 0.99 1.23% 15.00 22.00
Price: 100.000 2.00 1.97 1.33% 10.00 32.00
Coupon Frequency: 2.000 3.00 2.93 1.44% 11.00 43.00
Price (Excel): 100.000 5.00 4.77 1.70% 26.00 69.00
Yield (Excel): 1.70% 10.00 8.97 2.12% 42.00 111.00
Modified Duration (Excel): 4.774 30.00 20.39 2.73% 61.00 172.00
Table Calc Price: 100.000 100.042
Table Calc Yield (IRR): 1.700% 1.691%
Table Calc Duration: 4.774 4.773
Table Calc Convexity: 0.2571 0.2570
Present Value @
Present Value @ Maturity Matched
Semi-Annual Periods Cash Flow Maturity Matched
1.70% Yield Discount Rates
Rates
0 (1,000,000.00) (1,000,000.00) 1.07% (1,000,000.00)
1 8,500.00 8,428.36 1.08% 8,454.35
2 8,500.00 8,357.32 1.23% 8,396.41
3 8,500.00 8,286.88 1.28% 8,338.87
4 8,500.00 8,217.04 1.33% 8,277.61
5 8,500.00 8,147.78 1.39% 8,211.70
6 8,500.00 8,079.11 1.44% 8,141.88
7 8,500.00 8,011.02 1.51% 8,065.44
8 8,500.00 7,943.50 1.57% 7,984.57
9 8,500.00 7,876.55 1.64% 7,899.43
10 1,008,500.00 926,652.45 1.70% 926,652.45
Total 1,085,000.00 1,000,000.00 1,000,422.70
Data from ICE, Bloomberg & FRED. Calculations, graphs & analysis by Kevin Webb, CFA.YTM is always received as promised
This note points out that the above-mentioned common treatment
in many textbooks turns out to be a fallacy. The truth is that YTM on
a (coupon) bond is always received regardless of how coupon
payments are re-invested, provided that the bond is held until
maturity without default. It addresses a basic question in bond
theory: between YTM and realized compounding yield (RCY
hereafter), which concept measures the true rate of return from
holding a coupon bond until maturity? It is well accepted that YTM
measures the rate of return from holding a bond until maturity for
both coupon bond and zero-coupon bond as well. By definition, the
YTM received from holding a bond is independent of how coupon
payments are allocated, as long as they are paid on time as
contracted. By comparing the initial investment and the final value
accumulated over the investment horizon, on the other hand, RCY on
a bond measures the rate of return from an account (or trust) that
holds the bond and the interests paid. Of course, it depends on how
coupon payments are reinvested. We demonstrate that the RCY
actually measures the YTM from a combined investment - holding a
coupon bond plus an additional periodic investment with each
coupon payment received. Not surprisingly, YTM and RCY would be
normally unequal; RCY equals YTM if and only if coupon payments
are reinvested at the same rate as the initial YTM. However, this
conclusion should not be interpreted as “the yield to maturity is
actually received only if coupon payments are reinvested at the yield
to maturity”.
Richard Cebula & Bill Yang, “Yield to Maturity is Always Received as Promised”, Journal of Economics and Finance Education Volume
7, no. 1 (2008): 43Benchmark Practical Applications - Return
Agenda
Assumptions/Definitions
Return: Forecasting
Return: Book Yield / Total Return
Return: Gain/Loss
Return: Weighted Equivalent Bond BenchmarksStrategy Webb Toolkit: Paper Gains/(Losses) Vanish as Time Passes
Settlement: 8/31/2019 Time Heals All Wounds
Maturity: 8/31/2024 Price Rates Rise Price Rates Fall
Par Amount: 1,000,000.00 0.00 95.31 104.95
Price: 100.000 6.00 95.76 104.46
Coupon: 1.39% 12.00 96.21 103.97
Payment Frequency: 2 18.00 96.66 103.47
Yield(Excel): 1.39% 24.00 97.12 102.98
Duration (Excel): 4.814 30.00 97.59 102.49
Yield Move (+/-): 1.00% 36.00 98.06 101.99
Assume rates rise or fall by the amount of 42.00 98.54 101.49
the Yield Move (+/-) and see how time 48.00 99.02 101.00
heals all wounds. 54.00 99.51 100.50
59.00 99.91 100.08
106
Price Rates Rise Price Rates Fall
104
102
Price
100
98
96
94
0 10 20 30 40 50 60 70
Months Gone by Since Purchase
Data from ICE, Bloomberg & FRED. Calculations, graphs & analysis by Kevin Webb, CFA.Interest Rate Changes & Gain/Losses (c)
Book Value New
Gain/LossMkt(t) - Gain/LossMkt(t) - Yield Change
Month Book Value Market Value ChangeBook(t) - Discount
Book(t) Mkt(t-1) (bp)
Book(t-1) Rate
0.00 987,607.67 987,607.67 0.00 0.00 1.76%
6.00 988,798.62 941,334.84 1,190.95 (47,463.78) (46,272.83) 114.00 2.90%
12.00 990,000.05 948,940.12 1,201.43 (41,059.93) 7,605.28 (4.00) 2.86%
18.00 991,212.05 953,079.85 1,212.00 (38,132.20) 4,139.73 6.00 2.92%
24.00 992,434.71 935,095.54 1,222.67 (57,339.17) (17,984.30) 89.00 3.81%
30.00 993,668.14 955,754.73 1,233.43 (37,913.41) 20,659.18 (45.00) 3.36%
36.00 994,912.42 974,314.99 1,244.28 (20,597.43) 18,560.26 (53.00) 2.83%
42.00 996,167.65 976,009.63 1,255.23 (20,158.01) 1,694.64 32.00 3.15%
48.00 997,433.92 985,234.17 1,266.28 (12,199.75) 9,224.54 (14.00) 3.01%
54.00 998,711.34 999,305.69 1,277.42 594.35 14,071.52 (137.00) 1.64%
59.00 999,774.50 1,000,050.82 1,063.16 276.33 745.13 (21.00) 1.43%
Settlement: 12/31/2015 $30,000
Maturity: 12/31/2020
Par Amount: 1,000,000.00 $20,000
Price: 98.761
$10,000
Coupon: 1.50%
Payment Frequency: 2 $0
Yield: 1.76% 0 10 20 30 40 50 60
Modified Duration: 4.792 ($10,000)
Gain/Loss $
Convexity: 0.258
($20,000)
Random Yield Change Range (bp)
High: 150 ($30,000) Book Value Change
Book(t) - Book(t-1)
Low: (150)
($40,000) Gain/Loss
Mkt(t) - Book(t)
Incremental Chng:
($50,000) Gain/Loss
Mkt(t) - Mkt(t-1)
Constant Chng:
($60,000)
($70,000)
Months Since Purchase
Data from ICE, Bloomberg & FRED. Calculations, graphs & analysis by Kevin Webb, CFA.Interest Rate Changes & Gain/Losses (b)
Book Value New
Gain/LossMkt(t) - Gain/LossMkt(t) - Yield Change
Month Book Value Market Value ChangeBook(t) - Discount
Book(t) Mkt(t-1) (bp)
Book(t-1) Rate
0.00 987,607.67 987,607.67 0.00 0.00 1.76%
6.00 988,798.62 967,654.87 1,190.95 (21,143.74) (19,952.80) 50.00 2.26%
12.00 990,000.05 952,591.16 1,201.43 (37,408.89) (15,063.72) 50.00 2.76%
18.00 991,212.05 942,227.65 1,212.00 (48,984.40) (10,363.51) 50.00 3.26%
24.00 992,434.71 936,446.70 1,222.67 (55,988.01) (5,780.95) 50.00 3.76%
30.00 993,668.14 935,198.96 1,233.43 (58,469.18) (1,247.74) 50.00 4.26%
36.00 994,912.42 938,502.15 1,244.28 (56,410.27) 3,303.19 50.00 4.76%
42.00 996,167.65 946,441.55 1,255.23 (49,726.10) 7,939.40 50.00 5.26%
48.00 997,433.92 959,172.11 1,266.28 (38,261.81) 12,730.56 50.00 5.76%
54.00 998,711.34 976,922.33 1,277.42 (21,789.01) 17,750.22 50.00 6.26%
59.00 999,774.50 995,606.21 1,063.16 (4,168.29) 18,683.88 50.00 6.76%
Settlement: 12/31/2015 $30,000 Book Value Change
Maturity: 12/31/2020 Book(t) - Book(t-1)
Gain/Loss
Par Amount: 1,000,000.00 $20,000
Mkt(t) - Book(t)
Price: 98.761 Gain/Loss
$10,000
Coupon: 1.50% Mkt(t) - Mkt(t-1)
Payment Frequency: 2 $0
Yield: 1.76% 0 10 20 30 40 50 60
Modified Duration: 4.792 ($10,000)
Gain/Loss $
Convexity: 0.258
($20,000)
Random Yield Change Range (bp) ($30,000)
High:
Low: ($40,000)
Incremental Chng: 500 ($50,000)
Constant Chng: ($60,000)
($70,000)
Months Since Purchase
Data from ICE, Bloomberg & FRED. Calculations, graphs & analysis by Kevin Webb, CFA.A Gain is Achieved Through Lower Yields
Relative to where yields were at time of purchase
Source: BloombergBenchmark Practical Applications - Return
Agenda
Assumptions/Definitions
Return: Forecasting
Return: Book Yield / Total Return
Return: Gain/Loss
Return: Weighted Equivalent Bond BenchmarksProblems Using Bond Indices as Benchmarks
Bums & Duration
Fixed-income benchmarks embody
a great many complex issues … two
issues: the duration problem and
the “bums” problem. …The duration
problem is the fact that the
duration of the benchmark comes
from issuer preferences and is not
necessarily the duration that a
given investor should hold. The
bums (or deadbeats) problem is
that the biggest debtors (whether
companies, countries, or other
entities) have the largest weights in
the benchmark.
Investment Performance Measurement: Evaluating and Presenting Results (CFA Institute Investment Perspectives) (Kindle Locations
4006-4012). Wiley. Kindle Edition.Don’t let Tactics drive Philosophy
Don’t let Wall Street make you over in their image and likeness…
...investors, who are predominantly concerned with book yield and
risk adjusted book returns, can benefit from performance
benchmarks that also use book accounting.
Because the book accounting performance of an index depends on
the timing and amounts of cash inflows and outflows (and the
particular rules for handling such cash flows) preceding the current
performance month, no two investors will likely have the same
book benchmark even if their underlying index is the same. By its
very nature, a book benchmark must be customized for each
investor to allow him or her to input their historical vector of cash
inflows and outflows (including rules) so as to produce proper book
accounting values in the current month. ...
The benchmark book yield and book income are indications of what
could be achieved if the manager followed a passive strategy. ...
Bruce Phelps, et. al. Quantitative Management of Bond Portfolios. Emphasis added.Don’t let Tactics drive Philosophy
Don’t let Wall Street make you over in their image and likeness…
Bruce Phelps, et. al. Quantitative Management of Bond Portfolios. Emphasis added.Contact Information Kevin Webb, CFA Kevin.Webb@psc.com
Disclaimer
The material contained herein is not a product of any research department of Piper
Jaffray & Co. or any of its affiliates. Nothing herein constitutes a recommendation
of any security or regarding any issuer; nor is it intended to provide information
sufficient to make an investment decision. The information provided is herein not
intended to be and should not be construed as a recommendation or "advice"
within the meaning of Section 15B of the Securities Exchange Act of 1934.

The information contained in this communication has been compiled by Piper
Jaffray & Co. from sources believed to be reliable, but no representation or
warranty, express or implied, is made by Piper Jaffray & Co., its affiliates or any
other person as to its accuracy, completeness or correctness. All opinions and
estimates contained in this communication constitute Piper Jaffray & Co.'s
judgment as of the date of this communication, are subject to change without
notice and are provided in good faith but without legal responsibility. Past
performance is not a guide to future performance, future returns are not
guaranteed, and a loss of original capital may occur.
You can also read