Down with the #Dogefather: Evidence of a Cryptocurrency Responding in Real Time to a Crypto-Tastemaker
←
→
Page content transcription
If your browser does not render page correctly, please read the page content below
Article
Down with the #Dogefather: Evidence of a Cryptocurrency
Responding in Real Time to a Crypto-Tastemaker
Michael Cary

                                          Division of Resource Economics and Management, West Virginia University, Morgantown, WV 26506, USA;
                                          macary@mix.wvu.edu

                                          Abstract: Recent research in cryptocurrencies has considered the effects of the behavior of indi-
                                          viduals on the price of cryptocurrencies through actions such as social media usage. However,
                                          some celebrities have gone as far as affixing their celebrity to a specific cryptocurrency, becoming a
                                          crypto-tastemaker. One such example occurred in April 2021 when Elon Musk claimed via Twitter
                                          that “SpaceX is going to put a literal Dogecoin on the literal moon”. He later called himself the
                                          “Dogefather” as he announced that he would be hosting Saturday Night Live (SNL) on 8 May 2021.
                                          By performing sentiment analysis on relevant tweets during the time he was hosting SNL, evidence
                                          is found that negative perceptions of Musk’s performance led to a decline in the price of Dogecoin,
                                          which dropped 23.4% during the time Musk was on air. This shows that cryptocurrencies are affected
                                          in real time by the behaviors of crypto-tastemakers.

                                          Keywords: cryptocurrency; crypto-tastemaker; Dogecoin; price dynamics; sentiment analysis

                                   JEL Classification: G41; G10
Citation: Cary, M. Down with the
#Dogefather: Evidence of a
Cryptocurrency Responding in Real
Time to a Crypto-Tastemaker. J. Theor.    1. Introduction
Appl. Electron. Commer. Res. 2021, 16,         The number of cryptocurrencies has grown rapidly over the past decade. With such
2230–2240. https://doi.org/10.3390/
                                          diversity, choosing a specific cryptocurrency to use can be a daunting task, especially for
jtaer16060123
                                          more casual cryptocurrency users. While some users are concerned with price dynamics,
                                          others are concerned with the popularity of the cryptocurrency [1]. In fact, herding behavior
Academic Editor: Arcangelo
                                          in cryptocurrency markets has become a well documented phenomenon in the literature [2],
Castiglione
                                          and even cryptocurrencies such as Bitcoin are traded at least in part due to emotional
                                          cues [3].
Received: 13 August 2021
Accepted: 2 September 2021
                                               Herding behavior occurs in cryptocurrency markets for many different reasons and is
Published: 3 September 2021
                                          commonly observed during periods where higher levels of risk aversion are exhibited [4].
                                          Herding behavior is particularly strong in smaller cryptocurrencies [5]. Such behavior is
Publisher’s Note: MDPI stays neutral
                                          a market inefficiency and can lead to market destabilization, particularly in the case of
with regard to jurisdictional claims in
                                          smaller cryptocurrencies [6]. Combined with the effects of the ongoing COVID-19 global
published maps and institutional affil-   pandemic on cryptocurrency markets, the potential for market destabilization among
iations.                                  smaller cryptocurrencies is only exacerbated [7]. It is important to note, however, that the
                                          choice of empirical framework can potentially impact whether or not evidence of herding
                                          is found [8].
                                               On the other side of this phenomenon are the cryptocurrency tastemakers (crypto-
Copyright: © 2021 by the author.
                                          tastemakers) who attach their notoriety to a particular cryptocurrency, advocating for its
Licensee MDPI, Basel, Switzerland.
                                          growth. There is evidence that social influences can affect cryptocurrencies [9]. How-
This article is an open access article
                                          ever, current research on the impact of crypto-tastemakers is extremely limited, with no
distributed under the terms and           papers looking at the real time effects of the actions of a major celebrity on the price of
conditions of the Creative Commons        a cryptocurrency to which the celebrity has affixed themselves as a crypto-tastemaker.
Attribution (CC BY) license (https://     The literature that does exist considers the impact of social media on cryptocurrencies,
creativecommons.org/licenses/by/          which, while extremely valuable, analyzes the impact of pre-planned, low risk activities
4.0/).                                    such as sending a single Tweet, e.g., the impact of a president’s tweets on Bitcoin [10],

J. Theor. Appl. Electron. Commer. Res. 2021, 16, 2230–2240. https://doi.org/10.3390/jtaer16060123           https://www.mdpi.com/journal/jtaer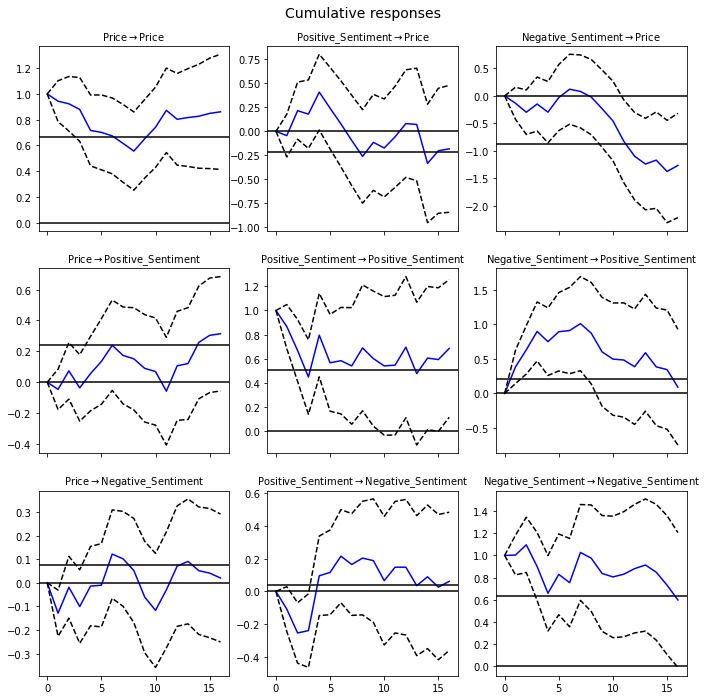
J. Theor. Appl. Electron. Commer. Res. 2021, 16                                                                                    2231

                                       predicting the price of a cryptocurrency using social media data [11,12], and predicting
                                       bubbles in cryptocurrency markets with social media data [13]. This is in contrast to what is
                                       studied in this paper, an extended period of heavily scrutinized, riskier actions performed
                                       live, for a public audience.
                                             One recent example of a celebrity becoming a crypto-tastemaker is Elon Musk, who
                                       affixed his celebrity status to Dogecoin. On 1 April 2021, Elon Musk claimed via Twitter
                                       that “SpaceX is going to put a literal Dogecoin on the literal moon”. Shortly after making
                                       this hyperbolized claim, it was announced that Musk would be hosting the 8 May 2021
                                       episode of Saturday Night Live (SNL). Musk confirmed this in a personal announcement
                                       on his Twitter account on 28 April 2021 in which he called himself the “Dogefather”. All of
                                       these specific examples of Musk’s Twitter activity are part of a much larger corpus of
                                       crypto-tastemaking, dating back to January 2021 when Musk starting giving Dogecoin
                                       attention on Twitter during the GameStop short squeeze [14]. Musk also went on to call
                                       Dogecoin mining “fun” in order to increase the popularity of the cryptocurrency [14].
                                             Elon Musk makes for a great example of a crypto-tastemaker since he has been a public
                                       figure for decades, largely due to his business ventures and immense wealth. Moreover,
                                       during this time he has become a rather divisive figure. He has both an ardent core
                                       of followers and currently has 59.5 million followers on Twitter, but he also has many
                                       detractors as well—a common nickname for Musk (which appears hundreds of time in our
                                       data set) is “Muskrat”. This level of notoriety and divisiveness, along with his longstanding
                                       interest in cryptocurrencies, means that once Musk coupled his name to Dogecoin, he was
                                       indeed a crypto-tastemaker.
                                             In this paper we test for evidence of the real time impact of the highly publicized
                                       actions of a crypto-tastemaker by performing sentiment analysis on real time data from
                                       twitter during the time that Musk was hosting SNL and finding its effect on the price of
                                       Dogecoin. Using standard VAR techniques, we document for the first time in the literature
                                       a definite instance of the price of a cryptocurrency responding in real time to the actions of a
                                       crypto-tastemaker. Specifically, we find that Elon Musk’s performance on SNL significantly
                                       and negatively affected the price of Dogecoin.

                                       2. Dogecoin
                                            Dogecoin is a cryptocurrency alternative to Bitcoin, or an altcoin, that was created in
                                       2013 [15]. Originally created as a joke currency with a randomized reward for mining [14],
                                       for most of its history Dogecoin was a niche cryptocurrency that had some degree of
                                       cultural relevance due to the peculiarity of its name, but was not a target of significant
                                       investment [15]. Prior to 2021, the price of Dogecoin had never been above $0.02 [14]. The
                                       technical development of Dogecoin was also underwhelming, with the most recent consis-
                                       tent activity on its main branch on GitHub as of the writing of Young [15] occurring in 2015
                                       (the rise in popularity experienced by Dogecoin in 2021 has led to renewed development,
                                       per the commit history found at https://github.com/dogecoin accessed on 13 August
                                       2021). However, Dogecoin users have performed some noteworthy, attention grabbing
                                       events including sponsoring an American stock car race in 2013 and the Jamaican bobsled
                                       team in the 2014 Winter Olympics [15].
                                            Functionally, Dogecoin is based on the Scrypt algorithm and is a derivative of Litecoin,
                                       another cryptocurrency derived from Bitcoin [15]. However, unlike Bitcoin and most
                                       other cryptocurrencies, there is no limit to the amount of Dogecoin that can theoretically
                                       exist [15]. Consequentially, mining Dogecoin remains a quicker and easier process than
                                       mining other cryptocurrencies.
                                            From a research perspective, Dogecoin remains essentially unstudied in the literature.
                                       This is likely due to its effective irrelevance as a potential investment prior to 2021. In fact,
                                       in the case of this paper, Dogecoin is studied not for anything intrinsic to Dogecoin itself,
                                       but rather for the fact that a crypto-tastemaker affixed themselves to Dogecoin.
J. Theor. Appl. Electron. Commer. Res. 2021, 16 2232
3. Data and Methodology
The ultimate goal of this paper is to test whether the price of Dogecoin responded in
real time to the public perception of Musk’s performance on SNL using a standard vector
autoregression (VAR) approach. To do this, we need data on the price of Dogecoin as well
as a measure of the public perception of Musk’s performance. While the former data set
is easily obtained, in this case from CoinDesk.com, the latter data requires some effort to
obtain. Twitter is an excellent source of public opinions and tweets are widely used in the
quantitative social sciences, e.g., [16–19], thus we will use data collected from Twitter as
the basis for measuring public opinion of Musk’s performance.
To create the final data on the public’s perception of Musk’s performance, two primary
steps were performed. First, relevant tweets from the time period of Musk’s performance
must be collected from Twitter. A window of one hour before and after the event was in-
cluded in our sample to account for delayed responses since there was no a prioi knowledge
of the lag time from trade-causing-opinion to the trade itself. Tweets containing any of the
following key words as text, hashtags, and/or cashtags were collected: {SNL, SNLmay8,
Dogefather, tothemoon, Elon, Musk, Dogecoinrise, Doge, Dogecoin}. Once these tweets
were collected, sentiment analysis was performed on the tweets.
Sentiment analysis is a form of textual analysis which assigns quantitative values to
subjective statements [20]. Positive values are assigned to tweets with a positive opinion,
and negative values are assigned to tweets with a negative opinion. In our case, whenever
Musk’s performance was well received by the public we obtain positive scores from senti-
ment analysis, while poorly received portions of Musk’s performance received negative
scores from sentiment analysis. To obtain these scores, individual tweets were assigned
their own, unique score using the nltk module in Python.
Once every tweet had been assigned a score via sentiment analysis, two time series
measuring the overall public perception of the performance were created—one for positive
opinions and one for negative opinions—by aggregating the tweets during each minute of
the performance. The rationale for the two distinct times series is that positive and negative
opinions may have asymmetric affects on the price of Dogecoin. Asymmetric effects in
time series regressions have proven significant in many cases, e.g., [21–24]. In our case,
risk averse investors/users of Dogecoin may sell their holdings if they fear that a poor
performance by Musk is actively lowering the price of Dogecoin, but positive opinions of
Musk’s performance may have a more muted positive effect. Furthermore, by aggregating
all tweets during each minute of the event, we allow for a weighted time series where
larger magnitudes for the positive and negative sentiment analysis scores indicate a greater
degree of public consensus regarding the performance. The granularity of one minute
intervals was chosen because this matches the frequency of the price data for Dogecoin
obtained from CoinDesk.com. Summary statistics of the three time series are presented in
Table 1 and the three times series are plotted together in Figure 1.
Table 1. Summary statistics of the three time series. The negative sentiment scores are in absolute
value for convenience of use/interpretation.
Time Series Mean SD Min Max
Price of Dogecoin in USD 0.584 0.054 0.471 0.700
Total Positive Sentiment 29.67 37.58 4.79 188.35
Total Negative Sentiment 25.23 30.75 2.73 99.53
As can be seen in Figure 1, the general trends of positive and negative sentiment were
similar. Twitter activity pertaining to Musk’s performance spiked just as the episode began
to air, reaching a peak around 15 min into the episode. From there, a steady decline in both
positive and negative sentiment, driven by a decrease in the volume of tweets pertaining to
Musk’s performance, was observed. A small spike in both positive and negative sentiment
occurs shortly after the conclusion of the episode, likely driven by summary reviews of theJ. Theor. Appl. Electron. Commer. Res. 2021, 16 2233
episode, but once the episode had finished airing, the volume of tweets steadily declined
to pre-episode levels. The sharp, early decline in the price of Dogecoin, a loss which was
never recouped, coincides with the outburst of opinions on Twitter pertaining to Musk’s
performance on SNL.
A Comparison of the price of dogecoin and public perception of Musk's performance
Price of dogecoin
Positive Sentiment
Negative Sentiment
0.7 175
0.6 150
0.5 125
Aggregate Sentiment
0.4 100
USD
0.3 75
0.2 50
0.1 25
0.0
0
−50 0 50 100 150
Time (Minutes Relative to Start of Episode)
Figure 1. The three time series. The price of Dogecoin is measured in USD on the left hand axis while
the positive and negative sentiment scores are measured in aggregate values on the right hand axis.
The x axis represents time relative to the start of the episode, and the two vertical black lines denote
the start and end of the episode.
Finally, to run the VAR, we first-difference the data to transform the times series and
ensure that they are stationary. As can be seen in Figure 1, the original time series are clearly
non-stationary. Augmented Dickey-Fuller tests confirmed that the three first-differenced
time series are indeed stationary. Once the time series were first-differenced, the optimal
lag length for VAR was determined to be 15 periods (minutes). Once the optimal lag length
was determined, VAR was performed. The VAR model takes the standard specification in
vector notation found in Equation (1) where p = 15 is the optimal lag length.
p
Yt = a + ∑ Φk Yt−k + et (1)
k =1
4. Results and Discussion
Predicting the price of cryptocurrencies, even established ones such as Bitcoin, is no
easy feat. From a pure predictive standpoint, myriad machine learning techniques have
been applied to this problem with only limited success [25]. Data from social media have
been used to aid in this endeavor in various forms including search trends data [26] and
sentiment analysis performed on developers comments [27]. However, these types of
studies have historically relied on discrete events such as tweets by a crypto-tastemaker,
or have used more continuous data from groups of people rather than from individual
crypto-tastemakers. This rule extends to causal inference settings as well, e.g., [28].
The VAR results indicate that increases in the magnitude of negative public perception
of Musk’s performance had a negative effect on the price of Dogecoin. This can be seen
in the upper-rightmost subplot in the cumulative effects plot from our VAR in Figure 2.J. Theor. Appl. Electron. Commer. Res. 2021, 16 2234
Changes in the positive public perception of Musk’s performance had no significant long
run effect on the price of Dogecoin. Full VAR results can be found in Tables A1–A3,
along with the corresponding impulse response function plots and autocorrelation plots in
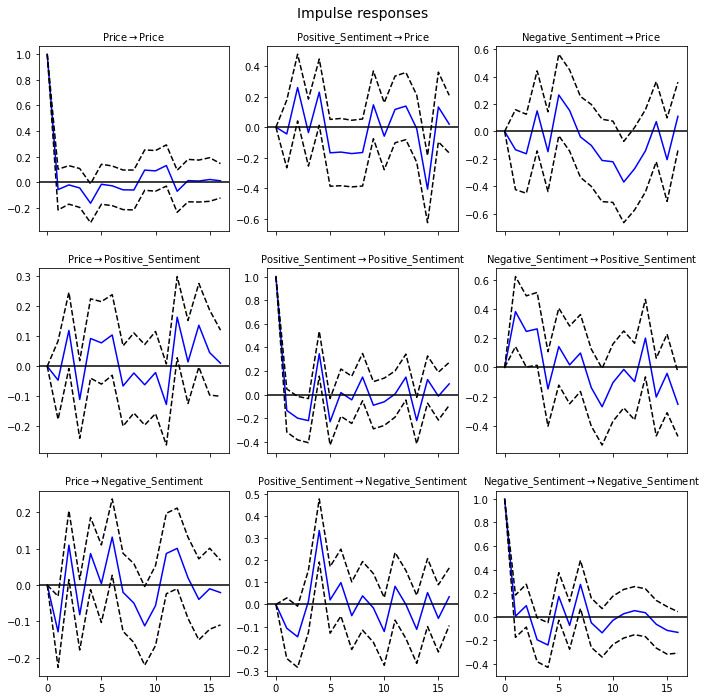
Figures A1 and A2, respectively.
Figure 2. Cumulative effects plots from VAR.
Looking at the impulse response functions, we see that negative sentiment had a
delayed but significant effect on the price of Dogecoin. There was a steady decline in the
impulse response function from 5 min to 12 min, and this effect can also be seen in the
point estimates from the VAR model for the price of Dogecoin, where the lagged values of
negative sentiment for 11 and 12 lags (L11 Negative Sentiment and L12 Negative Sentiment)
were negative and statistically significant (Table A1). What this shows is evidence that
increases in negative sentiment led to Dogecoin users selling their holdings. Trades began
to be finalized in earnest approximately five minutes after an event occurred that led to
an increase in negative sentiment, and this behavior continued until the cumulative effect
of these sales led to a statistically significant decrease in the price of Dogecoin, occurring
approximately at the 12 min mark.
These results indicate that investors/users of cryptocurrencies who are interested in
the popularity of the cryptocurrency are influenced by the actions of crypto-tastemakers,
but that crypto-tastemakers, once thoroughly affixed to a specific cryptocurrency, may only
be able to harm the popularity of the coin. Given the fact that this is the first such study,
it is possible that a “better performance” (perhaps, e.g., a humanitarian action involving
a crypto-tastemaker or a more convincing performance on SNL) could have a positive
effect on the price of that cryptocurrency. However, it is entirely possible that when a
crypto-tastemaker affixes themselves to a cryptocurrency, that cryptocurrency enters a high
risk, low reward state.
This is different than some previous, related results on cryptocurrencies, such as [29]
who found that Bitcoin responded positively to unscheduled news, whether that news was
positive or negative. However, our results do align with [30] who found that certain newsJ. Theor. Appl. Electron. Commer. Res. 2021, 16 2235
from authorities led to declines and increased volatility in cryptocurrency markets in the
largest cryptocurrency exchange in China.
Granger causality testing confirms that changes in the level of aggregate negative
sentiment Granger-causes changes in the level of the price of Dogecoin, but no other
instances of Granger causality exist in this study.
Finally, a stability analysis shows that the results are indeed stable. The roots of the
characteristic polynomial of the VAR are presented in Figure A3 and are clearly all within
the unit circle, a sufficient condition for stability.
5. Conclusions
Cryptocurrencies are used in part based on their popularity; this much is an observed
reality of cryptocurrencies. Consequentially, cryptocurrencies are being endorsed by crypto-
tastemakers. This analysis has shown for the first time that cryptocurrency price dynamics
are subject to the real time behaviors of a crypto-tastemaker. Since less mature cryptocurren-
cies are more likely to be influenced by a crypto-tastemaker, this suggests that less mature
cryptocurrencies may have a more complex nature to their price variance. Future research
on the relationship between cryptocurrencies and crypto-tastemakers should investigate
the direct impact of crypto-tastemakers on the volatility of cryptocurrencies, and if there
are spillover effects across cryptocurrencies due to the action of crypto-tastemakers.
Funding: This research received no external funding.
Data Availability Statement: Final data for the econometric analyses and code for this project is
available at: https://github.com/cat-astrophic/dogefather accessed on 13 August 2021. The raw
twitter data set is not stored in the repository due to its size, but it is available from the author
upon request.
Conflicts of Interest: The authors declare no conflict of interest.
Appendix A. VAR Results
Figure A1. The impulse response function plots from the VAR.J. Theor. Appl. Electron. Commer. Res. 2021, 16 2236
Table A1. VAR results for the regressions on the price of Dogecoin. Optimal lag length was selected
using a built in function in the VAR submodule of the statsmodels module in Python. Lx before a
variable name denotes that a variable was lagged × times.
Variable Coefficient Std. Err. t-Stat p
Constant −0.0003 0.0007 −0.4481 0.6541
L1 Price −0.0565 0.0811 −0.6970 0.4858
L1 Positive Sentiment −0.0444 0.1131 −0.3924 0.6947
L1 Negative Sentiment −0.1338 0.1489 −0.8985 0.3689
L2 Price −0.0426 0.0767 −0.5554 0.5787
L2 Positive Sentiment 0.2365 0.1108 2.1341 0.0328
L2 Negative Sentiment −0.1537 0.1534 −1.0018 0.3165
L3 Price −0.0364 0.0783 −0.4652 0.6418
L3 Positive Sentiment −0.0358 0.1132 −0.3164 0.7517
L3 Negative Sentiment 0.0680 0.1548 0.4395 0.6603
L4 Price −0.1887 0.0786 −2.3993 0.0164
L4 Positive Sentiment 0.2558 0.1109 2.3064 0.0211
L4 Negative Sentiment −0.1971 0.1614 −1.2208 0.2221
L5 Price −0.0250 0.080 −0.3131 0.7542
L5 Positive Sentiment −0.0253 0.1160 −0.2181 0.8273
L5 Negative Sentiment 0.0061 0.1637 0.0375 0.9701
L6 Price −0.0542 0.0753 −0.7191 0.4721
L6 Positive Sentiment −0.1438 0.1207 −1.1918 0.2334
L6 Negative Sentiment 0.1467 0.1614 0.9093 0.3632
L7 Price −0.0498 0.0778 −0.6396 0.5224
L7 Positive Sentiment −0.0709 0.1213 −0.5844 0.5590
L7 Negative Sentiment −0.0612 0.1615 −0.3789 0.7047
L8 Price −0.1269 0.0761 −1.6678 0.0954
L8 Positive Sentiment −0.1935 0.1207 −1.6028 0.1090
L8 Negative Sentiment −0.0623 0.1615 −0.3859 0.6996
L9 Price 0.0476 0.0766 0.6217 0.5341
L9 Positive Sentiment 0.0915 0.1214 0.7537 0.4510
L9 Negative Sentiment −0.0143 0.1597 −0.0897 0.9285
L10 Price 0.0742 0.0785 0.9449 0.3447
L10 Positive Sentiment −0.1283 0.1166 −1.1002 0.2712
L10 Negative Sentiment −0.2174 0.1576 −1.3795 0.1678
L11 Price 0.0761 0.0786 0.9681 0.3330
L11 Positive Sentiment 0.0118 0.1153 0.1025 0.9183
L11 Negative Sentiment −0.2561 0.1550 −1.6521 0.0985
L12 Price −0.0401 0.0779 −0.5144 0.6069
L12 Positive Sentiment 0.0812 0.1134 0.7165 0.4737
L12 Negative Sentiment −0.2535 0.1523 −1.6641 0.0961
L13 Price 0.0825 0.0797 1.0350 0.3007
L13 Positive Sentiment −0.1346 0.1113 −1.2099 0.2263
L13 Negative Sentiment −0.1352 0.1476 −0.9157 0.3598
L14 Price 0.0305 0.0785 0.3886 0.6976
L14 Positive Sentiment −0.3995 0.1120 −3.5670 0.0004
L14 Negative Sentiment −0.0198 0.1447 −0.1369 0.8911
L15 Price 0.1195 0.0793 1.5071 0.1318
L15 Positive Sentiment 0.1268 0.1178 1.0766 0.2817
L15 Negative Sentiment −0.2441 0.1429 −1.7083 0.0876
Table A2. VAR results for the regressions on aggregate positive sentiment. Optimal lag length
was selected using a built in function in the VAR submodule of the statsmodels module in Python.
Lx before a variable name denotes that a variable was lagged × times.
Variable Coefficient Std. Err. t-Stat p
Constant 0.0002 0.0006 0.4140 0.6789
L1 Price −0.0462 0.0667 −0.6918 0.4891
L1 Positive Sentiment −0.1333 0.0930 −1.4332 0.1518
L1 Negative Sentiment 0.3832 0.1226 3.1268 0.0018
L2 Price 0.1605 0.0631 2.5431 0.0110
L2 Positive Sentiment −0.1773 0.0912 −1.9441 0.0519
L2 Negative Sentiment 0.2909 0.1262 2.3052 0.0212
L3 Price −0.0991 0.0644 −1.5386 0.1239
L3 Positive Sentiment −0.1636 0.0932 −1.7553 0.0792
L3 Negative Sentiment 0.3428 0.1274 2.6913 0.0071J. Theor. Appl. Electron. Commer. Res. 2021, 16 2237
Table A2. Cont.
Variable Coefficient Std. Err. t-Stat p
L4 Price 0.1309 0.0647 2.0233 0.0430
L4 Positive Sentiment 0.2863 0.0913 3.1380 0.0017
L4 Negative Sentiment 0.0617 0.1328 0.4646 0.6422
L5 Price 0.0697 0.0658 1.0597 0.2893
L5 Positive Sentiment −0.2438 0.0954 −2.5543 0.0106
L5 Negative Sentiment 0.1894 0.1347 1.4055 0.1599
L6 Price 0.1146 0.0620 1.8488 0.0645
L6 Positive Sentiment −0.1225 0.0993 −1.2332 0.2175
L6 Negative Sentiment 0.2241 0.1328 1.6881 0.0914
L7 Price −0.0369 0.0640 −0.5758 0.5648
L7 Positive Sentiment −0.1004 0.0998 −1.0062 0.3143
L7 Negative Sentiment 0.1467 0.1329 1.1035 0.2698
L8 Price −0.0459 0.0626 −0.7336 0.4632
L8 Positive Sentiment −0.1302 0.0993 −1.3104 0.1900
L8 Negative Sentiment −0.0109 0.1329 −0.0818 0.9348
L9 Price −0.0835 0.0630 −1.3252 0.1851
L9 Positive Sentiment −0.0479 0.0999 −0.4797 0.6314
L9 Negative Sentiment −0.2419 0.1314 −1.8405 0.0657
L10 Price 0.0016 0.0646 0.0243 0.9806
L10 Positive Sentiment −0.1976 0.0960 −2.0589 0.0395
L10 Negative Sentiment −0.0600 0.1297 −0.4626 0.6437
L11 Price −0.0624 0.0647 −0.9645 0.3348
L11 Positive Sentiment −0.0680 0.0949 −0.7167 0.4735
L11 Negative Sentiment 0.0541 0.1275 0.4241 0.6715
L12 Price 0.1659 0.0641 2.5862 0.0097
L12 Positive Sentiment 0.1125 0.0933 1.2060 0.2278
L12 Negative Sentiment −0.0633 0.1253 −0.5050 0.6136
L13 Price −0.0338 0.0656 −0.5156 0.6061
L13 Positive Sentiment −0.0902 0.0916 −0.9855 0.3244
L13 Negative Sentiment 0.2246 0.1215 1.8485 0.0645
L14 Price 0.1669 0.0646 2.5841 0.0098
L14 Positive Sentiment 0.1857 0.0921 2.0157 0.0438
L14 Negative Sentiment −0.1116 0.1191 −0.9369 0.3488
L15 Price 0.1164 0.0653 1.7831 0.0746
L15 Positive Sentiment 0.0173 0.0969 0.1783 0.8585
L15 Negative Sentiment −0.0698 0.1176 −0.5938 0.5527
Table A3. VAR results for the regressions on aggregate negative sentiment. Optimal lag length
was selected using a built in function in the VAR submodule of the statsmodels module in Python.
Lx before a variable name denotes that a variable was lagged × times.
Variable Coefficient Std. Err. t-Stat p
Constant 0.0001 0.0004 0.2079 0.8353
L1 Price −0.1288 0.0499 −2.5803 0.0099
L1 Positive Sentiment −0.1070 0.0696 −1.5359 0.1246
L1 Negative Sentiment 0.0033 0.0917 0.0365 0.9709
L2 Price 0.0980 0.0472 2.0762 0.0379
L2 Positive Sentiment −0.1651 0.0682 −2.4197 0.0155
L2 Negative Sentiment 0.1167 0.0945 1.2353 0.2167
L3 Price −0.0589 0.0482 −1.2207 0.2222
L3 Positive Sentiment 0.0219 0.0697 0.3143 0.7533
L3 Negative Sentiment −0.1159 0.0953 −1.2163 0.2239
L4 Price 0.0611 0.0484 1.2624 0.2068
L4 Positive Sentiment 0.2521 0.0683 3.6914 0.0002
L4 Negative Sentiment −0.1634 0.0994 −1.6432 0.1003
L5 Price −0.0091 0.0493 −0.1853 0.8530
L5 Positive Sentiment 0.0732 0.0714 1.0247 0.3055
L5 Negative Sentiment 0.0968 0.1008 0.9604 0.3368
L6 Price 0.1543 0.0464 3.3251 0.0009
L6 Positive Sentiment 0.0828 0.0743 1.1142 0.2652
L6 Negative Sentiment −0.0941 0.0994 −0.9472 0.3435
L7 Price −0.0023 0.0479 −0.0489 0.9610
L7 Positive Sentiment 0.0496 0.0747 0.6640 0.5067
L7 Negative Sentiment 0.0919 0.0995 0.9237 0.3557J. Theor. Appl. Electron. Commer. Res. 2021, 16 2238
Table A3. Cont.
Variable Coefficient Std. Err. t-Stat p
L8 Price −0.0279 0.0469 −0.5960 0.5512
L8 Positive Sentiment −0.0365 0.0743 −0.4914 0.6232
L8 Negative Sentiment −0.0170 0.0995 −0.1709 0.8643
L9 Price −0.1617 0.0472 −3.4295 0.0006
L9 Positive Sentiment 0.0526 0.0748 0.7029 0.4821
L9 Negative Sentiment −0.2434 0.0984 −2.4742 0.0134
L10 Price −0.0501 0.0484 −1.0358 0.3003
L10 Positive Sentiment −0.1080 0.0718 −1.5032 0.1328
L10 Negative Sentiment −0.1346 0.0971 −1.3868 0.1655
L11 Price 0.0459 0.0484 0.9478 0.3432
L11 Positive Sentiment 0.0101 0.0710 0.1421 0.8870
L11 Negative Sentiment 0.0189 0.0955 0.1985 0.8427
L12 Price 0.1147 0.0480 2.3908 0.0168
L12 Positive Sentiment 0.0729 0.0698 1.0439 0.2965
L12 Negative Sentiment −0.0868 0.0938 −0.9253 0.3548
L13 Price −0.0609 0.0491 −1.2404 0.2148
L13 Positive Sentiment −0.0424 0.0685 −0.6182 0.5365
L13 Negative Sentiment 0.0477 0.0909 0.5241 0.6002
L14 Price 0.0462 0.0483 0.9568 0.3387
L14 Positive Sentiment 0.1419 0.0690 2.0582 0.0396
L14 Negative Sentiment 0.0179 0.0891 0.2011 0.8406
L15 Price 0.0871 0.0488 1.7832 0.0745
L15 Positive Sentiment −0.1290 0.0725 −1.7775 0.0755
L15 Negative Sentiment −0.0307 0.0880 −0.3485 0.7275
Figure A2. The autocorrelation plots from the VAR.J. Theor. Appl. Electron. Commer. Res. 2021, 16 2239
Roots of the VAR Characteristic Polynomial
1.00
0.75
0.50
0.25
Imaginary
0.00
−0.25
−0.50
−0.75
−1.00
−1.00 −0.75 −0.50 −0.25 0.00 0.25 0.50 0.75 1.00
Real
Figure A3. This plot shows the unit roots from the VAR characteristic polynomial. Since all unit roots
lie inside the unit circle (in red), the VAR process is stable.
References
1. Al Shehhi, A.; Oudah, M.; Aung, Z. Investigating factors behind choosing a cryptocurrency. In Proceedings of the 2014 IEEE
International Conference on Industrial Engineering and Engineering Management, Selangor, Malaysia, 9–12 December 2014;
pp. 1443–1447.
2. Bouri, E.; Gupta, R.; Roubaud, D. Herding behaviour in cryptocurrencies. Financ. Res. Lett. 2019, 29, 216–221. [CrossRef]
3. Ahn, Y.; Kim, D. Emotional trading in the cryptocurrency market. Financ. Res. Lett. 2020, 101912. [CrossRef]
4. Da Gama Silva, P.V.J.; Klotzle, M.C.; Pinto, A.C.F.; Gomes, L.L. Herding behavior and contagion in the cryptocurrency market.
J. Behav. Exp. Financ. 2019, 22, 41–50. [CrossRef]
5. Vidal-Tomás, D.; Ibáñez, A.M.; Farinós, J.E. Herding in the cryptocurrency market: CSSD and CSAD approaches. Financ. Res.
Lett. 2019, 30, 181–186. [CrossRef]
6. Kallinterakis, V.; Wang, Y. Do investors herd in cryptocurrencies–and why? Res. Int. Bus. Financ. 2019, 50, 240–245. [CrossRef]
7. Vidal-Tomás, D. Transitions in the cryptocurrency market during the COVID-19 pandemic: A network analysis. Financ. Res. Lett.
2021, 101981. [CrossRef]
8. Stavroyiannis, S.; Babalos, V. Herding behavior in cryptocurrencies revisited: novel evidence from a TVP model. J. Behav. Exp.
Financ. 2019, 22, 57–63. [CrossRef]
9. Aggarwal, G.; Patel, V.; Varshney, G.; Oostman, K. Understanding the social factors affecting the cryptocurrency market. arXiv
2019, arXiv:1901.06245.
10. Huynh, T.L.D. Does Bitcoin React to Trump’s Tweets? J. Behav. Exp. Financ. 2021, 31, 100546. [CrossRef]
11. Lamon, C.; Nielsen, E.; Redondo, E. Cryptocurrency price prediction using news and social media sentiment. SMU Data Sci. Rev.
2017, 1, 1–22.
12. Philippas, D.; Rjiba, H.; Guesmi, K.; Goutte, S. Media attention and Bitcoin prices. Financ. Res. Lett. 2019, 30, 37–43. [CrossRef]
13. Phillips, R.C.; Gorse, D. Predicting cryptocurrency price bubbles using social media data and epidemic modelling. In Proceedings
of the 2017 IEEE Symposium Series on Computational Intelligence (SSCI), Honolulu, HI, USA, 27 November–1 December 2017;
pp. 1–7.
14. Chohan, U.W. A History of Dogecoin. Discussion Series: Notes on the 21st Century. 2017. Available online: https://ssrn.com/
abstract=3091219 (accessed on 13 August 2021).
15. Young, I. Dogecoin: A Brief Overview & Survey. 2018. Available online: https://ssrn.com/abstract=3306060 (accessed on 13
August 2021).J. Theor. Appl. Electron. Commer. Res. 2021, 16 2240
16. Ante, L. How Elon Musk’s Twitter Activity Moves Cryptocurrency Markets. 2021. Available online: https://ssrn.com/abstract=
3778844 (accessed on 13 August 2021).
17. López, M.; Sicilia, M.; Moyeda-Carabaza, A.A. Creating identification with brand communities on Twitter: The balance between
need for affiliation and need for uniqueness. Internet Res. 2017, 27, 21–51. [CrossRef]
18. Saura, J.R.; Reyes-Menéndez, A.; deMatos, N.; Correia, M.B. Identifying Startups Business Opportunities from UGC on Twitter
Chatting: An Exploratory Analysis. J. Theor. Appl. Electron. Commer. Res. 2021, 16, 1929–1944. [CrossRef]
19. Mohammadi, A.; Hashemi Golpayegani, S.A. SenseTrust: A Sentiment Based Trust Model in Social Network. J. Theor. Appl.
Electron. Commer. Res. 2021, 16, 2031–2050. [CrossRef]
20. Liu, B. Sentiment analysis and subjectivity. Handb. Nat. Lang. Process. 2010, 2, 627–666.
21. Maiti, M.; Vyklyuk, Y.; Vuković, D. Cryptocurrencies chaotic co-movement forecasting with neural networks. Internet Technol.
Lett. 2020, 3, e157. [CrossRef]
22. Maiti, M.; Grubisic, Z.; Vukovic, D.B. Dissecting Tether’s Nonlinear Dynamics during Covid-19. J. Open Innov. Technol. Mark.
Complex. 2020, 6, 161. [CrossRef]
23. Vukovic, D.; Maiti, M.; Grubisic, Z.; Grigorieva, E.M.; Frömmel, M. COVID-19 Pandemic: Is the Crypto Market a Safe Haven?
The Impact of the First Wave. Sustainability 2021, 13, 8578. [CrossRef]
24. Yue, W.; Zhang, S.; Zhang, Q. Asymmetric news effects on cryptocurrency liquidity: An Event study perspective. Financ. Res.
Lett. 2021, 41, 101799. [CrossRef]
25. Ortu, M.; Uras, N.; Conversano, C.; Destefanis, G.; Bartolucci, S. On Technical Trading and Social Media Indicators in
Cryptocurrencies’ Price Classification Through Deep Learning. arXiv 2021, arXiv:2102.08189.
26. Matta, M.; Lunesu, I.; Marchesi, M. Bitcoin Spread Prediction Using Social and Web Search Media. In Proceedings of the UMAP
2015—23rd Conference on User Modeling, Adaptation and Personalization, Dublin, Ireland, 29 June 2015–3 July 2015; pp. 1–10.
27. Bartolucci, S.; Destefanis, G.; Ortu, M.; Uras, N.; Marchesi, M.; Tonelli, R. The Butterfly “Affect”: Impact of development practices
on cryptocurrency prices. EPJ Data Sci. 2020, 9, 21. [CrossRef]
28. Mai, F.; Shan, Z.; Bai, Q.; Wang, X.; Chiang, R.H. How does social media impact Bitcoin value? A test of the silent majority
hypothesis. J. Manag. Inf. Syst. 2018, 35, 19–52. [CrossRef]
29. Rognone, L.; Hyde, S.; Zhang, S.S. News sentiment in the cryptocurrency market: An empirical comparison with Forex. Int. Rev.
Financ. Anal. 2020, 69, 101462. [CrossRef]
30. Zhang, S.; Zhou, X.; Pan, H.; Jia, J. Cryptocurrency, confirmatory bias and news readability–evidence from the largest Chinese
cryptocurrency exchange. Account. Financ. 2019, 58, 1445–1468. [CrossRef]You can also read