Walking Trip Generation and Built Environment: A Comparative Study on Trip Purposes - Munich ...
←
→
Page content transcription
If your browser does not render page correctly, please read the page content below
Munich Personal RePEc Archive

Walking Trip Generation and Built
Environment: A Comparative Study on
Trip Purposes.

Hosseinzadeh, Aryan and Baghbani, Asiye

University of Louisville, Concordia University

16 July 2020

Online at https://mpra.ub.uni-muenchen.de/109025/
MPRA Paper No. 109025, posted 18 Aug 2021 20:11 UTC
WALKING TRIP GENERATION AND BUILT ENVIRONMENT: A
COMPARATIVE STUDY ON TRIP PURPOSES
Aryan Hosseinzadeh1, Asiye Baghbani2
1
 Department of Civil and Environmental Engineering, University of Louisville, W.S. Speed, Louisville, KY, USA
2
 Traffic Research Laboratory, School of Civil Engineering, Iran University of Science and Technology, Tehran, Iran

Received 28 April 2020; accepted 16 July 2020

Abstract: In recent decades, enhancing the share of walking in individuals’ daily trips has become a priority for transportation
policymakers, urban planners and public health researchers as an interdisciplinary area. In this regard, determining influential factors
on walking has become a matter of contention to move toward a sustainable mode of transportation. This study investigates the impact
of the influencing factors on the share of walking in trip generation from/to Traffic Analysis Zones (TAZ) of a city across four trip
purposes. In this study, individuals’ trip information for four trip purposes has been tested in order to detect influencing factors on
walking trip generation based on 112 TAZs for the city of Rasht, Iran. According to the results, density and design are found to be
more influential for produced walking trips and diversity is shown to be more effective for attracted walking trips.

Keywords: walking, built environment, trip generation, transportation network design, population density, land use diversity.

1. Introduction

Switching to walking as a non-motorized mode of transportation could significantly affect the transportation statuses of
cities (Ewing and Cervero, 2010; Southworth, 2005; Hatamzadeh and Hosseinzadeh, 2019; Hosseinzadeh, 2019).
Alongside transportation, numerous benefits of promoting walking as an interdisciplinary research area, including
environment, economy (Talen and Koschinsky, 2013; Habibian et al., 2015) and public health (Braun et al., 2016), have
been focused on in the recent years.
In the past two decades, built environment (BE) has been recognized as a factor that acts as a hidden motivation for
individuals to walk more. Therefore, researchers try to identify the influencing environmental factors on walking.
According to the definition given by Roof and Oleru (2008), the BE is “a human-made space in which people live, work
and recreate on a day-to-day basis” (Roof and Oleru, 2008). To capture the BE, various studies suggest using the three
Ds: transportation network design, land use diversity and population density (Cervero and Kockelman, 1997; Ewing and
Cervero, 2010; Frank et al., 2005). However, destination accessibility and distance to transit were added to the
aforementioned criteria (Ewing and Cervero, 2010).
Although a wide range of studies investigate the relationship between BE and walking, only a few papers elaborate about
how this relationship would be changed if various trip purposes were considered separately. Besides, previous studies
only consider a single index as representative of each criterion, even though there is a wide range of proposed indices in
the literature. Furthermore, most of the studies just consider individuals’ residential zones, so the impact of trip attraction
zones is unclear. Eventually, most of the objective studies were conducted in small zones in cities of developed countries.
The study possesses five major benefits. First, this research identifies the indices that are effective on various trip
purposes. Second, the current study provides an extensive number of indices for each criterion. Therefore, based on the
study trip purposes, this study shows which of the investigated indices are more successful in describing walking trip
generation. Third, both sides of trip generation have been considered to show which side is more successful in describing
walking. Fourth, current research addresses a city of a developing country. Finally, this study has been conducted in the
whole city of Rasht, Iran.
In this study, effective factors on the share of walking trips in four trip purposes based on 112 Rasht TAZs have been
modeled using various indices, which have been introduced in the literature review. Due to the possibility of different
influences of produced and attracted trips, results are reported separately.
The remainder of this paper is organized as follows. The next section provides an overview of the indices of each BE
criterion previously proposed. The third section offers a brief explanation of the method that has been used and provides
overviews of the case study and descriptive statistics. The results and conclusion are the fourth and final section of the
paper.

2. Literature Review

2.1. BE Criteria

Design
Design represents street network characteristics within an area. Quite a few indices have been recommended to
encapsulate the effect of transportation network design on walking (Berrigan et al., 2010; Dill, 2004; Gori et al., 2014;
Schlossberg, 2006, Behbahani et al., 2019a). Data availability and researchers’ preferences are the main determinants of
which indices have been used in previous studies (Frank et al., 2010; Frank et al., 2005; Glazier et al., 2012; Krizek,

1
 Corresponding author: aryan.hosseinzadeh@louisville.edu
2003; Behbahani et al., 2019b). What impeded researchers in previous studies to employ all indices is multicollinearity
among them. Therefore, studies used one index or employed Principal Component Analysis (PCA) in order to combine
several indices and extract one index as their combination (Berrigan et al., 2010). Based on this method, Hatamzadeh et
al. (2017) suggested two combined indices that have resulted from PCA. According to their result, two components were
extracted that were capable of delineating 71.02% of variations of all design indices. The first component consists of
percentages of four-way intersections and connected node ratio (node connectivity). The second component includes the
ratio of minor streets to major streets and street density (link connectivity). For more detailed literature review of indices
see Habibian and Hosseinzadeh (2018).

Diversity
Extent and mixture of different land uses in a neighborhood defines diversity (Ewing and Cervero, 2010). Diversity is
introduced as the most influential BE criteria in the studies of the last two decades (Maghelal and Capp, 2011). In a
longitudinal study, Bentley et al. (2018) certified a positive association between walking and diversity by considering the
changes over the years and variation in individuals’ walking (Bentley et al., 2018).
Various indices are proposed to measure the diversity of land uses. Table 1 shows the definition and determination method
of two common diversity indices in the literature (Habibian and Hosseinzadeh, 2018). Although a large number of studies
have implemented the entropy index, Christian et al. (2011) explored the variation of entropy by considering different
types and categories and conclude that entropy index could greatly change due to slight modification in land use
categorization (Christian et al., 2011). Sugiyama et al. (2019) employed isometric substitution analysis and called the
performance of entropy index under question (Sugiyama et al., 2019). Ewing et al. (2015) conclude that high job-
population balance in a zone resulted in a 15 percent decrease in Vehicle Mile Traveled (VMT) in that zone (Ewing et
al., 2015). Cervero and Duncan (2006), after reconsidering the job population balance, result that the mentioned index is
superior comparing other indices such as entropy (Cervero and Duncan, 2006).

Table 1
Formulation of Two Diversity Indices in the Literature
 Index Formulation Source
 Entropy ∑ =1 log (Frank et al., 2005)
 −
 log
 Pi: Percentage of land use i;
 n: Number of land uses;

 Job-population balance − 0.2 × (Ewing et al., 2015)
 1−| |
 + 0.2 ×
 job: Number of jobs in a specific
 area;
 pop: Number of residents in a
 specific area;

Density
Proportion of the population of a zone to the area of that zone is defined as population density (Frank et al., 2010). This
ratio is generally higher at the Central Business District (CBD) of cities in which it is more appropriate to walk (Dobesova
and Krivka, 2012).

Destination Accessibility
Destination accessibility defines as ease of reaching different destinations. It can be measured by distance to various
destinations or number of destinations around a location (Ewing and Cervero, 2010). Boakye- Dankwa et al. (2019) show
improving access to destinations within a 10-min walk from home may increase walking in both Australia and Hong
Kong case studies (Boakye-Dankwa et al., 2019).

Distance to Transit
Previous studies use various indices to capture distance to transit criteria. Ewing and Cervero use the shortest distance of
an individual's home/workplace to the adjacent public transit stop as representative of this criterion (Ewing and Cervero,
2010). The other indices in the literature are total length of the public transit network per area in a zone, average distance
between stations in a specific zone and number of stations in a zone (Ewing et al., 2015).

2.2. Walking and Trip Purposes

The impact of trip purposes on walking has been investigated in the literature. Yang and Diez-Roux found that walking
distance and duration are largely associated with the trip purpose. In this study, seven trip purposes have been discussed
(Yang and Diez-Roux, 2012). Frank and Pivo (1994) considered two trip purposes, work and shopping, and show the
influencing factors that differ in the resulting models (Frank and Pivo, 1994). Gehrke and Clifton (2017) considered two
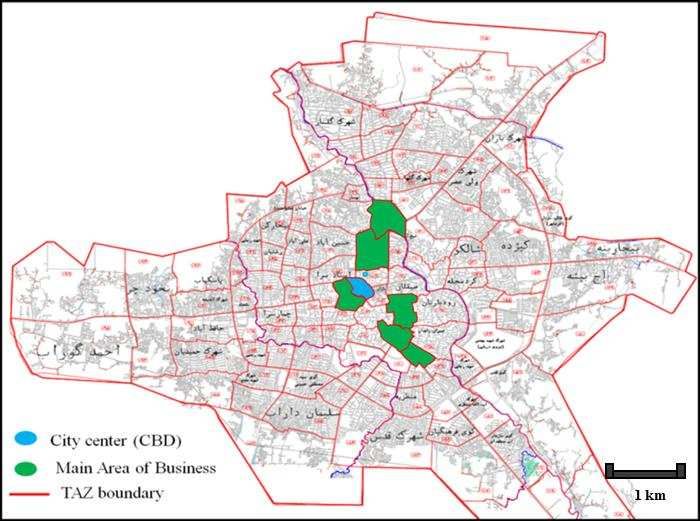
types of trip purposes in their analysis: walking for transportation and discretionary trips. The results of this study reveal
the strong effects of BE in promoting walking in both mentioned trip purposes (Gehrke and Clifton, 2017). Handy (1992)
found that walking for errands is more likely in high-walkable versus low-walkable areas. She also concludes that
utilitarian trips (e.g., shopping) are the sources of difference in the share of walking between areas with low- and high-
walkability (Handy, 1992). For purposes such as exercise, the differences are not discernable (Handy, 1992). In a recent
study in Luxembourg among older adults, Perchoux et al. (2019) conclude that walking distance could be greatly different
based on trip purposes (Perchoux et al., 2019). In summary, although there is a wide range of studies that consider trip
purposes for walking, none of them consider a TAZ-based analysis to investigate influencing factors.
Although an extensive range of indices is introduced in the literature, there is no mutual consent among the researchers
about which of them are most influential. This is because none of the previous studies calculate all the indices in an area
to compare the results on encouraging walking. Besides, there is not much knowledge about which of the indices has a
greater impact on each trip purpose in TAZ-level analyses. Aggregate studies in the scope of a city could provide an apt
ground for decision-makers to take proper action in long-term planning and policymaking.

3. Data

3.1. Area of Study

The city of Rasht (population approximately 640,000 in 2007) is located in the North of Iran. The urban area in Rasht
contains 112 traffic analysis zones (TAZs), which are presented in Figure 1. Unplanned settlements with disordered
pathways, low quality and/or condensed houses and weak infrastructure constitute a major part of the spatial structure in
the city. With the development of the city and limited space of the bazaar, some commercial activities have moved out
from the city center and the traditional bazaar. A poor transit system has made private cars and taxis the most favorable
modes of transportation in daily trips (Azimi, 2005).

Fig. 1.
Traffic Analysis Zones in Rasht

3.2. Data Description

In this study, information from the 2007 Rasht Household Travel Survey (RHTS) is used. As a part of the study, a
questionnaire was designed and distributed among more than 5,000 households across 112 TAZs. The aim of the survey
was to collect detailed information about every trip taken by all members of each participating household. Each person
was asked to fill out a travel diary for a specific day that included the modes of travel, starting and ending time of the trip
and the trip purpose. In addition, household information including the number of vehicles owned by type (e.g., car,
motorcycle, and bicycle) and household size, as well as individual socio-demographic information such as age, gender
and job status were collected (Rasht, 2011).
The data consists of more than 5,000 households, 17,000 individuals and 30,000 trips (5,501 work trips, 4,896 educational
trips, 2,737 shopping trips and 15,355 return-to-home trips). According to RHTS, 97.25% of work trips, 99.42% of
educational trips and 95.35% of shopping trips are home-based, and 62.62% of Rasht residents have service jobs (Rasht,
2011). Comparing the considered trip purposes, the walk-share related to shopping is higher than others; 47% of shopping
trips are walking although the walk-share in all trips is 31%.

3.3. Method

In this study, linear regression analysis is used to model the influencing factors on the share of walking trips. The share
of walking trips in a zone is considered a dependent variable, and socio-demographic characteristics and built environment
criteria are used as independent variables. Thus, the model can be represented in equation 1:
Yi = β1 + β2x2i+ β3x3i+ . . . + ui (1)

Given a data set of n TAZs, a linear regression model assumes that the relationship between the share of walking Yi and
each of the independent variables is linear (equation 1). This relationship is modeled through an error term ui, an
unobserved random variable that adds noise to equation 1.
In developing equation 1, it has assumed the error term has population mean of zero (equation 2), no serial correlation
(equation 3), homoscedasticity of the error term (equation 4), zero covariance between ui and each xi variables (equation
5), no specification bias and no exact collinearity between the x variables. The validity of assumptions has been checked
to ensure no assumptions violations exist.
E (ui | X2i, X3i) = 0 for each i (2)
Cov (ui, uj) = 0 (3)
Var (ui)= σ2 (4)
Cov (ui, X2i) = Cov (ui, X3i) = 0 (5)

The goodness of fit and adjusted goodness of fit for the model resulted from equation 6 and equation 7.

 ̂3 ∑ 3 +
 ̂2 ∑ 2 +
R2= = ∑ 2
 (6)

 ∑ ̂ 2 / ( − )
̅̅̅2̅ = 1-
 (7)
 ∑ 2 / ( −1)

3.4. Analysis

To capture the variation resulted in trip generation, the walk-shares of produced and attracted trips are considered. In
addition, walking trips are considered for four purposes of trips (i.e., work, education, shopping and return-to-home).
Since the length of the trip is not reported in the data, the distance between centroids of the produced and attracted TAZs
is used as trip length. The variables of this study consist of walk-share as a dependent variable, while socio-economic
variables and indices related to each of the BE criteria are treated as independent variables. Descriptive statistics, number
and percentage in each purpose of the trip are presented in Table 2.

Table 2
Number and Percentage of All Trips and Walking Trips in Each Trip Purpose
 Work Education Shopping Return-to-home
 Number of all trips 5501 4896 2737 15355
 Number of walking trips 892 1805 1295 4901
 Walking share (produced and attracted) 16.2 36.9 47.3 31.9
 (Percent)
 Average 16.1 33 41.1 34.1
 Produced
 Standard deviation 10.4 16.8 21.6 16.3
 Average 18 37.5 62.7 28.7
 Attracted
 Standard deviation 13.3 24.4 31.4 11

Socio-demographic variables within each TAZ, including the average age, household size, bike ownership, motorcycle
ownership and car ownership, are calculated. Descriptive statistics of the socio- demographic variables are presented in
the first part of Table 3.
Design indices are calculated based on the GIS database of the transportation network of Rasht, which has been collected
as a part of RHTS. GIS software has been used to calculate indices in 112 TAZs of Rasht. The first part of Table 3 shows
descriptive statistics of the design indices.
Land use diversity variables are calculated based on the Rasht land use database, which was gathered in RHTS. The
second part of Table 3 shows the descriptive statistics of calculated diversity variables.
The population density that has been calculated in each TAZ of Rasht is represented in the third part of Table 3.

Table 3
Zone-based Independent Variables Descriptive Statistics
 Average S.D. Min Max
Part 1- Socio-economic Variables
 1-1 Age average 30.01 2.83 22.33 40.25 -
 1-2 Household size 3.51 0.19 3 4.33 -
 1-3 Average bike ownership 0.66 0.12 0.375 1.008 -
 1-4 Average motor ownership 0.12 0.07 0 0.43 -
 1-5 Average car ownership 0.57 0.24 0.26 0.95 -
 Part 2- Connectivity Indices
 2-1 Intersection density 244.5 134.32 1.24 656.29 1/km2
 2-2 Percentage of 4-way 14.1 6.44 0 38.9 -
 intersections
 2-3 Cal-de-sac density 146.11 91.01 0 407.8 1/km2
 2-4 Number of cal-de-sac 75 62.6 0 363 -
 2-5 Number of 3-way 104 80.6 3 449 -
 2-6 Number of 4-way 15 11.96 0 69 -
 2-7 Ratio of minor streets to major 11.57 25.63 0 187.56 -
 streets
 2-8 Street density 0.017 0.0084 0.004 0.035 m/km2
 2-9 3-way intersection density 210.88 116.92 1.24 535 1/km2
 2-10 4-way intersection density 33.62 23.98 0 121.2 1/km2
 2-11 Connected node ratio 0.62 0.1 0.4 1 -
 2-12 Ratio of links to nodes 1.86 0.2 1.55 2.25 1/m
 2-13 Gamma index 0.39 0.05 0.33 0.63 -
 2-14 Alpha index 0.09 0.059 0.01 0.36 -
 2-15 Percentage of 3-way 85.9 10.32 61.09 100 -
 intersections
 2-16 Number of major 3-way 7.61 7.48 0 49 -
 intersections
 2-17 Number of major 4-way 1.34 1.67 0 11 -
 intersections
 2-18 Ratio of cal-de-sac to nodes 37.01 9.22 0 60 -
 2-19 Major street density 3653.4 2967.5 0 16149.4 m/km2
 2-20 Minor street density 21648 8836.3 610 36898 m/km2
 2-21 Average link length 54.37 24.95 27.2 227.46 m
 2-22 Node connectivity 0.6 0.13 0.32 1.34 -
 2-23 Link connectivity 18.3 26.20 0.03 166.5 -
 Part3-Diversity Indices
 3-1 Entropy index 0.33 0.19 0 0.83 -
 3-2 HHI 0.72 0.18 0.29 1 -
 3-3 MXI 35.8 11.3 1.64 50 -
 3-4 Job-population balance 0.56 0.29 0 1 -
 Part4-Density Index
 4-1 Population density 10100 6600 0 28700 1/km2
 Part5-Destination Accessibility Indices
 5-1 Areal distance to CBD 2629 1712 0 10626 m
 5-2 Network distance to CBD 3334 2318 0 14782 m

4. Results and Discussion

Walking Trip Production
The first part of Table 4 shows percentages of walking in produced trips for considered trip purposes in Rasht, which
reports effective variables and significance levels. In Table 4, population density positively affects the walk-share among
all trip purposes. A wide range of studies found the positive impact of higher population density on walking (Frank et al.,
2010; Frank et al., 2005; Hong et al., 2014). Population density is also important in the produced return- to-home trips.

Table 4
Produced and Attracted Trip Models for Each Trip Purpose
 Work Educational Shopping Return-to-Home
 Constant 0.12*** 0.259** 0.215*** 0.101***
 Produ
 ced

 Population density 0.000293** 0.000622** 0.0001093*** 0.000288*
 Link connectivity - 0.42** 0.66*** -
Job-population balance - - 0.129** 0.362***
 Ratio of minor to major streets 0.00066*** - - -
 R2 0.066 0.173 0.396 0.479
 Adj-R2 0.049 0.158 0.380 0.470
 Constant 0.054*** 0.232*** 0.228*** 0.255***
 Population density 0.000293** - 0.000744*** 0.000699*
 Attracted

 Job-population balance 0.218*** 0.387*** 0.548**
 Average length of links - -0.00147* - -0.00085**
 R2 0.234 0.287 0.338 0.262
 Adj-R2 0.227 0.273 0.326 0.249
Note: ***, ** and * denote a 99%, 95% or 90% level of significance, respectively.

Results also show the importance of design indices. Link connectivity, as a design index, is positively effective in
shopping and educational trip models. Higher link connectivity means a denser street network, as well as a higher ratio
of minor to major streets. Since shopping opportunities are more frequent in minor streets, higher values of this index
improve the shopping chance from passing individuals while walking. Thus, a denser street network in minor streets,
which is a significant part of link connectivity, results in denser shopping opportunities. The compound design index, link
connectivity, also increases educational walking trips (Educational trips consist of students between 7 to 18 years old who
go to school and more than 18 years old who attend the university). In major streets, cars with high speeds and wide
streets make crossing difficult for students (Hong et al., 2014). In this case, students are more vulnerable and less
experienced compared to adults. Therefore, the “ratio of minor streets to major streets” can represent the situation
properly. Previous studies in the literature highlight safety concerns of parents in their children’s educational trips
(Boarnet et al., 2005; Buliung et al., 2017; Kerr et al., 2006).
In work trips, a denser street network secures more diverse routes, which provides the possibility of choosing a more
direct or more attractive route. Increasing the ratio of minor streets to major streets enhances safety and, thus, encourages
individuals to do more walking in their work trips. Since cars usually are driven at lower speed on minor streets, citizens
are more likely to walk along them (Jacobsen, 2015). As illustrated in Table 4, the larger ratio of minor streets to major
streets results in a higher percentage of walking in work trips. In the produced trips model, BE factors have been more
successful in describing walking in return-to-home and shopping trips.

4.1. Walking Trip Attraction

The second part of Table 4 shows the influencing factors on walking trip attraction models. In this study, all the diversity
indices have been entered in the model to determine which ones are more successful in describing walking. Results show
the positive impact of diversity indices in work, educational, and shopping trips in the destination zone. The job-
population balance, as a diversity index, means more balance between residents and available jobs in a zone. For instance,
in work trips, residential land uses adjacent to zones with existing job opportunities increases the possibility of working
near the residential location. As a result, more walking to work takes place due to the short distance between workplace
and home (Ewing et al., 2015). Although each of the diversity indices mentioned in Part 3 of Table 3 were tested in the
model, the job-population balance was the only one found to be significant. This result is different from most previous
studies, in which the entropy index is considered as a proxy of diversity (Badland et al., 2009; Frank et al., 2010; Frank
et al., 2005; Talen and Koschinsky, 2013). However, another study casts doubt about the sufficiency of the entropy index
because it assumes equal weight for all land uses (Christian et al., 2011).
The average length of streets in the street network shows the distance between nodes in the network, which has been
found to be influential in educational and return-to-home trips. Negative values of the coefficients mean individuals do
not have a tendency to reach destinations by taking long roads. In fact, shorter roads indicate the possibility to choose a
more efficient route to reach a destination and prevent people from walking along lengthy and boring streets. Additionally,
drivers must reduce their speed before reaching intersections on short roads. It seems that the index is more influential in
educational attracted trips because students are less experienced in interacting with cars, so streets with lower traveling
speed are more suitable for students to walk (Kerr et al., 2006).
The impact of population density on job trips is the lowest among all trip purposes, which is aligned with findings of
Ramezani et al. (2018) (Ramezani et al., 2018). Moreover, in the modeling of work trips, attraction model is more
successful than produced model. This finding is in accordance with the recent study that highlights the importance of
workplace surroundings (Adams et al., 2016).

5. Conclusion

In this study, effective indices on walking trip generation are investigated. Five different factors from all those calculated
were found to be significant in all eight models.
Density and design demonstrated a positive effect on walking to work, educational- and shopping-produced and return-
to-home attracted trips. These findings reveal that density and design were more important around peoples’ residences.
Comparing all the significant variables in the walk-share of trip generations, the population density index was found to
be influential in seven out of eight models. Design indices (i.e., average length of links, ratio of minor roads to major
roads and link connectivity) have been significant in five out of the eight models, four of which are in individuals’
residential TAZs. This finding is aligned with the previous studies that consider these criteria in a buffer around the homes
of the participants in the surveys (Cao, 2014; Frank et al., 2005; Lamíquiz and López-Domínguez, 2015; Talen and
Koschinsky, 2013)
Job-population balance, a diversity index, has been found significant in five out of the eight total models. Diversity was
found to be important in the destination, not including the individuals’ places of residence. This is in contrast with studies
in the literature that assumed that diversity was important around peoples’ homes (Frank et al., 2005; Talen and
Koschinsky, 2013). In addition, among all diversity indices, the job-population balance was found to be significant in the
city of Rasht, while most parts of the literature suggest using the entropy index as a proxy of diversity (Talen and
Koschinsky, 2013).
According to the reported goodness of fit in the walk-share trip generation, shopping and return-to-home trips had the
highest goodness of fit. In work and educational trips, people need to be at their destinations at a certain time. Faster
modes of transportation are preferred and BE characteristics may not affect them. However, in shopping and return-to-
home trips, people have more time, so it is more probable that environmental characteristics have an impact on walking.
Some limitations are important to point out. First, the major way of commuting is reported by individuals, rather than the
details of their trip chains. Furthermore, there is information about individuals’ production and attraction TAZs, not the
exact routes of their trips. If the exact route was given, all the TAZs involved in the trip could be included in the analysis.
Although a wide range of indices are calculated, there are some others that could help to reach more profound results:
density of bus stops, pedestrian catchment area, block density and pedestrian route directness. In addition, various path
attributes such as slope, adjacent traffic volumes and presence/width of sidewalks have not been calculated in this study,
which could be helpful in reflecting on some key factors influencing walking for various trip purposes.

References

Abdoli, N., & Hosseinzadeh, A. (2021). Assessing Spatial Equity of Public Transit Demand amid COVID-19.
In International Conference on Transportation and Development 2021 (pp. 513-520).

Adams, E. J., Bull, F. C., & Foster, C. E. (2016). Are perceptions of the environment in the workplace
‘neighbourhood’associated with commuter walking?. Journal of Transport & Health, 3(4), 479-484.

Ahmed, T., Hyland, M., Sarma, N. J., Mitra, S., & Ghaffar, A. (2020). Quantifying the employment accessibility benefits
of shared automated vehicle mobility services: Consumer welfare approach using logsums. Transportation Research Part
A: Policy and Practice, 141, 221-247.

Azimi, N. (2005). Restructuring Urban Morphology: ACase study of Rasht, Iran.

Badland, H. M., Schofield, G. M., Witten, K., Schluter, P. J., Mavoa, S., Kearns, R. A., ... & McPhee, J. (2009).
Understanding the Relationship between Activity and Neighbourhoods (URBAN) Study: research design and
methodology. BMC Public Health, 9(1), 1-11.

Behbahani, H., Nazari, S., Kang, M. J., & Litman, T. (2019). A conceptual framework to formulate transportation network
design problem considering social equity criteria. Transportation research part A: policy and practice, 125, 171-183.

Behbahani, H., Nazari, S., Partovifar, H., & Kang, M. J. (2019). Designing a road network using John Rawls’s social
justice approach. Journal of Urban Planning and Development, 145(2), 05019002.

Bentley, R., Blakely, T., Kavanagh, A., Aitken, Z., King, T., McElwee, P., ... & Turrell, G. (2018). A longitudinal study
examining changes in street connectivity, land use, and density of dwellings and walking for transport in Brisbane,
Australia. Environmental health perspectives, 126(5), 057003.

Berrigan, D., Pickle, L. W., & Dill, J. (2010). Associations between street connectivity and active
transportation. International journal of health geographics, 9(1), 1-18.

Boakye-Dankwa, E., Nathan, A., Barnett, A., Busija, L., Lee, R. S., Pachana, N., ... & Cerin, E. (2019). Walking behaviour
and patterns of perceived access to neighbourhood destinations in older adults from a low-density (Brisbane, Australia)
and an ultra-dense city (Hong Kong, China). Cities, 84, 23-33.

Cervero, R., & Duncan, M. (2006). 'Which reduces vehicle travel more: jobs-housing balance or retail-housing
mixing?. Journal of the American planning association, 72(4), 475-490.
Dobesova, Z., & Krivka, T. (2012). Walkability index in the urban planning: A case study in Olomouc city. Advances in
spatial planning, 179-196.

Ghaffar, A., Mitra, S., & Hyland, M. (2020). Modeling determinants of ridesourcing usage: A census tract-level analysis
of Chicago. Transportation Research Part C: Emerging Technologies, 119, 102769.

Gehrke, S. R., & Clifton, K. J. (2017). A pathway linking smart growth neighborhoods to home-based pedestrian
travel. Travel Behaviour and Society, 7, 52-62.

Habibian, M., Avaz, Z., & Hosseinzadeh, A. (2015). Sociological study of influence of citizen’s traffic ethics on driving
violations: case study of Tehran, Iran (No. 15-6029).

Habibian, M., & Hosseinzadeh, A. (2018). Walkability index across trip purposes. Sustainable cities and society, 42, 216-
225.

Haghani, M., Jalalkamali, R., & Berangi, M. (2019, October). Assigning crashes to road segments in developing countries.
In Proceedings of the Institution of Civil Engineers-Transport (Vol. 172, No. 5, pp. 299-307). Thomas Telford Ltd.

Hatamzadeh, Y., & Hoseinzadeh, A. (2020). Toward a deeper understanding of elderly walking for transport: An analysis
across genders in a case study of Iran. Journal of Transport & Health, 19, 100949.

Hosseinzadeh, A. (2019). Built environment and walking: short vs. long walking trips. arXiv preprint arXiv:2001.00640.

Hosseinzadeh, A., Algomaiah, M., Kluger, R., & Li, Z. (2021). Spatial analysis of shared e-scooter trips. Journal of
transport geography, 92, 103016.

Hosseinzadeh, A., Algomaiah, M., Kluger, R., & Li, Z. (2021). E-scooters and sustainability: Investigating the
relationship between the density of E-scooter trips and characteristics of sustainable urban development. Sustainable
cities and society, 66, 102624.

Hosseinzadeh, A., Moeinaddini, A., & Ghasemzadeh, A. (2021). Investigating factors affecting severity of large truck-
involved crashes: Comparison of the SVM and random parameter logit model. Journal of safety research.

Hosseinzadeh, A., Karimpour, A., Kluger, R., & Orthober, R. (2020). A framework to link crashes to emergency medical
service runs and trauma admissions: for improved highway safety monitoring and crash outcome assessment.
In Transportation Research Board. 99th Annual Meeting Transportation Research Board.

Hosseinzadeh, A. (2021). What affects how far individuals walk?. SN Applied Sciences, 3(3), 1-10.

Hosseinzadeh, A., & Kluger, R. (2021). Do EMS times associate with injury severity?. Accident Analysis &
Prevention, 153, 106053.

Hosseinzadeh, A., & Kluger, R. Data Linkage for Traffic Safety in Jefferson County, Kentucky. In International
Conference on Transportation and Development 2021 (pp. 243-250).

Hosseinzadeh, A., & Kluger, R. Analyzing the Impact of COVID-19 Pandemic on Micromobility Transportation.
In International Conference on Transportation and Development 2021 (pp. 52-60).

Hosseinzadeh, A., Karimpour, A. and Kluger, R. (2021). Factors Influencing Shared Micromobility Services: An Analysis
of E-Scooters and Bikeshare. Transportation Research Part D: Transport and Environment (In press).

Hosseinzadeh, A., Haghani, M., & Kluger, R. (2021). Exploring Influencing Factors on Crash-related Emergency
Response Time: A Machine Learning Approach (No. TRBAM-21-00614).

Mahdinia, I., Habibian, M., & Shirazian, G. R. (2017). An Index-based Method to Evaluate the Economic Term of
Sustainable Transportation. Journal of Transportation Research, 14(4), 19-31.

Mansourkhaki, A., Berangi, M., Haghiri, M., & Haghani, M. (2018). A neural network noise prediction model for Tehran
urban roads. Journal of Environmental Engineering and Landscape Management, 26(2), 88-97.
Jacobsen, P.L. 2015. Safety in numbers: more walkers and bicyclists, safer walking and bicycling, Injury prevention
21(4): 271-275.
Mohammadi, R., Golroo, A., & Hasani, M. (2018). Effect of traffic information on travel time of medium-distance trips:
A case study in Tehran. Promet-Traffic&Transportation, 30(3), 281-291.

Schlossberg, M. (2006). From TIGER to audit instruments: Measuring neighborhood walkability with street data based
on geographic information systems. Transportation Research Record, 1982(1), 48-56.
Schlossberg, M. 2006. From TIGER to audit instruments: Measuring neighborhood walkability with street data based on
geographic information systems, Transportation Research Record 1982(1): 48-56.

Southworth, M. (2005). Designing the walkable city. Journal of urban planning and development, 131(4), 246-257.

Sugiyama, T., Rachele, J. N., Gunn, L. D., Burton, N. W., Brown, W. J., & Turrell, G. (2019). Land use proportion and
walking: Application of isometric substitution analysis. Health & place, 57, 352-357.

Talen, E., & Koschinsky, J. (2013). The walkable neighborhood: A literature review. International journal of sustainable
land use and urban planning, 1(1).

Yang, Y., & Diez-Roux, A. V. (2012). Walking distance by trip purpose and population subgroups. American journal of
preventive medicine, 43(1), 11-19.
You can also read