PI World 2020 Lab
Usage-based, Condition-based and Predictive
Maintenance using the PI System
←
→
Page content transcription
If your browser does not render page correctly, please read the page content below

PI World 2020 Lab Usage-based, Condition-based and Predictive Maintenance using the PI System
OSIsoft, LLC
1600 Alvarado Street
San Leandro, CA 94577 USA
Tel: (01) 510-297-5800
Web: http://www.osisoft.com

© 2020 by OSIsoft, LLC. All rights reserved.

No part of this publication may be reproduced, stored in a retrieval system, or transmitted, in any form or
by any means, mechanical, photocopying, recording, or otherwise, without the prior written permission
of OSIsoft, LLC.

OSIsoft, the OSIsoft logo and logotype, Analytics, PI ProcessBook, PI DataLink, ProcessPoint, Asset
Framework (AF), IT Monitor, MCN Health Monitor, PI System, PI ActiveView, PI ACE, PI AlarmView, PI
BatchView, PI Vision, PI Data Services, Event Frames, PI Manual Logger, PI ProfileView, PI
WebParts, ProTRAQ, RLINK, RtAnalytics, RtBaseline, RtPortal, RtPM, RtReports and RtWebParts are all
trademarks of OSIsoft, LLC. All other trademarks or trade names used herein are the property of their
respective owners.

U.S. GOVERNMENT RIGHTS

Use, duplication or disclosure by the U.S. Government is subject to restrictions set forth in the OSIsoft,
LLC license agreement and as provided in DFARS 227.7202, DFARS 252.227-7013, FAR 12.212, FAR
52.227, as applicable. OSIsoft, LLC.

Published: March 30, 2020

Usage-based, Condition-based and Predictive Maintenance using the PI System

Hands-on Lab – OSIsoft PI World 2020

Lead: Gopal GopalKrishnan, P.E., Solutions Architect
Instructor: Nick Pabo-Eulberg, Systems Engineer

                                                                                                              2|Page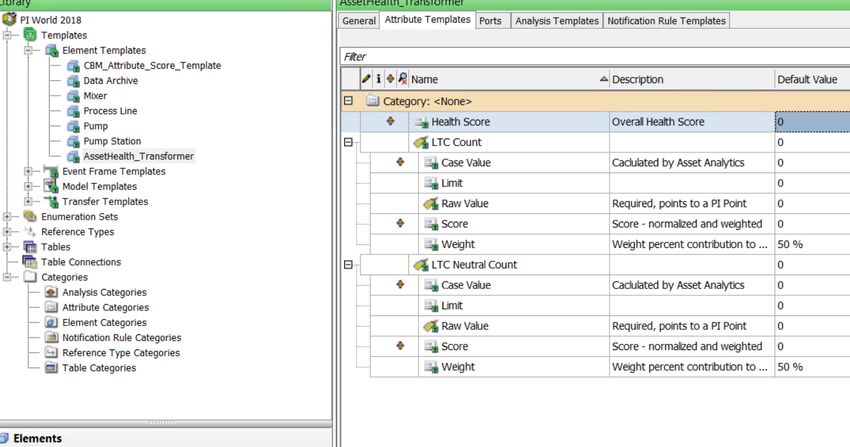
Table of Contents

Table of Contents
Table of Contents .......................................................................................................................................... 3
Usage-based, Condition-based and Predictive Maintenance using the PI System ................................................. 5
Lab Description ............................................................................................................................................. 5
Summary ....................................................................................................................................................... 5
       Exercise 1: Usage-based Maintenance ................................................................................................. 7
       Exercise 2: Condition-based maintenance ............................................................................................ 9
       Exercise 3a: Predictive Maintenance (PdM) – Bearing Vibration ....................................................... 11
       Exercise 3b – Engine failure - CM, PM and PdM (early fault detection via machine learning) .......... 12
   Exercise 4: Multiple condition assessment rules and asset health score ............................................... 12
PI System software...................................................................................................................................... 14
Exercise 1 – Usage-based Maintenance...................................................................................................... 15
   Step 1:        Exploring the Asset Framework structure .............................................................................. 15
   Step 2:        Creating a Status attribute ...................................................................................................... 18
   Step 3:        Creating usage-based run hours attributes ............................................................................ 22
   Step 4:        Creating a usage-based counter (valve actuation) ................................................................. 24
   Step 5:        (Optional) Comparing equipment on their usage-based statistics ......................................... 25
Exercise 2 – Condition-based Maintenance................................................................................................ 31
   Step 1:        Exploring the Asset Framework structure .............................................................................. 31
   Step 2:        Monitoring the bearing temperature ..................................................................................... 33
   Step 3:        Tracking high bearing temperature events............................................................................. 34
   Step 4:        Alerting on high bearing temperature events ........................................................................ 36
   Step 5:        (optional) Sending an email notification on a high bearing temperature alert ...................... 38
   Step 6:        Counting number and duration of bearing temperature alerts ............................................. 39
   Step 7:        (Optional) Adding Pump06 ..................................................................................................... 40
   Step 8:        (Optional) Visualizing counts and watchlist of events ............................................................ 41
   Step 9:        (Optional) Acknowledging and entering reason code for the alerts ...................................... 45
Exercise 3a – Predictive Maintenance (PdM) – Bearing Vibration ............................................................. 46
   Step 1:        Examine the Data .................................................................................................................... 48
   Step 2:        Examine the moving average linear regression calculations in AF Analytics for calculating the
   RUL            50
   Step 3:        Simulating the calculations ..................................................................................................... 51
Exercise 3b – Engine failure - CM, PM and PdM - early fault detection via machine learning ................... 52

3|Page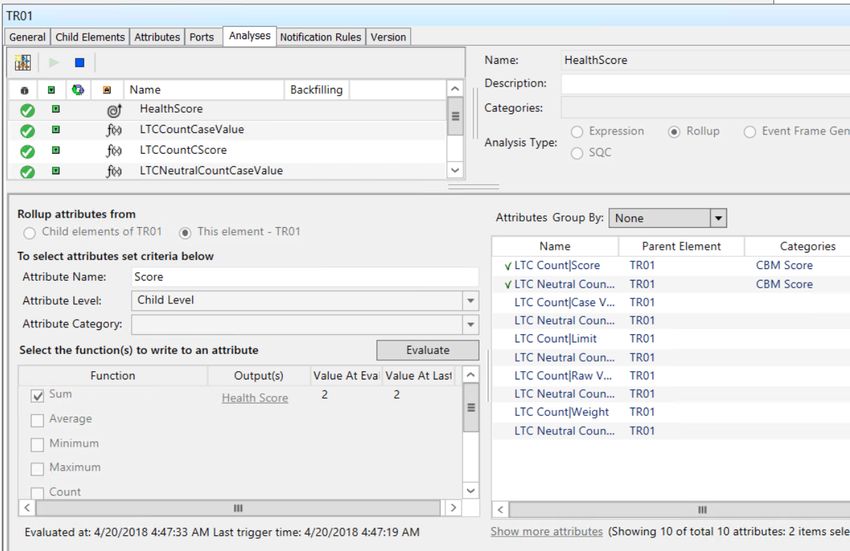
Step 1:     Failure History ......................................................................................................................... 54
   Step 2:     Corrective, preventive and predictive maintenance .............................................................. 57
Exercise 4 – Condition assessment rules and asset health score ............................................................... 58

                                                                                                                                          4|Page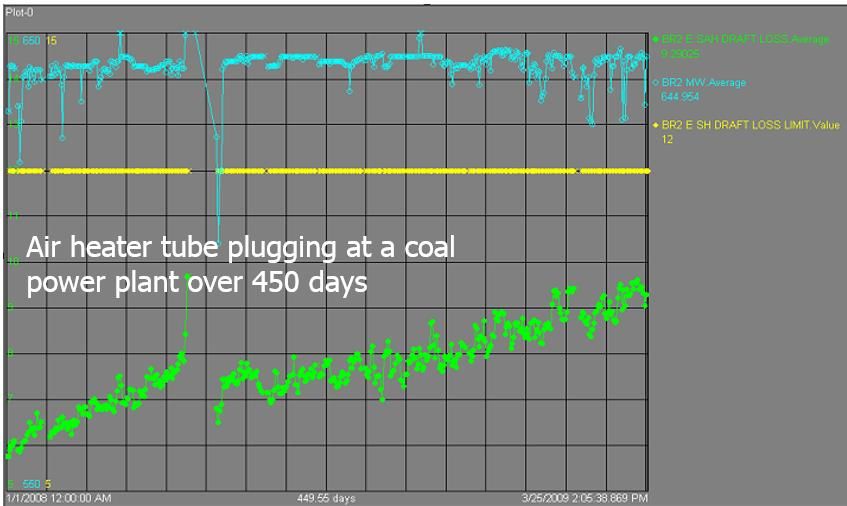
Usage-based, Condition-based and Predictive Maintenance using the PI System

Usage-based, Condition-based and Predictive
Maintenance using the PI System
Lab Description

In this lab, we walk through scenarios to illustrate the use of process data and machine
condition data and a layered approach to maintenance via usage-based, condition-based
and predictive maintenance.

Data sources include traditional plant instrumentation such as PLCs and SCADA, the newer IoT
devices, and from machine condition monitoring such as vibration, oil analysis etc.

Usage-based maintenance includes utilizing operational metrics such as motor run-hours,
compressor starts/stops, grinder tonnage etc. And, condition-based maintenance utilizes
measurements such as filter deltaP, bearing temperature, valve stroke travel, and others.
Predictive maintenance can be using simple analytics such as monitoring vibration (rms, peak
etc.) to predict RUL (remaining useful life), heat-exchanger fouling to schedule cleaning, etc.

In this lab will also discuss predictive maintenance use cases that require advanced analytics,
including machine learning, such as APR (advanced pattern recognition), anomaly detection,
and others.

Who should attend? Experienced PI user

Duration: 3 hours

Summary
Condition-based maintenance (CBM) is a strategy where you monitor the actual condition of an asset to
decide what maintenance needs to be done – see wiki for a broader definition. This contrasts with a
break-fix strategy (reactive or corrective maintenance), and calendar scheduled maintenance (clean and
lube every 3 months, laser align every 6 months etc.) regardless of the condition of the asset and
whether it was used or not.

Increasing equipment uptime means preventing failures before they happen; and in turn, this requires
you to have a list of likely failures and the appropriate measurements and relevant condition monitoring
for the process and equipment/component.

5|Page
This lab’s objective is to walk-through the use of equipment and process data for a layered approach
to uptime and reliability via usage based, condition-based and predictive – simple and advanced
(machine learning) - maintenance.

   ▪   Exercise 1: Usage base maintenance – motor run-hours and valve actuation counts

   ▪   Exercise 2: Condition-based maintenance – bearing temperature high alert

   ▪   Exercise 3a: Predictive maintenance (simple) – univariate (single variable) – increasing bearing
       vibration trend extrapolated to predict time to maintenance

   ▪   Exercise 3b: CM, PM and PdM - Using engine failure history to support the decision criteria and
       quantify the benefits for moving from corrective maintenance (CM) to preventive maintenance
       (PM) to predictive maintenance (PdM)

   ▪   Exercise 4: Asset health score – utilize multiple condition assessment rules with appropriate
       weighting factors to process/equipment indicators to calculate an overall asset health score

                                                                                              6|Page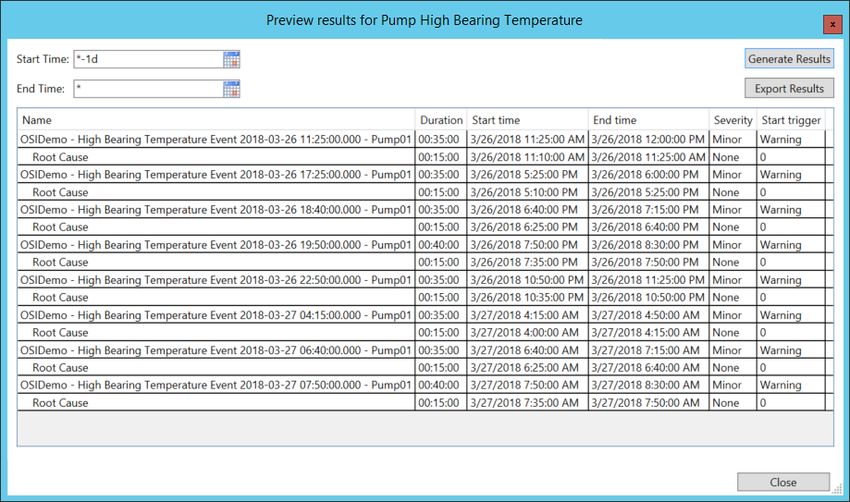
Summary

Exercise 1: Usage-based Maintenance
In this exercise, motor run-hours and valve actuation counts are calculated to serve as a basis for usage-
based maintenance.

We use an ice-cream factory running two process lines – Line 1 and Line 2, with two mixers on each line.

The hands-on portion includes building the run-hours calculations in AF, and the relevant PI Vision
displays as shown below.

7|Page
8|Page
Summary

Exercise 2: Condition-based maintenance
In this exercise, we assess the condition of an equipment by calculating metrics that can serve as leading
indicators of equipment failure or loss of efficiency – for example, bearing temperature to evaluate the
pump bearing condition.

We track the alerts for the bearing temperature and then discuss the use of PI Notification to send an
email or use the web service delivery channel to notify a system (i.e. triggering a work order in a work
management system such as SAP or IBM Maximo) for follow-up action.

The bearing temperature events are viewed in a watchlist in PI Vision – see screens below.

9|Page
10 | P a g e
Summary

Exercise 3a: Predictive Maintenance (PdM) – Bearing Vibration
For certain classes of process equipment, their condition can be evaluated by monitoring some key
metric, such as efficiency for a compressor, fouling for a heat-exchanger, bearing vibration on a pump,
etc. Often, these metrics show a pattern with time – and, linear, piece-wise linear or non-linear trend
can be extrapolated to estimate remaining-useful-life.

The screen below shows increasing vibration over time (100+ days). The trend can be extrapolated to
estimate when it will reach a defined threshold and schedule maintenance.

Another example from a coal power plant air heater is shown below. The green trace (with increasing
Delta P) shows the heater tubes getting increasingly plugged over a period of 450 days. The blue trace
shows a nominal 650 MW production rate whenever the air heater Delta P is calculated. The yellow
trace shows the maximum allowable Delta P i.e. 12 inches of H2O.

Extrapolating the trend (of the green trace) will indicate that you have about 60-90 days before air
heater Delta P reaches the maximum allowable limit and should be scheduled for maintenance.

11 | P a g e
Exercise 3b – Engine failure - CM, PM and PdM (early fault detection via machine learning)
In this Exercise, we will use engine operations data and failure history to guide maintenance decisions,
and quantify the benefits when moving from CM to PM to PdM:
▪ CM - Corrective maintenance - break-fix
▪ PM - Preventive maintenance - run-hours based
▪ PdM - Predictive maintenance - early detection (via machine learning - multi-variate condition
assessment)
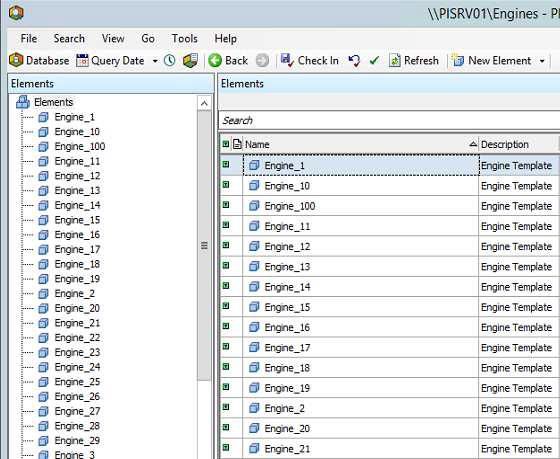
In a deployment with about 100 similar engines, sensor data such as rpm, burner fuel/air ratio, pressure
at fan inlet, and twenty other measurements plus settings for each engine – for a total of about 2000
tags – are available. On average, an engine fails after 206 cycles, but it varies widely - from about 130 to
360 cycles – each cycle is about one hour.
With this given failure history for the engines and known costs for PMs vs. repairs, we calculate the
benefits in moving from CM to PM to PdM.
As part of the lab, we discuss:
▪ Can you quantify the $ spent on maintenance with the break-fix strategy (corrective
maintenance)?
▪ A sister company with similar operations, failure history and repair/PM costs uses the median
failure rate of 199 cycles for PMs. Should you adopt this?
▪ Can you do better? If so, after how many cycles will you do the PMs?
▪ Can you quantify the benefits in moving from corrective to run-hours based PMs?
▪ If engine operations data can be used for early detection of failure – say, within 20 cycles of a
failure with 100% certainty – if and how much will you save by using PdM vs the PM approach
For details of PdM model development, i.e. early fault detection via machine learning for predicting
failure within a window of time, see…more.
Exercise 4: Multiple condition assessment rules and asset health score
In this Exercise, you apply the appropriate condition assessment rules and corresponding weighting
factors to process/equipment measurements to calculate an overall asset health score.
It uses AF Analytics to convert a “Raw Value” (sensor data) to a normalized i.e. a “Case Value”. And then,
by applying a Weight%, it is transformed to a Score.
Each measurement gets a normalized weighted score (0 to 10) by applying a condition assessment rule.
And, then the normalized scores are rolled up to arrive at a composite asset health score. The Weight%
applied to each attribute depends on its contribution to the overall asset health.
The composite asset health score ranges from 0 to 10 (0=Good, 10=Bad)
A Transformer asset health score example is used with the following measurements:
▪ LTC (Load Tap Changer) counter operations
12 | P a g eSummary ▪ LTC through neutral count ▪ DGA (dissolved gas analysis) detectable acetylene ▪ DGA high gas rate of change ▪ Low dielectric ▪ High water ▪ Low nitrogen pressure An example Transformer template is shown below: And, as you configure Transformers using these templates, the composite health score is periodically calculated by PI System Asset Analytics. The composite health score for transformer TR01 is 2 i.e. asset is in good health (0=Good, 10=Bad). 13 | P a g e
PI System software
The VM (virtual machine) used for this lab has the following PI System software installed:

                                 Software                                        Version

       PI Data Archive                                                          2018 SP3

       PI Asset Framework (PI AF) server                                        2018 SP3

       PI Asset Framework (PI AF) client (PI System Explorer)                   2018 SP3

       PI Analysis & PI Notifications Services                                  2018 SP3

       PI Vision                                                                  2019

       PI Web API                                                                 2019

For additional details regarding PI System software, please see:
http://www.osisoft.com/pi-system/pi-capabilities/product-list/

                                                                                             14 | P a g e
Exercise 1 – Usage-based Maintenance
Exercise 1 – Usage-based Maintenance
In this exercise, equipment run-hours and valve actuation counts are calculated to serve as a basis for
usage-based maintenance.
There are two process lines in an ice-cream factory – Line 1 and Line 2, with two mixers on each line.
Step 1: Exploring the Asset Framework structure
1. Open PI System Explorer; connect to the PI World AF database.
If the top bar of the PI System Explorer window does not already show \\PI1\PI World, then
click on the top toolbar button to select the PI AF database named PI World.
15 | P a g e2. From the Elements section, navigate to Exercise 1 > Process Area > Line 1.
The Attributes tab shows the current production on Line1.
3. Drill-down under Line 1 > Mixer 1, then click on the Attributes tab for Mixer 1.
16 | P a g eExercise 1 – Usage-based Maintenance
a. Note the Last Maintenance Date attribute.
Review the attribute configuration (in the right-side panel); SELECT statement retrieves
the date from a table.
b. To view the full table, go to the Library section of PI System Explorer, under Tables >
Maintenance System Data section.
Select the Table tab to visualize the data.
Typically, this table queries an external system such as your maintenance database and
is refreshed with new values on a periodic basis.
c. Note the Failure Status attribute. This will be used in later calculations and is simple
Boolean denoting a Failure.
Each ice-cream mixer has a motor; its RPM (revolutions per minute) is measured.
A valve is opened to allow the product to flow in and be mixed. We would like to calculate the running
hours for the mixers but there is no direct measurement to indicate the running/idle status of the mixer.
17 | P a g eStep 2: Creating a Status attribute
The mixer is inferred to be “in production” when it is “running” and the valve is open.
Let’s create an analysis to store the equipment status. We also know that the equipment provides a
failure indicator which can be useful for OEE type calculations.
1. Go to the Elements section of PI System Explorer, under our Line 1 > Mixer 1 equipment. Look
at the RPM and Valve attributes.
Select both attributes using the Ctrl key on your keyboard, and then right-click one of the two
attributes to select Trend.
Note the RPM in blue and Valve status in red.
The equipment is “in production” when both the valve is open (value=1) and the RPM has a
positive value (value>0).
18 | P a g eExercise 1 – Usage-based Maintenance
2. Note Equipment Status attribute that we have created as a placeholder for the status of the
equipment. It shows “Pt Created” as no value has been written to it yet.
3. This Equipment Status attribute uses an enumeration set called Equipment Status, where:
The Enumeration set is available from Library > Enumeration Sets > Equipment Status.
4. Switch to the Analyses tab for Mixer 1 and create a new Expression analysis called Mixer
Running Status.
5. To configure this expression, we use the RPM attribute, the Valve attribute, and the Failure
Status attribute.
a. In the Variable1 expression field, enter the following; you can use the “intellisense” like
prompts to speed up the process of writing this expression.
Name Expression
If 'Failure Status'=1 Then 2 Else If ('RPM'>0 And ‘Valve’=1) Then 1 Else
Status
0
Note: Use Shift+Enter to start a new line while writing an Analysis Expression. Use // in front of a line to
mark it as a comment.
b. Map the expression result to the Equipment Status attribute (see next picture).
c. Leave the scheduling option to Event-Triggered and Any Input.
d. Click the Evaluate button to check the current value.
19 | P a g ee. Click the button in the top toolbar to save the changes. The analysis will
attempt to start and show Running (green checkmark) if no error is present.
6. The expression is currently only available to Mixer 1.
To enable it for all other mixers, right-click the Mixer Running Status analysis and select Convert
to Template.
Next, click on to save the changes.
The calculations can now be applied to all four mixers
20 | P a g eExercise 1 – Usage-based Maintenance
7. We will now backfill the status attribute since the beginning of the year (since 01-Jan-2020).
From the Management section of PI System Explorer, select (see below picture for guidance):
1. Management
2. The Plus sign to add an analysis search
3. Enter a name like Mixer Running Status and add a search criterion
where the Name = Mixer Running Status (or the name you gave the
analysis created in the previous step). Once created, make sure to select
it to filter the list of retrieved analyses in the center.
4. Check the checkbox to select the four (4) Mixer Running Status analyses.
5. Click the Backfill/Recalculate 4 selected analyses link.
6. Enter a start date of First day you started this course and leave the end
date to * (right now).
7. Click the Queue button to start the backfilling.
8. Confirm that the backfill was
successful; in the Elements
section, look at the
Equipment Status attribute
of Line 1 > Mixer 1 (0=Idle,
1=Running, 2=Failure).
Right-click on the attribute to
select Trend. View the
equipment status for the last
8 hours, from *-8h to *.
21 | P a g eStep 3: Creating usage-based run hours attributes
Now that we have an equipment status attribute, we can use it to create usage-based counters for
different time ranges (daily, previous day, MTD, YTD, etc.).
1. From the Elements section, select a Mixer and look at its attributes under the Usage-based
Statistics category.
We will first populate the run-hours attributes with an analysis, then the valve actuation count
with a second analysis.
2. For the run-hours attributes, navigate to the Analyses tab for Exercise 1 > Line 1 > Mixer 1 and
create a new Expression analysis named Run Hours – 5m.
3. Complete the expression and map the output as follows:
The TimeEq() function calculates the total time in seconds, within a range, that an attribute
value is equal to a specified value. In our case, we are looking for the time where the Equipment
Status attribute was equal to 1 (where 1=Running).
22 | P a g eExercise 1 – Usage-based Maintenance
Note: In Expressions, PI Time Format can be used to specify relative times. For instance, '*' means now,
't' means today at midnight, 'y' means yesterday at midnight, and '1' means the first day of the current
month at midnight.
Name Expression Description
DailyRH TimeEq('Equipment Status', 't', '*',1)/3600 Today’s run hours.
4. Configure the scheduling to be Periodic, every 5 minutes. This is probably too often for a
production environment, but for the purpose of the lab, we want the results to be written
quickly.
5. Click the Evaluate button to ensure no error is present. Next, click the top-toolbar
button to save the changes and start the analysis.
6. Right-click the Run Hours – 5m analysis and select Convert to Template to create it for the other
mixers as well. Again, click on the button to commit the changes.
7. For the rest of the calculations we don’t need results every 5 minutes, but instead will calculate
them daily. Since these Analyses will be similar we can copy and past the recently completed
Analysis and rename it Run Hours – 1d.
8. Use the Add a new variable link above the expressions section to add multiple rows/expressions
to have four (4) rows. We will add the expression and map it to the correct attributes.
23 | P a g eName Expression Description
PrevRH TimeEq('Equipment Status', 'y', 't',1)/3600 Yesterday’s run hours.
Month-to-date run hours, '1' meaning
MTD TimeEq('Equipment Status', '1', '*',1)/3600
the first day of the current month.
Year-to-date run hours, ‘1/1’ meaning
YTD TimeEq('Equipment Status', '1/1', '*',1)/3600
January 1st of the current year.
TimeEq('Equipment Status', 'Last Maintenance Run hours since the last maintenance
RHSinceMaint
Date', '*',1)/3600 date attribute value.
Note: These calculations, especially Year-To-Date (YTD) can be very expensive on the Analysis service.
It is recommended to execute them periodically to ensure you have control on how often they are being
triggered.
Another way to lessen the load of these calculations is to create a Run Hours totalizer analysis that would
increment the lifetime or YTD run hours every day at midnight, and where the expression will be:
PreviousDayLifetimeTotal + DailyRunHours = NewLifetimeTotal
9. Click the Evaluate button to ensure no error is present. Next, click the top-toolbar
button to save the changes and start the analysis.
10. Right-click the Run Hours – 1d analysis and select Convert to Template to create it for the other
mixers as well. Again, click on the button to commit the changes.
Step 4: Creating a usage-based counter (valve actuation)
A valve, like other pieces of equipment, can wear out with usage by actuation.
The valve on each mixer has a status shown in the Valve attribute, Close=0 and 1=Open.
We will create an analysis to count the number of 0-1 occurrences since the last maintenance date. As in
the previous step, this calculation can be performed on different time ranges. Note that we will assume
the same maintenance date for the whole asset, although you could have different maintenance dates
for different components of an asset.
1. Under the Analysis tab, create a new expression analysis, named Valve Actuation.
2. Use the NumOfChanges() expression to calculate the number of actuations that occurred on the
valve since the last maintenance date. The NumOfChanges() function returns the number of
changes in value for an attribute within a specified time range. It will not consider equal
consecutive values as a change (for example if a PI Tag was receiving and recording consecutive
1 values as in 0-1-1-1-1-1-0-1-0, this would count for 4 changes). We are dividing by 2 as
NumOfChanges() will count the 0-1 and the 1-0 as changes.
Name Expression
ActuationCount NumOfChanges('Valve', 'Last Maintenance Date', '*')/2
24 | P a g eExercise 1 – Usage-based Maintenance
3. Map the expression to the Valve Actuation Count Since Maintenance attribute.
4. Leave the scheduling to Event-Triggered and Any Input. The calculation result may come in a
little while since it will be performed only when the Valve attribute will get a new value.
5. Evaluate the expression and if successful, click the button to save the changes and
start the analysis.
6. Right-click the Valve Actuation analysis to select Convert to Template. Click a second time on
the button to commit the changes.
7. Check the result from the Attributes tab (again it may take a while before the value shows up,
use the Refresh button from the top toolbar to force a refresh of the attributes value).
Note: Similarly, a counter for the number of failures on the equipment can be created and used towards
usage-based maintenance trigger. This will be explored as part of Exercise 2.
Step 5: (Optional) Comparing equipment on their usage-based statistics
We will use PI Vision to compare the status and the run hours and valve actuation attributes for the four
mixers.
1. Open Google Chrome from the taskbar shortcut and then click on the PI Vision shortcut from
the Bookmarks bar (this will bring you to https://pi1.pischool.int/PIVision).
2. You can explore the displays available, but for this step, click the + New Display button in the
top upper right.
3. Select the Assets pane on the left side.
4. Drill-down (click on the “>”) to PI World > Exercise 1 > Process Area > Line 1 > Mixer 1.
25 | P a g e5. Select the Table symbol ( ) at the top.
6. Drag and drop the Usage-based Statistics category on the display. You can right-click the table
that was added and select Configure Table, to keep only the Name, Value, and Units columns,
and customize the formatting of the display.
7. You can then add the Process Parameters with a Trend symbol ( ), and also use the custom
String Values Plot symbol ( ) to show the Equipment Status attribute.
8. The end result could look similar to (note the tank symbol is coming from the Graphic Library
left-side pane ( ), under the Tanks section):
26 | P a g eExercise 1 – Usage-based Maintenance
9. Once completed, use the Switch Asset drop-down to select another Mixer and see the new
values populate the display.
10. It is possible to have the statistics for all four mixers side by side. Simply right-click the Table
symbol and select Convert to Collection…
27 | P a g e11. Make sure to resize the Collection symbol that was created to show all four (4) tables.
12. In order to show all four mixers, you may need to right-click the Collection that was created,
select the Edit Collection Criteria… and modify the Search Root field like in the below picture
(remember to check the Return All Descendants option):
28 | P a g eExercise 1 – Usage-based Maintenance
Then click the Refresh button. Resize the symbol to show all four (4) mixers information.
13. Another way, to compare the statistics, but this time in one table, is to use the Asset
Comparison Table symbol.
1. Select the Asset Comparison Table symbol ( ).
2. Drag the whole Usage-based Statistics attribute category on the display.
3. Search for mixer under the Process Area level in the hierarchy to find all
four mixers.
4. Using the Ctrl key, multi-select the four mixers.
5. Drag the four mixers over the Asset Comparison Table to add all four to
the symbol.
29 | P a g eOnce all four assets are added, it is possible to order by one of the columns by clicking on the column
header of interest (make sure the display is not showing the edit symbol ( ) in its upper-right corner
to use this functionality).
30 | P a g eExercise 2 – Condition-based Maintenance
Exercise 2 – Condition-based Maintenance
In this exercise, we assess the condition of an equipment by calculating metrics that can serve as leading
indicators of equipment failure or loss of efficiency – for example, bearing temperature to understand
the pump bearing condition.
We track the alerts for the bearing temperature and then discuss the use of PI Notification to send an
email or use the web service delivery channel to notify a system (i.e. triggering a work order) for follow-
up action. The bearing temperature events are viewed in a watchlist in PI Vision.
First, look at usage-based information in AF structure used for this exercise.
Step 1: Exploring the Asset Framework structure
1. Open PI System Explorer and connect to the PI World AF database. If the top bar of the PI
System Explorer window does not show \\PI1\PI World already, then click on the top toolbar
button to select the PI AF database.
2. From Elements section of PI System Explorer, explore the structure for Exercise 2 by drilling-
down under Exercise 2 > Pump Station > Pump01.
This pump station currently has five (5) pumps. A new sixth pump has been ordered and will soon
be installed.
Maintenance is important for these critical assets. Usage-based maintenance has already been
implemented, in a manner that we saw for the ice-cream mixers in Exercise 1.
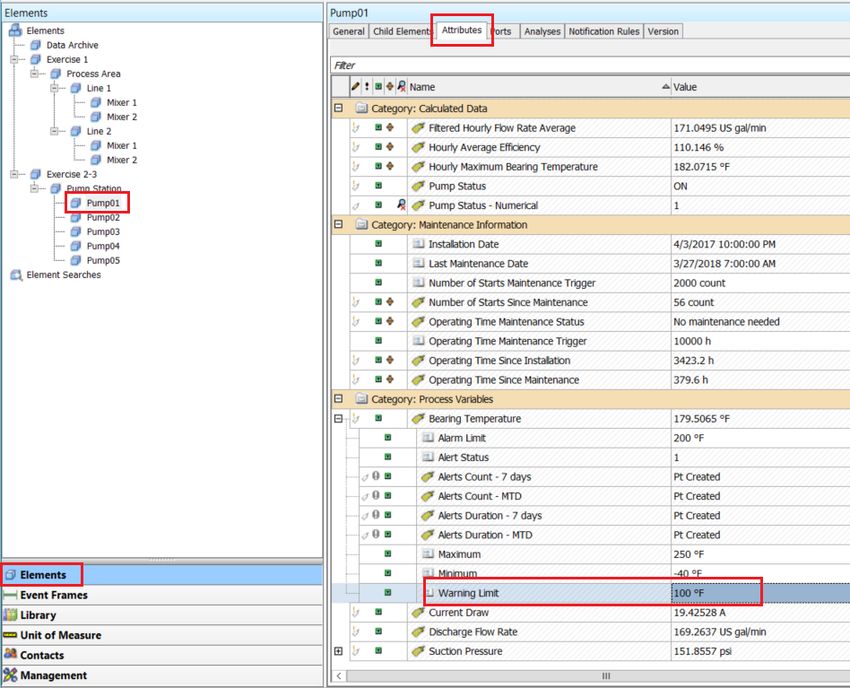
3. From the Attributes tab of Pump01, explore the Maintenance Information section.
31 | P a g eNumber of starts and operating time (run hours) thresholds have been added and current totals
since the last maintenance can be evaluated to determine if maintenance is required based on those
criteria.
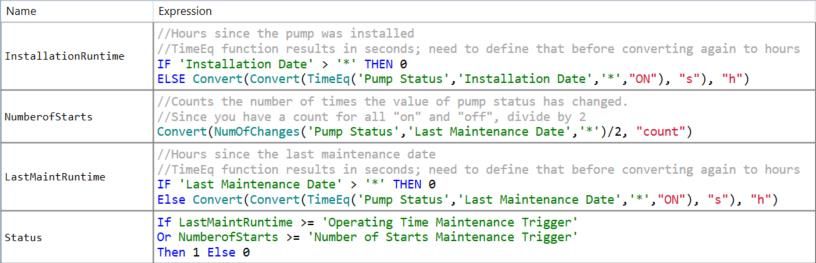
4. Explore the analysis expression from the Analyses tab. The Usage-based Calculations analysis
evaluates the new totals on a regular basis and compares them to their limits.
In order to keep track of instances where the values violate threshold limits, you can configure
analysis to keep track of those as events. Using the Event Frame Generation option, events will
be generated to track what is relevant to you.
In this example, the usage-based statistics are tracked by the Usage-based Maintenance Event
analysis.
32 | P a g eExercise 2 – Condition-based Maintenance
Step 2: Monitoring the bearing temperature
In addition to usage-based metrics, we can also look at sensor data, say, a temperature. Bearing
temperatures for the pumps are available.
Under normal conditions, we know that the temperature should not exceed a defined high limit.
1. Look under the Attributes for Pump01 and expand the attributes under the Bearing
Temperature.
The Warning Limit and Alarm Limit attributes define the high limits; they are configured with
the attribute trait Hi and HiHi respectively, as shown in the Properties field (this will be used in
PI Vision).
Note the presence of placeholders for count and duration of temperature alerts; these will be
configured in the steps below.
2. Explore the Formula attribute named Alert Status. It is evaluating whether or not the bearing
temperature is above its warning limit, and if so turns to 1 (if T>=L then 1 else 0). This will be
used to count the number of occurrences and the duration of the alerts in the next step.
33 | P a g eStep 3: Tracking high bearing temperature events
Using Event Frames, we can track the instances where the temperature exceeded its limits.
1. Navigate to the Analyses tab for Pump01 and create a new analysis named Pump High Bearing
Temperature.
2. Change the analysis type to Event Frame Generation.
3. Select the High Bearing Temperature Event event frame template.
4. Add a new Start Trigger from the Add... link.
5. Configure one Warning-level trigger and one Alarm-level trigger as shown in the below picture.
Name Expression
Warning 'Bearing Temperature' >= 'Bearing Temperature|Warning Limit'
Alarm 'Bearing Temperature' >= 'Bearing Temperature|Alarm Limit'
34 | P a g eExercise 2 – Condition-based Maintenance
Note: In the current example, the alarm-level trigger needs to be of a higher severity than the warning-
level trigger in order to become active. Furthermore, the True for (time true) option can be leveraged to
make sure valid alerts are being triggered.
6. Leave the scheduling as Event-Triggered on Any Input.
7. Optionally, you can store the start trigger name to an attribute of the event that will get
generated from this analysis.
You can also enable a Root Cause child event frame to be generated, in order to have an easy
window of time to look at the data (in PI Vision) before the event occurred.
8. Preview the results for Pump01 by right-clicking the Pump High Bearing Temperature analysis
and selecting Preview Results. You can preview the last day (*-1d to *) by pressing the Generate
Results button to see if any alerts were present.
9. Click the button from the top toolbar to save the changes, then right-click the Pump
High Bearing Temperature analysis and select Convert to Template to enable this analysis for all
pumps. Click the button once more.
35 | P a g eStep 4: Alerting on high bearing temperature events
Events are being tracked by the system, but a Notification can be configured to allow an email to be sent
or a web service call to be issued.
1. Switch to the Notification Rules tab of the Pump01 element.
2. Click the Pump High Bearing Temperature notification rule.
3. Click the Please configure trigger criteria for this notification rule link in the Trigger section.
4. Select the Pump High Bearing Temperature analysis and leave the rest to default values. Click
OK.
5. Explore the Subscriptions section by clicking the View/Edit Subscriptions link on the right.
6. If triggered, the notification will send an email out to the Student account, using a format called
High Bearing Temperature. Click the pencil icon to verify what email format.
7. Before clicking the Test Send button, change the email address to student01@pischool.int,
which is the email account for your user on this machine.
36 | P a g eExercise 2 – Condition-based Maintenance
8. Click Ok and Ok again to exit the windows.
9. Select the Pump High Bearing Temperature notification rule and click the Start button ( ) to
start the rule, and click , then right-click the notification rule to select Convert to
Template and click again to save the changes.
When a new high bearing temperature event is generated, a notification will be triggered, and an
email will be sent out to the student01 account’s email address. You can open Outlook to check for
these emails.
37 | P a g eStep 5: (optional) Sending an email notification on a high bearing temperature alert
We will first change the email address of the Student to the student01@pischool.int account.
1. From PI System Explorer, navigate to the
Contacts section (refer to the below
picture).
2. Search for student in the contact search
field.
3. Select the Student contact.
4. Modify its Email address field to
student01@pischool.int .
5. Click the button to save the
changes.
The next triggering of the high bearing
temperature should send you an email. Instead
of waiting, we will force the temperature to be
too high.
6. Navigate to the Elements section and to the Exercise 2 > Pump Station > Pump01 element.
Select its Attributes tab.
7. Expand the Bearing Temperature attribute and modify the value of the Warning Limit attribute
to something lower like 100 °F. Then click the button to save the changes.
38 | P a g eExercise 2 – Condition-based Maintenance
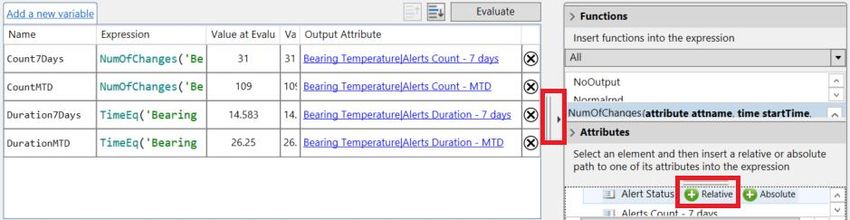
Step 6: Counting number and duration of bearing temperature alerts
For reporting or prioritization purposes, it is useful to have counts on the number of alerts an equipment
had over a certain time period.
Total duration of those alerts can also be used to identify equipment most under alert.
1. We already have placeholders for those counters as part of the Bearing Temperature child
attributes.
2. Under the Analyses tab for Pump01, select the Count and Duration expression analysis. We
only need to complete the fourth variable and start the analysis.
3. Use the TimeEq() function to do so on the Alert Status attribute to calculate the total duration
the bearing temperature was in alert since the beginning of the month.
Name Expression
DurationMTD TimeEq('Bearing Temperature|Alert Status','1','*',1)/3600
4. Map the output to the right bearing temperature children attribute.
5. The scheduling is Periodic (5 minutes).
6. Click Evaluate to confirm the calculations are functioning properly.
39 | P a g eNote: When writing an expression, the auto-complete feature will not suggest child attributes. They can
be added from the right-hand side panel:
It can also be added by typing the attribute name 'Bearing Temperature|Alert Status' directly in the
expression field.
7. Click , then the Start button ( ) to start the analysis, then right-click the analysis to
select Convert to Template and click again to save the changes.
Step 7: (Optional) Adding Pump06
In the current example, we have a Pump template. It includes the attributes, the analyses and
notification rules. Pump06 was recently added to the Pump Station and we need to add it to asset
structure.
1. Right-click the Pump Station element and select New > New Child Element.
2. Select the Pump template and click OK.
40 | P a g eExercise 2 – Condition-based Maintenance
3. Under the General tab of the newly created element, rename the element to Pump06.
4. Switch to the Attributes tab and click the button, and then the Refresh button. The
tags are found and the analyses started.
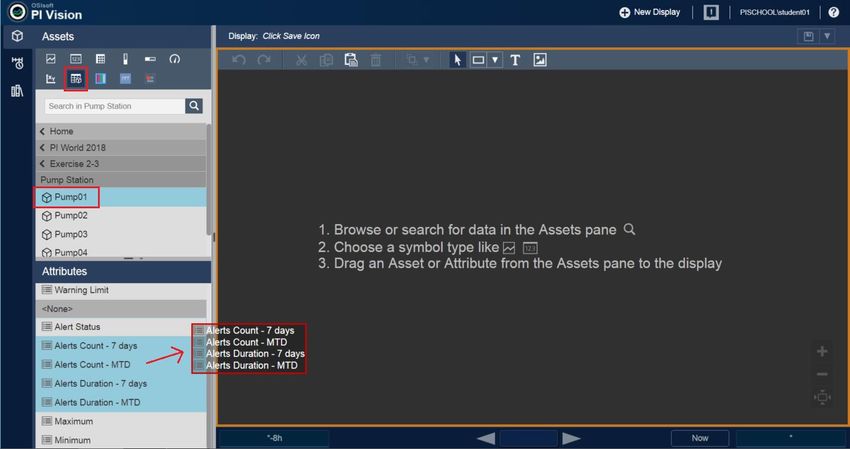
Step 8: (Optional) Visualizing counts and watchlist of events
An easy way to share this information is via PI Vision. Use the below steps to build a new display, or use
the existing completed display (https://pi1.pischool.int/PIVision/#/Displays/118/Ex2-BearingTemperatureAlerts).
1. Open the Google Chrome web browser from the taskbar and click the PI Vision link from the
bookmark tool bar or navigate to https://pi1.pischool.int/PIVision.
2. Click the + New Display button in the upper right of the page to create a new display.
3. Use the Assets pane on the left hand side to reach PI World > Exercise 2 > Pump Station >
Pump01.
4. Select the Asset Comparison Table symbol ( ).
5. Drill-down under the Bearing Temperature attribute from the Attributes section at the bottom.
6. Using the Ctrl or Shift key on your keyboard to multi-select, drag-and-drop the 7-days and MTD
count and duration attributes located under the Bearing Temperature attribute.
41 | P a g e7. Once you have the proper attributes added for Pump01, drag-and-drop the other pumps
elements on the asset comparison table to add extra rows for those other pumps.
8. You can now order the pumps by their MTD hours in alert to understand which asset most
under alert condition; in the below example it is Pump01.
42 | P a g eExercise 2 – Condition-based Maintenance
Note: You can change the PI Vision display background color by right-clicking the background and
selecting Format Display.
9. Open the left-hand side Events pane and click the Create Events Table button to add a table
that can be used as a watchlist of recent high bearing temperature alerts.
10. Right-click the Events Table to select Configure Table.
11. From the configuration pane that shows up, check to add the Reason, Acknowledged By, and
Acknowledged Date columns.
43 | P a g e12. Make sure the Asset Name field has the Assets on Display radio button selected.
13. Click the Apply button at the bottom to confirm the changes.
44 | P a g eExercise 2 – Condition-based Maintenance
14. Resize the table so it shows all columns correctly.
Step 9: (Optional) Acknowledging and entering reason code for the alerts
The bottom events table shows the active high bearing temperature events in the time range, defined
by the display time-bar at the bottom of the screen. The configuration of those events allows you to
acknowledge it, as well as to enter a reason code. Both functionalities can be performed from the event
table symbol. Acknowledging is useful when sending Notifications, where you need to confirm that they
are aware of the alert. The reason code value can leverage a reason tree to specify the cause of the
alert, if available.
1. Select one recent event and enter a reason code by clicking the button and selecting a
reason code from the reason tree.
2. Click the button and confirm you can see your username and
acknowledgement time after you clicked it.
45 | P a g eExercise 3a – Predictive Maintenance (PdM) – Bearing Vibration
In an equipment/asset maintenance and reliability context, the layers of analytics can be viewed as:
▪ Usage-based Maintenance
▪ Condition-based Maintenance
▪ Predictive Maintenance - AF (simple predictive) and third-party libraries (advanced predictive)
46 | P a g eExercise 3a – Predictive Maintenance (PdM) – Bearing Vibration Here, we illustrate PdM (predictive maintenance – simple analytics ) using vibration data for a pump to predict its remaining useful life (RUL). The following method uses built-in AF Asset Analytics function. The vibration data represents the nominal percent (of normal) vibration over a period of 82 weeks; a new value is collected every week. The vibration values increase over time as shown below: We will calculate the estimated RUL till we reach the HIHI value of 400. The calculations return the failure time represented in the trend below by using linear extrapolation. 47 | P a g e
Step 1:      Examine the Data
Let’s first look at the AF structure:

    1.    Open PI System Explorer
    2.    On the top left corner, click on Database, and then double click “AFExampleRUL”
    3.    Expand Site > Unit 1 > Pump 1 > RotEquipHealthSensor_SKFCMWA8800_1A
    4.    Click on the above asset and then click the Attributes Tab to examine it

                                                                                            48 | P a g e
Exercise 3a – Predictive Maintenance (PdM) – Bearing Vibration
5. Expand the “OverallBearingFault” attribute and check its child attributes
6. Below are some important attributes we’ll be dealing with as part of the RUL calculation:
a. OverallBearingFault: the vibration nominal value. We have 82 values for this attribute,
values update every week, and will range from 49 to 252 over a period of 82 weeks
b. OverallBearingFault|HIHI: this is the HIHI value for the vibration; we need to calculate
the RUL till we reach this HIHI value
c. OverallBearingFault|MovingAverage: this will store the moving average values of the
vibration data. The linear fit will be done on the moving average values, as opposed to
the actual vibration values.
d. OverallBearingFault|MovingAverage Event Count: this sets the number of events in the
MovingAverage calculation above.
e. OverallBearingFault|LinearRegression Event Count: this sets the number of events in
the Linear Regression calculation that will output the value for m and b.
f. OverallBearingFault|b: this will store the intercept of the line being generated from the
moving linear regression calculation we will implement in AF Analytics on the moving
average values
g. OverallBearingFault|m: this will store the slope of the line being generated from the
moving linear regression calculation we will implement in AF Analytics on the moving
average values
h. OverallBearingFault|r_squared: this will store the r2 of the line being generated from
the moving linear regression calculation we will implement in AF Analytics on the
moving average values. The closer r2 is to 1, the better the fit
i. BearingLifeExpectancy: the calculated RUL in days till we reach the HIHI value. This will
be calculated using a moving built-in linear regression function in PI Asset Analytics
j. BearingForecastedFailureDate: the predicted failure date based on the
BearingLifeExpectancy calculation
49 | P a g eStep 2: Examine the moving average linear regression calculations in AF Analytics for
calculating the RUL
In this section, we will examine AF Analytics where we calculate the RUL based on a moving linear
regression algorithm. This is implemented because when observing the data, you can clearly see that the
curve has different slopes at different times.
1. Open PI System Explorer
2. On the top left corner, click on Database, and then double click “AFExampleRUL”
3. Expand Site > Unit 1 > Pump 1, and click on “RotEquipHealthSensor_SKFCMWA8800_1A”
4. Click the “Analyses” tab on the right
5. Check the “Bearing Life Calculations” analysis
6. The formulas of the “Bearing Life Calculations” analysis which relate to this section are shown
below:
7. Below is a brief description of each formula:
a. MovingAverageEvents: Returns an array of the values the length of which is specified by
the MovingAverage Event Count attribute
b. MovingAverage: Calculates an average of all the values from the previous array
c. LinearRegressionEvents: Returns an array of the values the length of which is specified
by the LinearRegression Event Count attribute
d. LinearRegressionEventsTimestamp: Returns the timestamps of all the values in the
previous array
e. LinearRegressionEventsStartTime: Extracts the first timestamp from the array to be
used in the LinRegr function
f. LinearRegressionEventsEndTime: Extracts the last timestamp from the array to be used
in the LinRegr function
g. LinearRegr: performs a linear regression on the past 12 moving average values, and
returns and array of 3 values; the slope of the line, the intercept, and the r2
50 | P a g eExercise 3a – Predictive Maintenance (PdM) – Bearing Vibration
h. Fit: stores the array value from the previous formula assuming no errors were
generated
i. Enable Fit: Checks that the previously specified number of events exist for the Linear
Regression before proceeding
j. m: extracts the slope of the line generated from the array result of the LinearRegr
formula
k. b: extracts the intercept of the line generated from the array result of the LinearRegr
formula
l. rsquared: extracts the r2 value of the line generated from the array result of the
LinearRegr formula
m. LifeExpectancy: calculates the RUL till we reach the HIHI value of 400, based on the
slope, the intercept, and the time of the calculation. The r2 is checked to make sure its
value is not too low, which might result in an unreliable RUL prediction. The prediction is
converted to hours and mapped to the BearingLifeExpectancy attribute, which is set to
convert hours to days in the attribute template
n. ForecastedFailDate: uses the calculated LifeExpectancy and the calculation time to
determine the estimated fail date
Step 3: Simulating the calculations
In this section, we will simulate receiving the vibration data over a period of 82 weeks and examine the
results of the RUL calculations.
1. Navigate to the Desktop and click on the “PI Vision” Shortcut
2. Use the tree menu on the left to navigate to the “Vibration RUL” displays
3. Click on the “Vibrations RUL” display
4. This Display shows us the important information from the analytics. Here the user can quickly
see the methods used and RUL.
51 | P a g eExercise 3b – Engine failure - CM, PM and PdM - early fault detection via
machine learning
This is a “discussion only” Exercise to explore the questions below. The machine learning – predictive
model development, model deployment etc. is covered in a separate lab.
In this Exercise, we use engine operations data and failure history to guide maintenance decisions, and
quantify the benefits in moving from CM to PM to PdM:
▪ Corrective maintenance - break-fix
▪ Preventive maintenance - run-hours based
▪ Predictive maintenance - early detection (via machine learning - multi-variate condition
assessment)
In a deployment with about 100 similar engines, sensor data such as rpm, burner fuel/air ratio, pressure
at fan inlet, and twenty other measurements plus settings for each engine – for a total of about 2000
tags – are available. On average, an engine fails after 206 cycles, but it varies widely - from about 130 to
360 cycles – each cycle is about one hour.
The engine data – for the 100 engines is as below.
The engine AF database is available in a separate VM – and is out of scope for the current discussion.
52 | P a g eExercise 3b – Engine failure - CM, PM and PdM - early fault detection via machine learning 53 | P a g e
Note that the historical sensor data is not relevant to the CM/PM/PdM questions in the sections below –
but is shown here for informational purpose only.

Step 1:     Failure History
For the 100 engines, the failure history i.e. the number of runs or cycles when an engine fails is shown
below. Also, shown are the density and cumulative density plots. Note that the engine failures are
reasonably normally distributed – mean is 206 cycles, median is 199, minimum is 128 and maximum is
362.

                                                                                              54 | P a g e
Exercise 3b – Engine failure - CM, PM and PdM - early fault detection via machine learning The full failure history is as below - in 5 rows, 20 engines per row, showing the cycle number when the engine failed: 192 287 179 189 269 188 259 150 201 222 240 170 163 180 207 209 276 195 158 234 195 202 168 147 230 199 156 165 163 194 234 191 200 195 181 158 170 194 128 188 216 196 207 192 158 256 214 231 215 198 213 213 195 257 193 275 137 147 231 172 185 180 174 283 153 202 313 199 362 137 208 213 213 166 229 210 154 231 199 185 240 214 293 267 188 278 178 213 217 154 135 341 155 258 283 336 202 156 185 200 55 | P a g e
56 | P a g e
Exercise 3b – Engine failure - CM, PM and PdM - early fault detection via machine learning

Step 2:        Corrective, preventive and predictive maintenance
In addition to the failure history, the following cost data is available.

    ▪     Each engine run (lasts an hour) and adds $1000 to profit
    ▪     Each engine PM costs $10,000 and takes 10 hours
    ▪     A failed engine costs $20,000 to repair and takes 20 hours

Currently, maintenance uses a break/fix philosophy i.e. wait for an engine to fail before doing any
maintenance.

    ▪     Can you quantify the $ spent on maintenance with the break-fix strategy (corrective
          maintenance)?
    ▪     A sister company with similar operations, failure history and repair/PM costs uses the median
          failure rate of 199 cycles for PMs. Should you adopt this?
    ▪     Can you do better? If so, after how many cycles will you do the PMs?
    ▪     Can you quantify the benefits in moving from corrective to run-hours based PMs?

Lastly, in considering predictive maintenance (PdM) i.e. data science/machine learning etc., the
maintenance department has informed us that they need 20 hours (cycles) notice to schedule the PMs.

As such consider the following:

    ▪     If engine operations data can be used for early detection of failure – say, within 20 cycles of a
          failure with 100% accuracy – if and how much will you save by using PdM vs the PM approach

Re. how to interpret “within NN cycles”, there is uncertainty in predicting when an engine will fail – and
the more I’m willing to give away, the more certain that I’ll be correct.

“Within 20 cycles” says that it could fail in the next cycle or in the next 10th or the next 15th cycle etc. –
but based on the failure history, I know with 100% certainty that it will fail in the next 20 cycles – and I’m
100% sure that I’m not giving away more than 20 cycles.

Regarding simulation-based approach to answer some of the above questions, see
https://turbofan.fastforwardlabs.com - this uses the same engine failure operations and failure data –
but with a different cost structure for PMs and repairs.

Regarding early failure detection (within 20 cycles), the machine learning based predictive model
development and model deployment in PI – including the lab manual, see:

https://pisquare.osisoft.com/docs/DOC-3463-predicting-remaining-useful-life-and-equipment-failure-
using-a-machine-learning-multivariate-model

During the lab, we will discuss the answers to the questions in this Exercise.

57 | P a g e
Exercise 4 – Condition assessment rules and asset health score
Objective
Apply the appropriate condition assessment rules to process/equipment measurements and calculate
an overall asset health score.
This Exercise is a walk-through; it does not include specific hands-on items
Solution
The solution uses Asset Framework Analytics capabilities to convert a “Raw Value” (PI tag value) to a
normalized i.e. a “Case Value” (AF Attribute). And then, by applying a Weight%, it is transformed to a
Score.
Thus, each measurement gets a normalized weighted score (0 to 10) by applying a condition assessment
rule. And, then the normalized scores are rolled up to arrive at a composite asset health score. The
Weight% applied to each attribute depends on its contribution to the asset health.
The composite asset health score ranges from 0 to 10 (0=Good, 10=Bad)
Let’s use a Transformer - and consider the following:
▪ LTC counter operations (LTC= Load Tap Changer)
▪ LTC through neutral count
▪ DGA (dissolved gas analysis) detectable acetylene
▪ DGA High gas rate of change
▪ Low dielectric
▪ High water
▪ Low nitrogen pressure
For illustration, let’s use the first two, i.e. LTC counter operations and LTC through neutral.
The screen below shows a Transformer template.
58 | P a g eExercise 4 – Condition assessment rules and asset health score Individual attribute Case value calculation: Note that the analysis uses “Raw Value” as input and writes to “Case Value”. 59 | P a g e
Individual attribute weighted score:

Overall Health Score is a roll up of the individual Attribute scores:

                                                                        60 | P a g e
Exercise 4 – Condition assessment rules and asset health score And, as you configure Transformers using these templates, the composite health score is periodically calculated by PI System Asset Analytics. The composite health score for TR01 is 2 i.e. asset is in good health (0=Good, 10=Bad). 61 | P a g e
© Copyright 2020
  OSIsoft, LLC
You can also read