Diagnostic measures comparison for ovarian malignancy risk in Epithelial ovarian cancer patients: a meta analysis
←
→
Page content transcription
If your browser does not render page correctly, please read the page content below
www.nature.com/scientificreports

                OPEN              Diagnostic measures comparison
                                  for ovarian malignancy risk
                                  in Epithelial ovarian cancer
                                  patients: a meta‑analysis
                                  Arpita Suri1, Vanamail Perumal2*, Prajwal Ammalli3, Varsha Suryan1 & Sanjiv Kumar Bansal1
                                  Epithelial ovarian cancer has become the most frequent cause of deaths among gynecologic
                                  malignancies. Our study elucidates the diagnostic performance of Risk of Ovarian Malignancy
                                  Algorithm (ROMA), Human epididymis secretory protein 4 (HE4) and cancer antigen (CA125). To
                                  compare the diagnostic accuracy of ROMA, HE-4 and CA125 in the early diagnosis and screening
                                  of Epithelial Ovarian Cancer. Literature search in electronic databases such as Medicine: MEDLINE
                                  (through PUBMED interface), EMBASE, Google Scholar, Science Direct and Cochrane library from
                                  January 2011 to August 2020. Studies that evaluated the diagnostic measures of ROMA, HE4 and
                                  CA125 by using Chemilumincence immunoassay or electrochemiluminescence immunoassay (CLIA
                                  or ECLIA) as index tests. Using the Quality Assessment of Diagnostic Accuracy Studies (QUADAS-2).
                                  We included 32 studies in our meta-analysis. We calculated AUC by SROC, pooled estimated like
                                  sensitivity, specificity, likelihood ratio, diagnostic odds ratio (DOR), Tau square, Cochran Q through
                                  random effect analysis and meta-regression. Data was retrieved from 32 studies. The number
                                  of studies included for HE4, CA125 and ROMA tests was 25, 26 and 22 respectively. The patients
                                  with EOC were taken as cases, and women with benign ovarian mass were taken as control, which
                                  was 2233/5682, 2315/5875 and 2281/5068 respectively for the markers or algorithm. The pooled
                                  estimates of the markers or algorithm were sensitivity: ROMA (postmenopausal) (0.88, 95% CI
                                  0.86–0.89) > ROMA (premenopausal) 0.80, 95% CI 0.78–0.83 > CA-125(0.84, 95% CI 0.82–0.85) > HE4
                                  (0.73, 95% CI 0.71–0.75) specificity: HE4 (0.90, 95% CI 0.89–0.91) > ROMA (postmenopausal)
                                  (0.83, 95% CI 0.81–0.84) > ROMA (premenopausal) (0.80, 95% CI 0.79–0.82) > CA125 (0.73, 95%CI
                                  0.72–0.74), Diagnostic odd’s ratio ROMA (postmenopausal) 44.04, 95% CI 31.27–62.03, ROMA
                                  (premenopausal)-18.93, 95% CI 13.04–27.48, CA-125-13.44, 95% CI 9.97–18.13, HE4-41.03, 95%
                                  CI 27.96–60.21 AUC(SE): ROMA (postmenopausal) 0.94(0.01), ROMA (premenopausal)-0.88(0.01),
                                  HE4 0.91(0.01), CA125-0.86(0.02) through bivariate random effects model considering the
                                  heterogeneity. Our study found ROMA as the best marker to differentiate EOC from benign ovarian
                                  masses with greater diagnostic accuracy as compared to HE4 and CA125 in postmenopausal women.
                                  In premenopausal women, HE4 is a promising predictor of Epithelial ovarian cancer; however, its
                                  utilisation requires further exploration. Our study elucidates the diagnostic performance of ROMA,
                                  HE4 and CA125 in EOC. ROMA is a promising diagnostic marker of Epithelial ovarian cancers in
                                  postmenopausal women, while HE4 is the best diagnostic predictor of EOC in the premenopausal
                                  group. Our study had only EOC patients as cases and those with benign ovarian masses as controls.
                                  Further, we considered the studies estimated using the markers by the same index test: CLIA or ECLIA.
                                  The good number of studies with strict inclusion criteria reduced bias because of the pooling of studies
                                  with different analytical methods, especially for HE4. We did not consider the studies published in
                                  foreign languages. Since a few studies were available for HE4 and CA125 in the premenopausal and
                                  postmenopausal group separately, data were inadequate for sub-group analysis. Further, we did
                                  not assess these markers’ diagnostic efficiency stratified by the stage and type of tumour due to
                                  insufficient studies.

                                  1
                                   Department of Biochemistry, SGT Medical College Hospital and Research Institute, Gurugram, Haryana 122505,
                                  India. 2Department of Obstetrics and Gynaecology, All India Institute of Medical Sciences, New Delhi,
                                  India. 3Department of Biochemistry, Institute of Liver and Biliary Sciences, D1 ILBS Road, Vasant Kunj, New Delhi,
                                  Delhi 110070, India. *email: pvanamail@gmail.com

Scientific Reports |   (2021) 11:17308                | https://doi.org/10.1038/s41598-021-96552-9                                                1

                                                                                                                                             Vol.:(0123456789)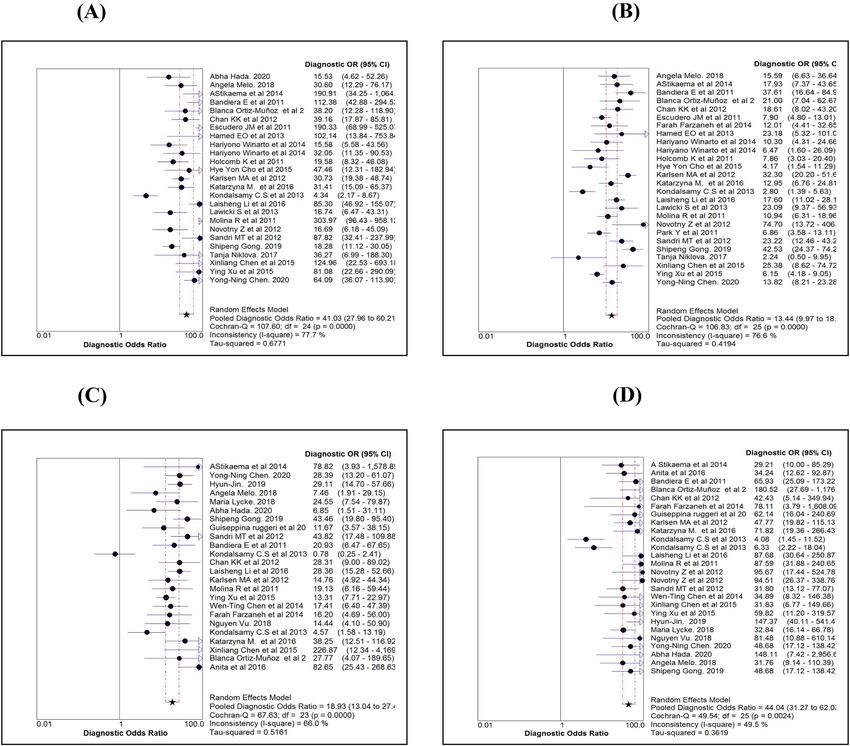
www.nature.com/scientificreports/
Ovarian cancer accounts for the eighth most common cause of deaths g lobally1. Epithelial ovarian cancer (EOC)
is one of the most common malignancies affecting perimenopausal w omen2. In India, it is the third leading cause
of cancer in females, with a 5-year cumulative estimate of 80,422 c ases1.
The lack of specific symptoms, effective screening and diagnostic techniques makes ovarian cancer challenging
to diagnose in the early stages. Therefore, late-stage diagnosis with metastasis results in a low survival rate. How-
ever, the survival rate increases to 92% when the tumor is diagnosed when l ocalised3. Therefore, ovarian cancer
research’s primary goal is to develop a practical, valid screening test to detect the disease at an early stage. The
most widely used screening tests are serum cancer antigen (CA125) estimation and Transvaginal s onography4,
which are non-specific.CA125 is an antigenic determinant recognised by a monoclonal antibody raised as an
immunogen using ovarian cell l ine5. Though serum CA125 was initially reported in patients with ovarian cancer,
higher levels were also seen during menstruation, early pregnancy, and e ndometriosis5. It is also less sensitive
as it is raised in only 80% of all epithelial ovarian cancers (EOC) and only 50% of stage I EOC6. Another bio-
marker that is currently available in the screening and diagnosing EOC is serum Human epididymis secretory
protein 4 (HE4), which was approved by the food and drug administration (FDA) in 2 0087. It is a member of
the Wey acidic protein f amily8 and is expressed in healthy tissues of the reproductive and respiratory tract. It
is postulated that HE4 is better than CA125 in diagnosing patients with EOC due to high specificity. However,
HE4 increases with age, smoking and renal d iseases9. There are several methods to estimate serum CA125 and
serum HE4, such as Enzyme-linked immunosorbent assay (ELISA), Radioimmunoassay (RIA), Chemiluminis-
cence immunoassay (CLIA) and Electrochemiluminesce immunoassay (ECLIA). CLIA and ECLIA have more
sensitivity compared to other tests10.
Risk of Ovarian Malignancy Algorithm (ROMA) is a qualitative algorithm that includes the results of serum
HE4, serum CA 125 and menopausal status into its v alue11. ROMA’s clinical utility to assess the risk of EOC in
patients with pelvic mass has been evaluated. In 2008, Moore et al. suggested that the combination of CA125 and
HE4 had the highest sensitivity compared to the single m arker12. In the year 2011, Montagnana et al. concluded
that ROMA had superior diagnostic performance in estimating the risk of EOC in premenopausal w omen13. But,
ROMA’s diagnostic performance compared to CA125 and HE4 is still controversial as the individual studies are
affected by limited sample size and random fluctuations. Thus, our study aimed to analyse ROMA’s performance
by conducting a meta-analysis of the studies using high sensitivity immunoassays like CLIA and ECLIA as the
index test. The included studies had CLIA/ECLIA as the index test, which reduced bias due to studies with
different analytical methods. This would help in elucidating the performance of ROMA in diagnosing EOC in
comparison to other serum markers.
Materials and methods
Inclusion and exclusion criteria. We included the studies if (1) CLIA or ECLIA estimated the values of
serum HE4 and serum CA125; (2) studies investigated serum HE4 or CA125 or calculated the ROMA for the
EOC diagnosis; (3) blood samples were collected before initiation of anti-tumour therapy; (4) studies used the
histopathological diagnosis as the gold standard for assessing EOC; (5) enough data could be extracted for the
fourfold table. We excluded the studies if (1) control group contained healthy individuals and borderline cases
(2) analytical method used was ELISA (3) studies showed prognostic or post-chemotherapy changes in the
marker (4) language of the abstract or full paper was in any language except English, and (5) Studies, which
calculated sensitivity at fixed specificity using Receiver operator characteristics curve (ROC).
Data extraction. We extracted data from the selected studies such as author, publication year, country, study
design, detection methods, number of patients, sensitivity, specificity and cutoff value. We chose the one that
offered the best test performance for the study with more than one cutoff value. For example, in several detection
methods used in one study, we chose the results of the most sensitive method, CLIA.
Index tests and reference standard. We calculated the ROMA index using the following formulae.
The premenopausal calculation formula of the ROMA index was: 12 + (2.38 ∗ ln(HE4)) + (0.062 ∗ ln(CA125))
The postmenopausal calculation formula of the ROMA index was: 8.09 + (1.04*ln(HE4)) + (0.732*ln(CA125)).
Since different Index tests have different sensitivity, we included only CLIA and ECLIA as the index test to
reduce the bias because of pooling studies. We considered the result of the histopathological diagnosis as the
reference standard. The criteria from FIGO was taken as the reference for surgical staging. PRISMA flow diagram
describes the number of studies screened and included for meta-analysis.
Methodological quality assessment. Using the Quality Assessment of Diagnostic Accuracy Studies (QUA-
DAS-2), two authors (AS and PA) independently assessed the methodological quality of the included studies
and extracted data using Rev Manager software. In case of conflict between the authors, the discussion helped
in reaching a uniform conclusion.
Statistical analysis. We developed a database on individual study details using a Microsoft Excel spread-
sheet and subjected it to statistical analysis using Meta-Disc software version 1.4, a freely available open-source
programme. Adding a value of 0.5 could avoid zero value in the study results, and a two-stage analysis was
performed. We calculated summary statistics such as sensitivity, specificity, positive and negative likelihood
ratios (LR) for each study in the first stage. In the second stage, we estimated overall test accuracy indexes as
the weighted average of the summary statistics. Since summary measures (sensitivity and specificity, or LR+
and LR−) are paired and often inter-related, the apt measure useful in meta-analysis is the diagnostic odds ratio
(DOR). The DOR suggests how much higher the odds of having the disease are for the people with a positive
Scientific Reports | (2021) 11:17308 | https://doi.org/10.1038/s41598-021-96552-9 2
Vol:.(1234567890)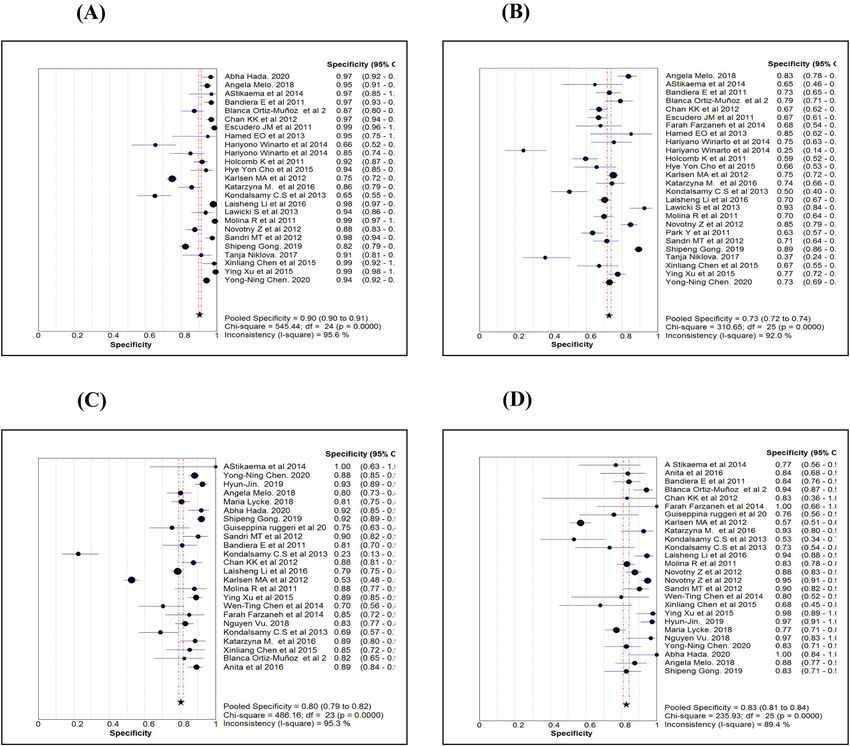
www.nature.com/scientificreports/

                                                    993 citations identified
                                                              from
                                                           PubMed                                 784 citations were excluded after reviewing
                                                                                                  abstract
                                                                                                  •    Case reports (45)
                                                                                                  •    Review (128)

                                                      209 were further reviewed
                                                                                                  •    Articles in foreign language (31)
                                                                                                  •    Unrelated Topics (580)

                                                                                                  177 studies were excluded after reviewing
                                                                                                  full text
                                                                                                  •    Healthy controls (13)
                                                                                                  •    ELISA method (23)
                                                 32 studies were included in
                                                            final
                                                                                                  •    Borderline cases (39)

                                                        Meta-analysis                             •    Sensitivity, specificity data not
                                                                                                       available (102)
                                             •     CA 125 — 26
                                             •     HE4 — 25
                                             •     ROMA - 22

                                      Figure 1.  PRISMA Flow-diagram.

                                                                                                           ROMA (pre-menopause)            ROMA (post-menopause)
Characteristics                   HE4 (studies = 25)     CA125 (studies = 26)    ROMA-all (studies = 22)   (studies = 24 )                 (studies = 26)
Ovarian cases                     2233                   2315                    2281                      902                             1902
Healthy control                   5682                   5875                    5068                      4351                            2144
Weighted average age (years)-
                                  53.7                   53.5                    54.5                      Not reported
cases
Weighted average age (years)—
                                  43.2                   43.5                    43.1                      Not reported
control
Stage specific distribution (%)
I                                 290 (13.0)             294 (12.7)              320 (14.0)
II                                93 (4.2)               101 (4.4)               101 (4.4)
III                               691 (30.9)             721 (31.1)              754 (33.1)                Not reported
IV                                315 (14.1)             342 (14.8)              265 (11.6)
Not available                     844 (37.8)             857 (37.0)              841 (36.9)
Type specific distribution (%)
Serous                            799 (35.8)             819 (35.4)              798 (35.0)
Mucinous                          150 (6.7)              150 (6.5)               129 (5.7)
Endometroid                       263 (11.8)             253 (10.9)              242 (10.6)
Clear                             99 (4.4)               95 (4.1)                94 (4.0)                  Not reported
Mixed                             38 (1.7)               38 (1.6)                38 (1.7)
Others                            13 (0.6)               13 (0.6)                11 (0.5)
Not available                     871 (39.0)             947 (40.9)              969 (42.5)

                                      Table 1.  Characteristic of patients undergone different diagnostic tests. Human epididymis secretory protein 4
                                      (HE4), Cancer antigen (CA125) and Risk of Ovarian Malignancy Algorithm (ROMA).

                                      test result than those with a negative test result. For each summary measure, we calculated 95% exact confidence
                                      limits. We examined the degree of variability (heterogeneity) among the study results by plotting the summary
                                      measures on a forest plot. The sampling error variability is likely to be high in a meta-analysis for studies with
                                      different sample sizes. Other sources of variation could be due to the study subjects’ characteristics, mode of
                                      treatment, and design quality. Therefore, assessing the heterogeneity in meta-analysis is crucial because the

Scientific Reports |      (2021) 11:17308 |                         https://doi.org/10.1038/s41598-021-96552-9                                                      3

                                                                                                                                                               Vol.:(0123456789)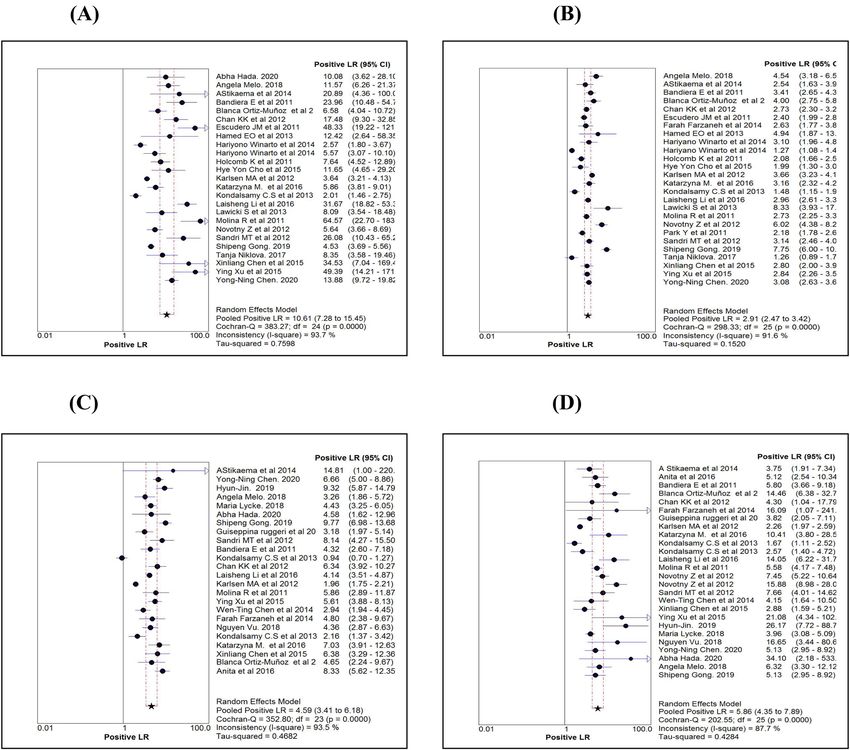
www.nature.com/scientificreports/
Figure 2. Quality of publications (QUADAS-2) on six domains prepared by using Revman 5.3
Name of marker ROMA
Statistics (95% ROMA ROMA ROMA
Procedure CI) HE4 CA 125 All Pre-Menopause Post-Menopause
Sensitivity 0.73 (0.71–0.75) 0.84 (0.82–0.85) 0.86 (0.84–0.87) 0.80 (0.78–0.83) 0.88 (0.86–0.89)
Specificity 0.90 (0.89–0.91) 0.73 (0.72–0.74) 0.79 (0.78–0.80) 0.80 (0.79–0.82) 0.83 (0.81–0.84)
LR + ve 10.61 (7.28–15.45) 2.91 (2.47–3.42) 4.66 (3.41–6.35) 4.59 (3.41–6.18) 5.86 (4.35–7.89)
LR –ve 0.27 (0.21–0.34) 0.23 (0.19–0.29) 0.18 (0.13–0.24) 0.26 (0.21–0.33) 0.15 (0.12–0.19)
Diagnostic Odds 41.03 (27.96– 27.48 (18.70– 18.93 (13.04– 44.04 (31.27–
13.44 (9.97–18.13)
ratio 60.21) 40.38) 27.48) 62.03)
Random effect
Tau-square (%) 67.71 41.90 65.74 51.61 36.19
Cochrane-Q 107.60 (P = 0.001) 106.84 (P = 0.001) 117.96 (P = 0.001) 67.63 (P = 0.001) 49.54 (P = 0.002)
Spearman’s cor-
0.49 (P = 0.013) 0.12 (P = 0.576) 0.30 (P = 0.183) 0.18 (P = 0.390) 0.46 (P = 0.019)
relation
LR + ve 7.73 (7.05–8.46) 2.98 (2.84–3.12) 4.07 (3.84–4.32) 4.30 (3.97–4.66) 4.64 (4.19–5.12)
LR –ve 0.30 (0.28–0.32) 0.23 (0.21–0.25) 0.18 (0.16–0.20) 0.25 (0.22–0.29) 0.15 (0.13–0.17)
Diagnostic Odds 37.31 (31.63– 13.57 (11.93– 26.24 (22.46– 19.09 (15.61– 42.42 (33.78–
Fixed effect
ratio 44.01) 15.42) 30.65) 23.35) 53.27)
Tau-square 77.70 76.60 82.20 66.00 49.50
Cochrane-Q 107.60 (P = 0.001) 106.84 (P = 0.001) 117.96 (P = 0.001) 67.63 (P = 0.001) 49.54 (P = 0.002)
Symmetrical ROC AUC (SE) 0.91 (0.01) 0.86 (0.02) 0.91 (0.01) 0.88 (0.01) 0.94 (0.01)
(SROC) Q* index (SE) 0.84 (0.01) 0.79 (0.02) 0.84 (0.01) 0.81 (0.01) 0.87 (0.01)
Table 2. Comparison of diagnostic measures by three serum markers. Human epididymis secretory protein
4 (HE4), Cancer antigen (CA125) and Risk of Ovarian Malignancy Algorithm (ROMA). Positive Likelihood
ratio (LR + ve), Negative Likelihood ratio (LR–ve), Standard error (SE).
presence versus the absence of true heterogeneity (between studies variability) can affect the statistical model.
Therefore, we calculated inconsistency (I2) statistics in percentage values along with Tau-square, which suggests
the degree of heterogeneity. Value of an I2-statistic higher than 50% considered to have significant heterogene-
ity. We used a random-effect model for calculations because of variation evidence. Since the studies included
might have used directly or implicitly different thresholds/cutoff values to define positive and negative results,
these cutoff values are likely to be an essential source of variation in DOR. We carried out receiver operating
characteristics (ROC) analysis to see if a threshold effect exists. If the points in the ROC plot show a curvilinear
pattern, there is evidence of threshold effect.
Further, we tested the threshold effect based on the Spearman correlation coefficient between sensitivity (true
positive rate) and false positive rate (FPR). A significant inverse correlation could confirm the existence of the
threshold effect. Combining study results in these cases involves fitting a ROC curve rather than pooling sensitivi-
ties and specificities or likelihood ratios. While establishing homogeneity, likelihood ratios and diagnostic odds
ratios could be pooled by the Mantel–Haenszel method (fixed effects model); in case of heterogeneity, we used
the DerSimonian Laird method (random-effects model) to incorporate variation among studies. The DOR’s or
LR’s were averaged with the Mantel–Haenszel method, whereas, by adopting the DerSimonian Laird method, we
Scientific Reports | (2021) 11:17308 | https://doi.org/10.1038/s41598-021-96552-9 4
Vol:.(1234567890)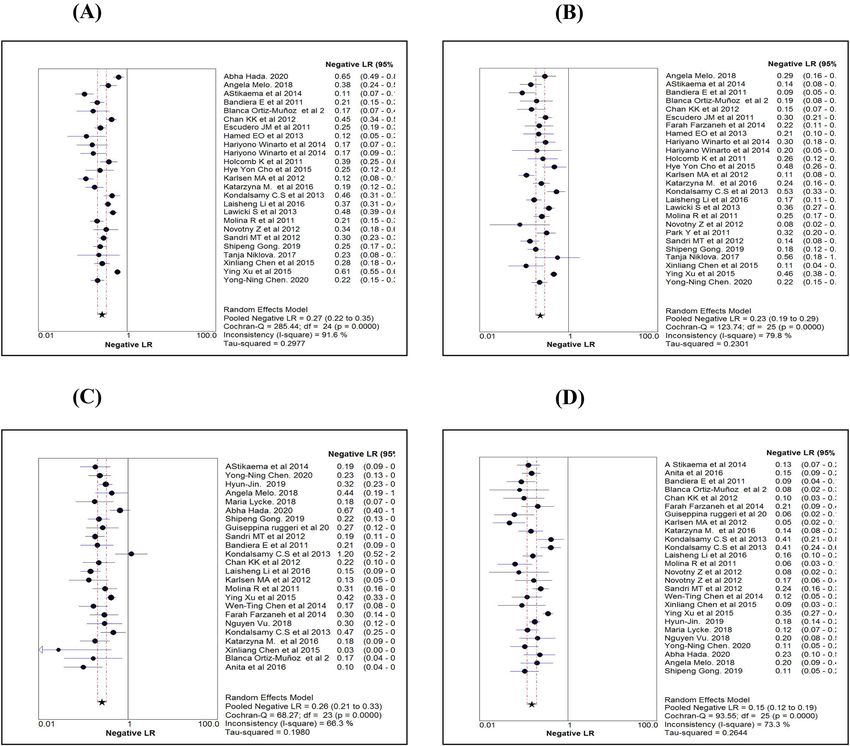
www.nature.com/scientificreports/
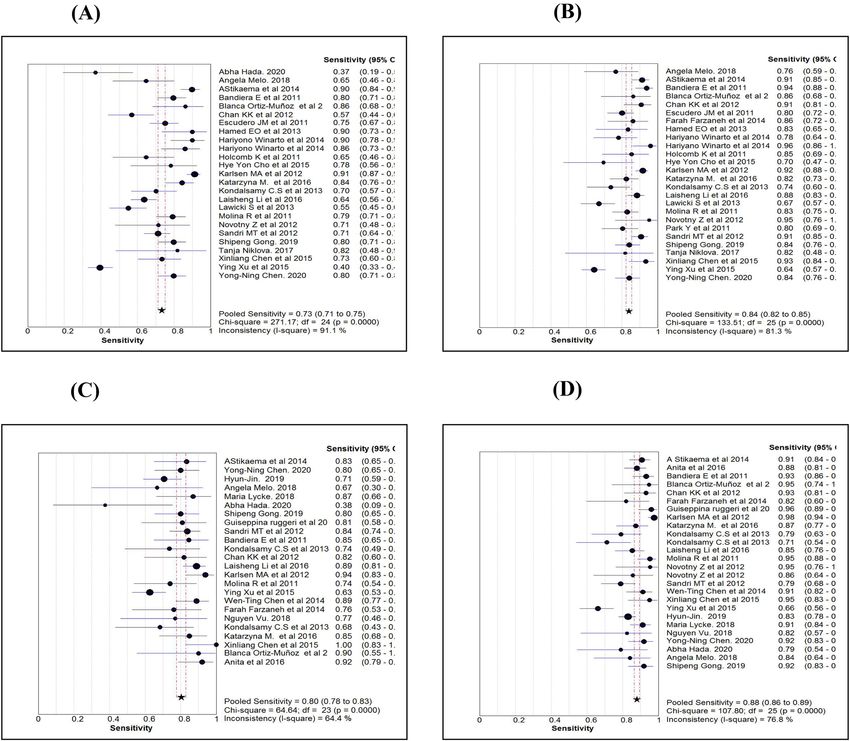
Figure 3. Comparison of Sensitivity estimates of HE4 (A), CA125 (B), ROMA for pre-menopause (C) and
ROMA for post-menopause (D).
obtained the average value of logs of DOR or LR’s. Publication bias between the studies was tested by carrying
out a regression analysis of ln(DOR) against the inverse of the square root of effective sample size (1/sqrt(ESS)),
with p < 0.05 for slope coefficient suggesting significant asymmetry. We carried out all these analyses following
the guidelines given by an earlier p ublication14.
Meta‑regression. In case of great variation detected from the analysis detailed above, we explored reasons
for such variations by relating covariates such as the age of subjects and cutoff values. To study the sources of
variations in the studies, we used the Moses–Shapiro–Littenberg method. We considered the variable ln(DOR)
as the dependent variable and the variables such as age, cutoff value and threshold effect as covariates. The
antilogarithm transformations of the resulting estimated parameters were a relative DOR (RDOR) of the cor-
responding covariate, which suggests the change in the test understudy’s diagnostic performance for each unit
increase in the covariate. We decided the statistical significance of the coefficient based on a p value < 0.05.
Results
Baseline characteristics of the study population. We searched the studies that were published from
January 2011 to August 2020. PRISMA flow-diagram (Fig. 1) shows the stages of the studies screened and
included for the analysis, and 32 studies15–46 met the inclusion criteria. The number of studies included for HE4,
CA125 and ROMA tests were 2516–19,22–32,34,35,37–43, 2616–20,22–35,37–41,43 and 2215–18,20,21,26–29,31,34–43,46, respectively.
The patients with EOC were taken as cases, and women with benign ovarian mass were taken as control, which
was 2233/5682, 2315/5875 and 2281/5068, respectively, for the markers or algorithm (Table 1). The average age
of cases and controls were 54 and 43 years, respectively. Stage-specific distribution showed that about 31% of the
EOC cases were with stage III, followed by stage IV (~ 14%). Similarly, about 35% EOC cases were serous type
Scientific Reports | (2021) 11:17308 | https://doi.org/10.1038/s41598-021-96552-9 5
Vol.:(0123456789)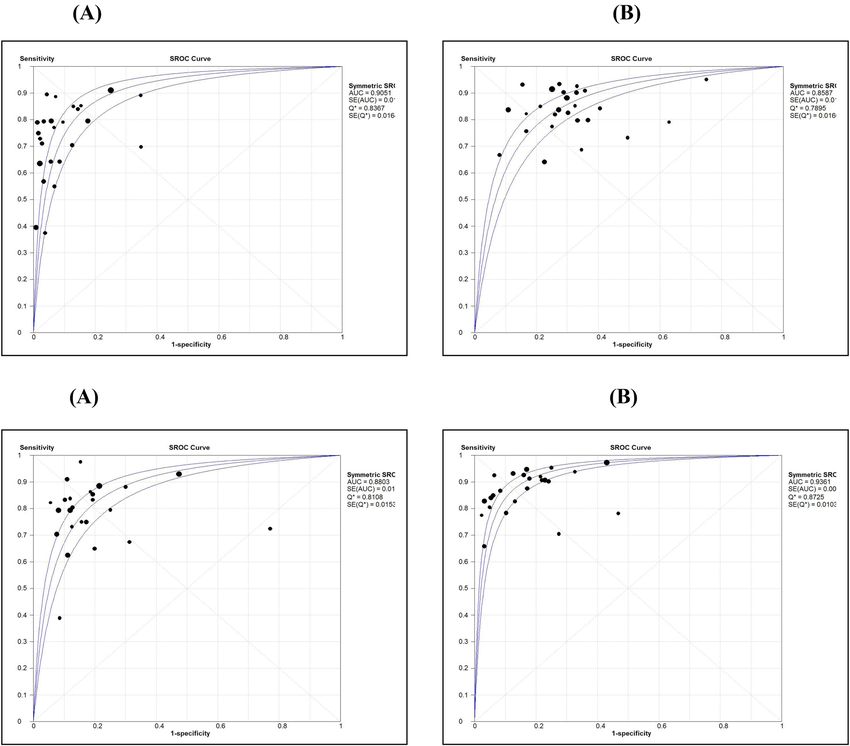
www.nature.com/scientificreports/

                                            Figure 4.  Comparison of Specificity estimates of HE4 (A), CA125 (B), ROMA for pre-menopause (C) and
                                            ROMA for post-menopause (D).

                                            followed by endometroid (~ 11%). We assessed each study’s quality on six domains and have shown the overall
                                            risk of biases in the QUADAS-2 graph (Fig. 2). About 75% of the studies included showed a low risk of bias for
                                            selecting the reference standard.

                                            Comparison of diagnostic measures. Table 2 shows the various diagnostic tests calculated for the
                                            three markers or algorithm and pooled estimates of each measure. While comparing the sensitivity measures
                                            (Figs. 3A–D), the overall sensitivity for HE4 was 0.73 (95% CI 0.71–0.75), significantly less than CA125 and
                                            ROMA. In contrast to the sensitivity measure, the overall specificity for HE4 (0.90; 95% CI 0.89–0.91) was sig-
                                            nificantly higher than the other two markers (Fig. 4A–D). While comparing the diagnostic measures between
                                            premenopausal and postmenopausal women using ROMA, we noted that both the sensitivity and specificity
                                            levels were more than 0.80 among postmenopausal women and were significantly higher than those measured
                                            among premenopausal women.
                                                The likelihood ratio is another way of looking at the reliability of the test. LR expression has two forms.
                                            LR + (the probability of a person who has the disease testing positive divided by the probability of a person
                                            who does not have the disease testing positive) and LR- (the probability of a person who has the disease testing
                                            negative divided by the probability of a person who does not have the disease testing negative). Comparison
                                            of pooled LR + values obtained using a random-effect model among the markers (Table 2) revealed that for
                                            the HE4 maker, LR + was significantly higher than that of CA125 and ROMA. Using HE4, the likelihood of
                                            a woman diagnosed with EOC is about 11 times, given the woman test positive compared to a false positive
                                            woman. Further, LR + for HE4 is more than the recommended level (5.0), which was observed in the majority
                                            of the studies (84%) (Fig. 5A). Pooled LR + and it’s 95% confidence limits (CI) for HE4, CA125 and ROMA were

          Scientific Reports |   (2021) 11:17308 |              https://doi.org/10.1038/s41598-021-96552-9                                                6

Vol:.(1234567890)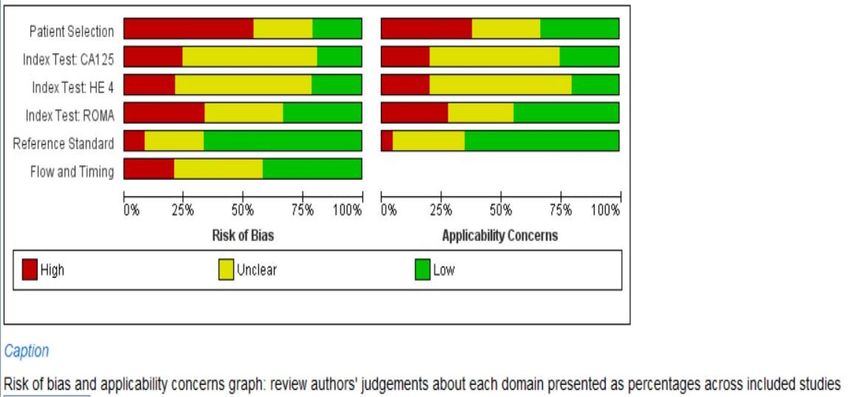
www.nature.com/scientificreports/
Figure 5. Comparison of positive likelihood ratio estimates (using Random effect model) of HE4 (A), CA125
(B), ROMA for pre-menopause (C) and ROMA for post-menopause (D).
10.61 (7.28–15.45), 2.91 (2.47–3.42) and 4.66 (3.41–6.35), respectively (Table 2). Only 11% of the studies with
CA125 (Fig. 5B) showed LR + more than 5.0. Using ROMA marker, about 46% of the studies with premenopausal
women (Fig. 5C) and 65% of the studies with postmenopausal women (Fig. 5D) showed LR + ve more than 5.0.
Pooled LR-of all the three markers or algorithm were in the range between 0.18 and 0.27 (Table 2), implying that
all the three were behaving similarly for ruling out the disease as evident by overlapping CI of the three markers
or algorithm. Figure 6A–D shows the forest plots of LR- values using the random effect model for each marker.
As accuracy estimates are paired and often interrelated (sensitivity and specificity, or LR positive and LR nega-
tive), it is necessary to report these simultaneously with a single measure. One accuracy measure that combines
these paired measures is the diagnostic odds ratio (DOR). Individual study wise and pooled DOR with 95% CI
for each marker are shown in Fig. 7A–D. Using the random effect model, pooled DOR for HE4 was 41.03 (95%
CI 27.96–60.21), which was markedly higher compared to DOR of CA125 (13.44) and ROMA (27.48). Similarly,
areas under the curve (AUC) using symmetrical ROC (SROC) analysis were 0.91, 0.86 and 0.91 for HE4, CA125
and ROMA, respectively (Table 2).
Test of heterogeneity for the markers or algorithm showed that the values of test statistics tau-square or
I2-statistics were more significant than the allowable limit (50%), suggesting heterogeneity between the studies.
Therefore, diagnostics measures obtained by the random effect model were retained. Spearman rank correlation
coefficient between sensitivity and FPR showed that only for HE4, the correlation coefficient was significant
(r = 0.49; p = 0.013) (Table 2). Regression analysis of diagnostic threshold also revealed that slope was significant
(p < 0.05) for HE4 (Table 3). These observations showed that there was no evidence of a strong threshold effect
on DOR. Further, the ROC curve (Fig. 8A–D) showed no clear evidence of a curve-linear pattern for any of the
markers confirming that DOR measures were independent of the threshold effect.
Scientific Reports | (2021) 11:17308 | https://doi.org/10.1038/s41598-021-96552-9 7
Vol.:(0123456789)www.nature.com/scientificreports/
Figure 6. Comparison of negative likelihood ratio estimates (using Random effect model) of HE4 (A), CA125
(B), ROMA for pre-menopause (C) and ROMA for post-menopause (D).
Meta‑regression analysis to assess the source of heterogeneity. Since there was heterogeneity
between the studies for the markers, we carried out meta-regression analysis to evaluate causes responsible for
heterogeneity. Table 3 shows the results of the meta-regression analysis. The regression coefficient for the cutoff
values of HE4 was statistically significant, showing the influence of cutoff value for the noted heterogeneity.
However, neither age nor cutoff value was found to be statistically significant for CA125 and ROMA markers.
Both threshold analysis and meta-regression analysis revealed the significant importance of cutoff value for HE4.
Publication bias assessment. We assessed publication bias by carrying out a regression analysis of
ln(DOR) against the inverse of the sample size’s square root, and Table 4 shows the results. Slope coefficients for
all the markers were not significant at p < 0.10, which is the probability level suggestive of significant publication
bias. Therefore, there was no evidence of publication bias for any of the markers or algorithm.
Comparison of diagnostic measures between premenopausal and postmenopausal
women. The majority of the studies reported test results separately for premenopausal and postmenopausal
women for ROMA. A similar analysis for ROMA showed that the diagnostic measures such as sensitivity, speci-
ficity, LR + , DOR and SROC (Table 2) were markedly high for postmenopausal women than premenopausal
women. LR was the lowest value (0.15) for postmenopausal women compared to the value (0.26) for premeno-
pausal women. The threshold effect for DOR was not established, and heterogeneity was present for both groups.
Cutoff value was not found to be an influencing factor for the observed heterogeneity. Since average age was not
available separately, we could not carry out meta-regression to establish whether the age was influencing hetero-
geneity. Further, we could not observe publication biases for either type of study women.
Scientific Reports | (2021) 11:17308 | https://doi.org/10.1038/s41598-021-96552-9 8
Vol:.(1234567890)www.nature.com/scientificreports/
Figure 7. Comparison of diagnostic odds ratio estimates (using Random effect model) of HE4 (A), CA125 (B),
ROMA for pre-menopause (C) and ROMA for post-menopause (D).
Sensitivity analysis. We carried out the sensitivity analysis to confirm the consistency of the results by
considering only blinded studies, which were free from biased observations. The numbers of studies blinded
were 1716–18,23–29,32,35–41, 1916–18,20,23–29,32,33,35–41 and 1515–18,20,26–29,34,35,37–40 for HE4, CA125 and ROMA, respec-
tively. The meta-analysis of the blinded studies using the random-effect model is shown in Table 5. Comparing
the results presented in Tables 2 and 5 showed that all the diagnostic measures such as sensitivity, specificity
and DOR obtained for blinded studies were within 95% confidence limits of each measure presented in Table 2.
Further, the presence of heterogeneity was confirmed among blinded studies also. There was no significant
variation in Spearman rank correlation coefficients and regression analysis of threshold effects between com-
bined studies and blinded studies. We could make similar observations while carrying out meta-regression
and SROC analysis also. These findings implied that all the diagnostic measures were consistent irrespective of
blinding nature.
Discussion
Summary of diagnostic measures. Our study found ROMA as the best marker to differentiate EOC
from benign ovarian masses with high diagnostic accuracy (DOR-44.04, sensitivity-0.88 and AUC-0.94) as com-
pared to HE4 (DOR-41.03, sensitivity-0.73 and AUC-0.91) and CA125 (DOR-13.44, specificity-0.84 and AUC-
0.86) in postmenopausal women. In premenopausal women, DOR, specificity and AUC for HE4 was highest,
suggesting it as a promising predictor of Epithelial ovarian cancer in this group; however, its utilisation requires
further exploration.
Scientific Reports | (2021) 11:17308 | https://doi.org/10.1038/s41598-021-96552-9 9
Vol.:(0123456789)www.nature.com/scientificreports/
ROMA ROMA
Variable HE4 CA125 ROMA (ALL) (pre-menopause) (post-menopause)
Analysis of diagnostic odds ratio (DOR)
Constant (SE) 3.27 (0.24)* 2.64 (0.19)* 3.35 (0.21)* 2.91 (0.20)* 3.85 (0.18)*
Slope (SE) − 0.29 (0.11)* − 0.06 (0.16) − 0.10 (0.17) − 0.17 (0.17) − 0.17 (0.13)
Tau-square 0.50 0.42 0.75 0.57 0.40
Meta regression with cutoff value as covariate#
Tau-square 0.36 0.45 0.84 0.64 0.46
Constant (SE) 1.31 (0.65) 2.76 (0.35)* 2.18 (1.60) 2.49 (0.88)* 3.67 (1.81)
S coefficient (SE) − 0.14 (0.12) − 0.14 (0.16) − 0.03 (0.20) − 0.12 (0.18) − 0.16 (0.14)
Cutoff (SE) 0.02 (0.01)* − 0.002 (0.01) 0.06 (0.08) 0.04 (0.08) 0.007 (0.06)
Meta regression with age as covariate#
Tau-square 0.81 0.51 1.06
Constant (SE) 2.57 (1.79) 1.60 (1.51) 1.63 (2.18) Could not be carried out due to non-availability of Age details separately for pre-menopause and post-
S coefficient (SE) − 0.31 (0.16) − 0.24 (0.19) − 0.24 (0.25) menopause status
Age (SE) 0.01 (0.03) 0.03 (0.03) 0.03 (0.04)
Meta regression with cutoff value and age as covariates#
Tau-square 0.49 0.78 1.30
Constant (SE) 1.01 (1.57) 1.62 (2.93) 1.21 (2.65)
Could not be carried out due to non-availability of Age details separately for pre-menopause and post-
S coefficient (SE) − 0.18 (0.15) − 0.30 (0.25) − 0.15 (0.35)
menopause status
Cutoff (SE) 0.03 (0.01)* 0.02 (0.09) 0.05 (0.12)
Age (SE) − 0.003 (0.03) 0.013 (0.04) 0.02 (0.05)
Table 3. Results of meta regression analysis to assess causes of heterogeneity. *Coefficients are statistically
significant at P < 0.05, Human epididymis secretory protein 4 (HE4), Cancer antigen (CA125) and Risk of
Ovarian Malignancy Algorithm (ROMA). Standard error (SE). # Meta-regression was weighted by the inverse
of the variance of diagnostic Odds Ratio and between study variance was estimated by Random Effect Model
(REML).
Strengths. In this meta-analysis, we evaluated a good number of studies, which adds more weight to our
results. Pertinent features of our study are the approach that has been used to search the articles and the statisti-
cal methods that are used to analyse the data. Other salient features of our study are that we had only included
studies that used CLIA/ECLIA for measuring CA-125 and HE4, which reduced the bias that arise due to differ-
ent testing strategies and also, we used only patients with EOC as cases and Benign ovarian masses as controls.
Limitation. We did not consider unpublished and studies in foreign languages. Therefore, we could not
calculate diagnostic measures for HE4 and CA125 in the premenopausal and postmenopausal group separately
using the few studies. Further, we did not assess the diagnostic efficiency of these markers stratified by the stage
and type of tumour because of the availability of only a few studies.
Interpretation. The first meta-analysis to compare the diagnostic efficiency of HE4 compared to CA125
was published in January 2012 by Yu et al.47. They postulated that HE4 was a better marker than CA125 for
sensitivity, specificity, LR + and LR−. Their study had methodological limitation like the inclusion of healthy
subjects in the control group, and more than one index test was used. The pooling of such studies can cause
increased variation among the studies. Later, Li et al.48, who did a meta-analysis based on 11 studies in 2012,
stated that ROMA had high diagnostic accuracy in distinguishing EOC from benign pelvic masses. They also
suggested that ROMA had higher sensitivity than HE4 and more accuracy in the postmenopausal age group
than the premenopausal age group, as seen in our study. In 2014, Wang et al.49 also inferred similar findings and
postulated that HE4 had more specificity than CA125 and could be of diagnostic importance, especially in the
premenopausal group. A few months later, Macedo et al.50 published a meta-analysis and postulated that HE4
is a useful predictor of benign or malignant pelvic masses with AUC (0.91) similar to that seen in our study for
premenopausal women. Substantiating our findings, a meta-analysis conducted by Liu et al. that included 17
studies also showed HE4 as a promising biomarker for endometrial cancer with high specificity, DOR and AUC
51
. A study conducted by Niveditha et al. proposed that preoperative low HE4 and biopsy has a high predictive
value than preoperative MRI and intraoperative biopsy combined52. In another systematic review conducted by
Degez et al., it was found that serum HE4 was a crucial parameter in assessing diagnosis, prognosis and survival
of endometrial c ancer53. Later in 2016, Dayyani et al.54 advanced that ROMA had higher diagnostic performance
than other single marker assays based on the basis of AUC and would thus improve clinical decision making.
Ovarian cancer is the fifth most common cause for cancer deaths among women. It is very important to dif-
ferentiate malignant and benign ovarian mass at an early stage as the risk of malignancy increases with age55.
CA 125 has low sensitivity in early stages and also falsely elevated in non-malignant conditions. Whereas HE4
has higher specificity when compared to CA 125, but it is also increased in smokers and women who are on
Scientific Reports | (2021) 11:17308 | https://doi.org/10.1038/s41598-021-96552-9 10
Vol:.(1234567890)www.nature.com/scientificreports/
Figure 8. Comparison of Area Under Curve (AUC) by symmetric ROC analysis for HE4 (A), CA125 (B),
ROMA for pre-menopause (C) and ROMA for post-menopause (D).
Bias coefficient (SE) P value Intercept (SE) P value
HE4 − 4.45 (7.46) 0.557 4.10 (0.56) 0.001
CA125 − 9.90 (5.79) 0.100 3.30 (0.44) 0.001
ROMA − 15.30 (9.16) 0.110 4.32 (0.64) 0.001
ROMA-pre-menopause 0.24 (6.89) 0.973 3.00 (0.64) 0.001
ROMA-post-menopause − 3.42 (4.99) 0.499 4.24 (0.51) 0.001
Table 4. Statistical tests for publication bias by regression analysis of ln(DOR) against inverse of square root
of effective sample size. Human epididymis secretory protein 4 (HE4), Cancer antigen (CA125) and Risk of
Ovarian Malignancy Algorithm (ROMA). Standard error (SE).
oral contraceptives56,57. On the other hand, ROMA has better diagnostic performance when compared to single
marker assays and hence can be the diagnostic tool in EOC for postmenopausal women. In premenopausal
women, HE4 is a better marker to differentiate malignant from benign ovarian masses.
Scientific Reports | (2021) 11:17308 | https://doi.org/10.1038/s41598-021-96552-9 11
Vol.:(0123456789)www.nature.com/scientificreports/
Name of marker ROMA
ROMA ROMA
Statistics (95% CI) HE4 CA 125 ROMA All Pre-menopause Post-menopause
Sensitivity 0.73 (0.71–0.75) 0.85 (0.83–0.87) 0.85 (0.83–0.87) 0.82 (0.79–0.85) 0.87 (0.85–0.89)
Specificity 0.89 (0.88–0.90) 0.70 (0.69–0.72) 0.75 (0.73–0.76) 0.75 (0.73–0.77) 0.81 (0.80–0.83)
LR + ve 9.37 (5.90–14.88) 2.61 (2.17–3.13) 4.39 (2.94–6.56) 4.19 (2.91–6.01) 5.56 (3.81–8.11)
LR –ve 0.26 (0.19–0.36) 0.22 (0.16–0.30) 0.18 (0.12–0.26) 0.23 (0.16–0.32) 0.16 (0.11–0.22)
Diagnostic odds ratio 37.88 (23.89–60.05) 12.38 (8.48–18.08) 25.70 (14.91–44.27) 19.44 (11.42–33.11) 38.21 (24.05–60.70)
Tau-square (%) 76.1 78.3 94.15 73.4 52.5
Cochrane-Q 66.94 (P = 0.001) 82.84 (P = 0.001) 105.26 (P = 0.001) 56.39 (P = 0.001) 40.46 (P = 0.001)
Spearman’s correlation 0.57 (P = 0.017) − 0.07 (P = 0.778) 0.07 (P = 0.791) 0.07 (P = 0.791 0.35 (P = 0.171)
Symmetrical ROC (SROC)
AUC (SE) 0.90 (0.01) 0.83 (0.03) .91 (0.019) 0.89 (0.02) 0.93 (0.012)
Q* index 0.83 (0.02) 0..76 (0.03) 0..84 (0.021) 0.82 (0.02) 0.86 (0.015)
Table 5. Results of sensitivity analysis based on blinded studies using Random effect model. Human
epididymis secretory protein 4 (HE4), Cancer antigen (CA125) and Risk of Ovarian Malignancy Algorithm
(ROMA). Positive Likelihood ratio (LR + ve), Negative Likelihood ratio (LR–ve), Standard error (SE), Receiver
operating characteristic curve (ROC), Area under curve (AUC).
Conclusion
The study infers that ROMA is superior to HE4 and CA125in the postmenopausal group in distinguishing EOC
from benign ovarian tumors. HE4 appears to be superior to CA125with diagnostic accuracy and prediction of
EOC in the premenopausal group.
Received: 19 February 2020; Accepted: 9 August 2021
References
1. Cancer today [Internet]. 2019 [cited 2019 Jan 30]. http://gco.iarc.fr/today/home.
2. Jindal, D., Sahasrabhojanee, M., Jindal, M. & D’Souza, J. Epidemiology of epithelial ovarian cancer: A tertiary hospital based study
in Goa, India. Int. J. Reprod. Contracept. Obstet. Gynecol. 6(6), 2541. https://doi.org/10.18203/2320-1770.ijrcog20172348 (2017).
3. Saini, S. K., Srivastava, S., Singh, Y., Dixit, A. K. & Prasad, S. N. Epidemiology of epithelial ovarian cancer, a single institution-based
study in India. Clin. Cancer Investig. J. 5, 20–24. https://doi.org/10.4103/2278-0513.172078 (2016).
4. Jacobs, I. & Bast, R. C. The CA 125 tumour-associated antigen: A review of the literature. Hum. Reprod. 4(1), 1–12. https://doi.
org/10.1093/oxfordjournals.humrep.a136832 (1989).
5. Peng, D., Xu, T., Mason, T. J. & Wu, W. A study of ovarian cancer biomarker amplification using ultrasound for early stage detec-
tion. Ultrasonics 54(2), 451–454. https://doi.org/10.1016/j.ultras.2013.05.014 (2014).
6. Liao, J. B. et al. Detection of the HE4 protein in urine as a biomarker for ovarian neoplasms: Clinical correlates. Gynecol. Oncol.
137(3), 430–435. https://doi.org/10.1016/j.ygyno.2015.03.044 (2015).
7. Ovarian Cancer—AACC.org [Internet]. [cited 2019 Jan 30]. https://www.aacc.org/publications/cln/articles/2013/march/ovari
an-cancer.
8. Bouchard, D., Morisset, D., Bourbonnais, Y. & Tremblay, G. M. Proteins with whey-acidic-protein motifs and cancer. Lancet Oncol.
7(2), 167–174. https://doi.org/10.1016/S1470-2045(06)70579-4 (2006).
9. Abdalla, N. et al. Analysis of serum level of HE4 and CA125 considering selected risk factors among patients with endometrioid
endometrial cancer. Contemp. Oncol. 20(6), 463–467 (2016).
10. Li, X. Y. Application of chemiluminescence method to testing environmental samples. J. Environ. Coll. China 22, 54–56 (2012).
11. Wei, S., Li, H. & Zhang, B. The diagnostic value of serum HE4 and CA125 and ROMA index in ovarian cancer. Biomed. Rep. 5,
41–44 (2016).
12. Moore, R. G. et al. The use of multiple novel tumour biomarkers for the detection of ovarian carcinoma in patients with a pelvic
mass. Gynecol. Oncol. 108(2), 402–408. https://doi.org/10.1016/j.ygyno.2007.10.017 (2008).
13. Montagnana, M. et al. The ROMA (Risk of Ovarian Malignancy Algorithm) for estimating the risk of epithelial ovarian cancer
in women presenting with pelvic mass: Is it really useful?. Clin. Chem. Lab. Med. 49(3), 521–525. https://doi.org/10.1515/CCLM.
2011.075 (2011).
14. Zamora, J., Abraira, V., Muriel, A., Khan, K. & Coomarasamy, A. Meta-DiSc: A software for meta-analysis of test accuracy data.
BMC Med. Res. Methodol. 6, 31. https://doi.org/10.1186/1471-2288-6-31 (2006).
15. Chudecka-Głaz, A., Cymbaluk-Płoska, A., Luterek-Puszyńska, K. & Menkiszak, J. Diagnostic usefulness of the risk of ovarian
malignancy algorithm using the electrochemiluminescence immunoassay for HE4 and the chemiluminescence micro particle
immunoassay for CA125. Oncol. Lett. 12(5), 3101–3114. https://doi.org/10.3892/ol.2016.5058 (2016).
16. Bandiera, E. et al. Serum human epididymis protein 4 and risk for ovarian malignancy algorithm as new diagnostic and prognostic
tools for epithelial ovarian cancer management. Cancer Epidemiol. Biomark. Prev. 20(12), 2496–2506. https://doi.org/10.1158/
1055-9965.EPI-11-0635 (2011).
17. Ortiz-Muñoz, B. et al. HE4, Ca125 and ROMA algorithm for differential diagnosis between benign gynaecological diseases and
ovarian cancer. Tumour Biol. 35(7), 7249–7258. https://doi.org/10.1007/s13277-014-1945-6 (2014).
18. Chan, K. K. L. et al. The use of HE4 in the prediction of ovarian cancer in Asian women with a pelvic mass. Gynecol. Oncol. 128(2),
239–244. https://doi.org/10.1016/j.ygyno.2012.09.034 (2013).
19. Escudero, J. M. et al. Comparison of serum human epididymis protein 4 with cancer antigen 125 as a tumour marker in patients
with malignant and nonmalignant diseases. Clin. Chem. 57(11), 1534–1544. https://d oi.o
rg/1 0.1 373/c linch
em.2 010.1 57073 (2011).
20. Farzaneh, F. et al. Preoperative evaluation of risk of ovarian malignancy algorithm index in prediction of malignancy of adnexal
masses. Iran. Red Crescent Med. J. https://doi.org/10.5812/ircmj.17185 (2014).
Scientific Reports | (2021) 11:17308 | https://doi.org/10.1038/s41598-021-96552-9 12
Vol:.(1234567890)www.nature.com/scientificreports/
21. Ruggeri, G. et al. HE4 and epithelial ovarian cancer: Comparison and clinical evaluation of two immunoassays and a combination
algorithm. Clin. Chim. Acta 412(15–16), 1447–1453. https://doi.org/10.1016/j.cca.2011.04.028 (2011).
22. Hamed, E. O. et al. Significance of HE4 estimation in comparison with CA125 in diagnosis of ovarian cancer and assessment of
treatment response. Diagn. Pathol. 8(1), 11. https://doi.org/10.1186/1746-1596-8-11 (2013).
23. Winarto, H., Laihad, B. J. & Nuranna, L. Modification of cutoff values for HE4, CA125, the risk of malignancy index, and the risk
of malignancy algorithm for ovarian cancer detection in Jakarta, Indonesia. Asian Pac. J. Cancer Prev. 15(5), 1949–1953. https://
doi.org/10.7314/apjcp.2014.15.5.1949 (2014).
24. Holcomb, K., Vucetic, Z., Miller, M. C. & Knapp, R. C. Human epididymis protein 4 offers superior specificity in the differentiation
of benign and malignant adnexal masses in premenopausal women. Am. J. Obstet. Gynecol. 205(4), 358.e1-358.e6. https://doi.org/
10.1016/j.ajog.2011.05.017 (2011).
25. Cho, H. Y. et al. Comparison of HE4, CA125, and risk of ovarian malignancy algorithm in the prediction of ovarian cancer in
Korean women. J. Korean Med. Sci. 30(12), 1777. https://doi.org/10.3346/jkms.2015.30.12.1777 (2015).
26. Karlsen, M. A. et al. Evaluation of HE4, CA125, risk of ovarian malignancy algorithm (ROMA) and risk of malignancy index
(RMI) as diagnostic tools of epithelial ovarian cancer in patients with a pelvic mass. Gynecol. Oncol. 127(2), 379–383. https://doi.
org/10.1016/j.ygyno.2012.07.106 (2012).
27. Terlikowska, K. M. et al. Preoperative HE4, CA125 and ROMA in the differential diagnosis of benign and malignant adnexal
masses. J. Ovarian Res. 9(1), 43. https://doi.org/10.1186/s13048-016-0254-7 (2016).
28. Kondalsamy-Chennakesavan, S., Hackethal, A., Bowtell, D. & Obermair, A. Differentiating stage 1 epithelial ovarian cancer from
benign ovarian tumours using a combination of tumour markers HE4, CA125, and CEA and patient’s age. Gynecol. Oncol. 129(3),
467–471. https://doi.org/10.1016/j.ygyno.2013.03.001 (2013).
29. Li, L. et al. Value of serum human epididymis secretory protein 4 as a marker for differential diagnosis of malignant and benign
gynecological diseases of patients in southern China. Clin. Chim. Acta 459, 170–176. https://doi.org/10.1016/j.cca.2016.06.010
(2016).
30. Ławicki, S., Będkowska, G. E., Gacuta-Szumarska, E. & Szmitkowski, M. The plasma concentration of VEGF, HE4 and CA125 as
a new biomarkers panel in different stages and sub-types of epithelial ovarian tumours. J. Ovarian Res. 6(1), 45. https://doi.org/
10.1186/1757-2215-6-45 (2013).
31. Molina, R. et al. HE4 a novel tumour marker for ovarian cancer: Comparison with CA 125 and ROMA algorithm in patients with
gynaecological diseases. Tumor Biol. 32(6), 1087–1095. https://doi.org/10.1007/s13277-011-0204-3 (2011).
32. Novotny, Z. et al. HE4 and ROMA index in Czech postmenopausal women. Anticancer Res. 32(9), 4137–4140 (2012).
33. Park, Y., Lee, J. H., Hong, D. J., Lee, E. Y. & Kim, H. S. Diagnostic performances of HE4 and CA125 for the detection of ovarian
cancer from patients with various gynecologic and non-gynecologic diseases. ClinBiochem 44(10–11), 884–888. https://doi.org/
10.1016/j.clinbiochem.2011.04.011 (2011).
34. Sandri, M. T. et al. Comparison of HE4, CA125 and ROMA algorithm in women with a pelvic mass: Correlation with pathological
outcome. Gynecol. Oncol. 128(2), 233–238. https://doi.org/10.1016/j.ygyno.2012.11.026 (2013).
35. Stiekema, A. et al. A predictive model combining human epididymal protein 4 and radiologic features for the diagnosis of ovarian
cancer. Gynecol. Oncol. 132(3), 573–577. https://doi.org/10.1016/j.ygyno.2014.01.005 (2014).
36. Chen, W. T. et al. HE4 as a serum biomarker for ROMA prediction and prognosis of epithelial ovarian cancer. Asian Pac. J. Cancer
Prev. 15(1), 101–105. https://doi.org/10.7314/apjcp.2014.15.1.101 (2014).
37. Chen, X. et al. Development of a multimarker assay for differential diagnosis of benign and malignant pelvic masses. Clin. Chim.
Acta 440, 57–63. https://doi.org/10.1016/j.cca.2014.11.013 (2015).
38. Xu, Y. et al. Modification of cutoff values for HE4, CA125 and the ROMA algorithm for early-stage epithelial ovarian cancer detec-
tion: Results from 1021 cases in South China. Clin. Biochem. 49(1–2), 32–40. https://doi.org/10.1016/j.clinbiochem.2015.07.029
(2016).
39. Shipeng, G., Yongning, C., Yadi, Z., Chanyuan, L. I. & Qifan, J. Nan Fang Yi Ke Da Xue Xue Bao 39(12), 1393–1401. https://doi.
org/10.12122/j.issn.1673-4254.2019.12.02 (2019).
40. Nikolova, T. et al. Diagnostic performance of human epididymis protein 4 compared to a combination of biophysical and biochemi-
cal markers to differentiate ovarian endometriosis from epithelial ovarian cancer in premenopausal women. J. Obstet. Gynaecol.
Res. 43(12), 1870–1879. https://doi.org/10.1111/jog.13466 (2017).
41. Chen, Y. N. et al. Ultrasound features improve diagnostic performance of ovarian cancer predictors in distinguishing benign and
malignant ovarian tumors. Curr. Med. Sci. 40(1), 184–191. https://doi.org/10.1007/s11596-020-2163-7 (2020).
42. Hada, A. et al. Comparison of the predictive performance of risk of malignancy indexes 1–4, HE4 and risk of malignancy algorithm
in the triage of adnexal masses. J. Ovarian Res. 13(1), 46. https://doi.org/10.1186/s13048-020-00643-6 (2020).
43. Melo, Â., Veríssimo, R., Farinha, M., Martins, N. N. & Martins, F. N. Discriminative value of CA-125, HE4, Risk of Malignancy
Index II (RMI-II) and risk of malignancy algorithm (ROMA) in the differential diagnosis of pelvic masses: Conclusions from a
referral Centre in Portugal. J. Obstet. Gynaecol. 38(8), 1140–1145. https://doi.org/10.1080/01443615.2018.1457632 (2018).
44. Lycke, M., Kristjansdottir, B. & Sundfeldt, K. A multicenter clinical trial validating the performance of HE4, CA125, risk of ovarian
malignancy algorithm and risk of malignancy index. Gynecol. Oncol. 151(1), 159–165. https://doi.org/10.1016/j.ygyno.2018.08.
025 (2018).
45. Huy, N. V. Q. et al. Standard and optimal cutoff values of serum ca-125, HE4 and ROMA in preoperative prediction of ovarian
cancer in Vietnam. Gynecol. Oncol. Rep. 25, 110–114. https://doi.org/10.1016/j.gore.2018.07.002 (2018).
46. Choi, H. J. et al. Comparison of CA 125 alone and risk of ovarian malignancy algorithm (ROMA) in patients with adnexal mass:
A multicenter study. Curr. Probl. Cancer 20, 40 (2019).
47. Yu, S., Yang, H. J., Xie, S. Q. & Bao, Y. X. Diagnostic value of HE4 for ovarian cancer: A meta-analysis. Clin. Chem. Lab. Med. 50(8),
1439–1446. https://doi.org/10.1016/j.clinbiochem.2015.07.029 (2012).
48. Li, F. et al. Does risk for ovarian malignancy algorithm excel human epididymis protein 4 and CA125 in predicting epithelial
ovarian cancer: A meta-analysis. BMC Cancer 12, 258. https://doi.org/10.1186/1471-2407-12-258 (2012).
49. Wang, J. et al. Diagnostic accuracy of serum HE4, CA125 and ROMA in patients with ovarian cancer: A meta-analysis. Tumour
Biol. 35(6), 6127–6138. https://doi.org/10.1007/s13277-014-1811-6 (2014).
50. Macedo, A. C. L., da Rosa, M. I., Lumertz, S. & Medeiros, L. R. Accuracy of serum human epididymis protein 4 in ovarian cancer
diagnosis: A systematic review and meta-analysis. Int. J. Gynecol. Cancer 24(7), 1222–1231. https://doi.org/10.1097/IGC.00000
00000000192 (2014).
51. Liu, J., Han, L., Sun, Q., Li, Y. & Niyazi, M. Meta-analysis of the diagnostic accuracy of HE4 for endometrial carcinoma. Eur. J.
Obstet. Gynecol. Reprod. Biol. 252, 404–411. https://doi.org/10.1016/j.ejogrb.2020.07.015 (2020).
52. Rajadevan, N., McNally, O., Neesham, D., Richards, A. & Naaman, Y. Prognostic value of serum HE4 level in the management of
endometrial cancer: A pilot study. Aust. N. Z. J. Obstet. Gynaecol. https://doi.org/10.1111/ajo.13302 (2021).
53. Degez, M. et al. Endometrial cancer: A systematic review of HE4, REM and REM-B. Clin. Chim. Acta. 515, 27–36. https://doi.org/
10.1016/j.cca.2020.12.029 (2021).
54. Dayyani, F. et al. Diagnostic performance of risk of ovarian malignancy algorithm against CA125 and HE4 in connection with
ovarian cancer: A meta-analysis. Int. J. Gynecol. Cancer 26(9), 1586–1593. https://d oi.o
rg/1 0.1 097/I GC.0 00000 00000 00804 (2016).
55. Enakpene, C. A. et al. Preoperative evaluationand triage of women with suspicious adnexal masses using risk ofmalignancy index.
J. Obstet. Gynaecol. Res. 35, 131–138 (2009).
Scientific Reports | (2021) 11:17308 | https://doi.org/10.1038/s41598-021-96552-9 13
Vol.:(0123456789)www.nature.com/scientificreports/
56. Fortner, R. T. et al. Correlates of circulating ovarian cancerearly detection markers and their contribution to discrimination of
earlydetection models: results from the EPIC cohort. J. Ovarian Res. 10, 20 (2017).
57. Ferraro, S., Schiumarini, D. & Panteghini, M. Human epididymis protein 4: Factors of variation. Clin. Chim. Acta. 438, 171–177
(2015).
Author contributions
A.S.-involved in framing hypotheses, screening and selection of the studies, quality assessment and manuscript
writing. V.P.-involved in quality assessment, database management, statistical analysis and manuscript edition of
the final version. P.A.-involved in preparing QUADAS-2 and editing the manuscript. V.S.-involved in database
management and manuscript edition. S.B.-involved in the manuscript edition.
Funding
Any funding agency did not involve in this study.
Competing interests
The authors declare no competing interests.
Additional information
Correspondence and requests for materials should be addressed to V.P.
Reprints and permissions information is available at www.nature.com/reprints.
Publisher’s note Springer Nature remains neutral with regard to jurisdictional claims in published maps and
institutional affiliations.
Open Access This article is licensed under a Creative Commons Attribution 4.0 International
License, which permits use, sharing, adaptation, distribution and reproduction in any medium or
format, as long as you give appropriate credit to the original author(s) and the source, provide a link to the
Creative Commons licence, and indicate if changes were made. The images or other third party material in this
article are included in the article’s Creative Commons licence, unless indicated otherwise in a credit line to the
material. If material is not included in the article’s Creative Commons licence and your intended use is not
permitted by statutory regulation or exceeds the permitted use, you will need to obtain permission directly from
the copyright holder. To view a copy of this licence, visit http://creativecommons.org/licenses/by/4.0/.
© The Author(s) 2021
Scientific Reports | (2021) 11:17308 | https://doi.org/10.1038/s41598-021-96552-9 14
Vol:.(1234567890)You can also read