Processing Online News Streams for Large-Scale Semantic Analysis
←
→
Page content transcription
If your browser does not render page correctly, please read the page content below
Processing Online News Streams for Large-Scale
                   Semantic Analysis
        Miloš Krstajić #1 , Florian Mansmann #2 , Andreas Stoffel #3 , Martin Atkinson ∗4 , Daniel A. Keim #5
                                                              #
                                                                  University of Konstanz
                                                                       Germany
                                                  1
                                                  milos.krstajic@uni-konstanz.de
                                              2
                                               florian.mansmann@uni-konstanz.de
                                               3
                                                 andreas.stoffel@uni-konstanz.de
                                                   5
                                                     daniel.keim@uni-konstanz.de
                                                          ∗
                                                              EC Joint Research Centre
                                                                   Ispra, Italy
                                                      4
                                                          martin.atkinson@jrc.it

   Abstract— While Internet has enabled us to access a vast                  challenges in legal, security and/or political spheres.
amount of online news articles originating from thousands of                    In our concrete case, we obtained a live stream of online
different sources, the human capability to read all these articles           news articles, which are continuously collected by the Euro-
has stayed rather constant. Usually, the publishing industry takes
over the role of filtering this enormous amount of information               pean Media Monitor (EMM) [1]. An interesting aspect of this
and presenting it in an appropriate way to the group of their                data is the fact, that the articles are written in a multitude
subscribers. In this paper, the semantic analysis of such news               of languages. EMM thereby focuses on entity extraction and
streams is discussed by introducing a system that streams online             news clustering approaches in order to cope with this multi-
news collected by the Europe Media Monitor to our proposed                   lingual corpus of news articles. In contrast to EMM, our
semantic news analysis system. Thereby, we describe in detail the
emerging challenges and the corresponding engineering solutions              system is designed to support the user in the following two
to process incoming articles close to real-time. To demonstrate the          tasks using visual representations:
use of our system, the case studies show a) temporal analysis of               A. Since the languages are annotated for each article, by
entities, such as institutions or persons, and b) their co-occurence               means of our system the user can investigate the tempo-
in news articles.
                                                                                   ral and quantitative occurrence of entities, i.e., certain
                       I. I NTRODUCTION                                            persons or institutions, in different languages.
                                                                               B. The system can be used to investigate real-world en-
   Tens of thousands of news articles are published every                          tity relationships and their volatility by assessing co-
day on the internet by thousands of news sources. Acquiring                        occurrences of entities over time.
and reading all this information by human has thus become                       This paper is structured as follows: Section II presents
practically impossible. Human’s internal filtering mechanisms,               related work in the field of news aggregation and visualization.
which are created according to their preferences, interests and              Next, our news streaming system is described in detail in
beliefs, narrow down this vast amount of information to an                   Section III. The system is then (cf. Section IV) demonstrated
acceptable subset. As a result, people usually track only a                  in two real-world case studies of temporal and cross-language
small number of stories from a selected set of news sources,                 comparison of entity occurrences. Finally, Section V summa-
which they consider trustworthy.                                             rizes our contributions and gives an outlook to future work.
   On the other side of this relationship are news providers. In
today’s fast paced world, each news provider publishes, on a
daily basis, the amount of information that is sufficient for an                                  II. R ELATED W ORK
average news consumer. Latest news replace the older ones at                    Currently, there are several approaches that deal with the
higher speed than ever and, therefore, tracking the temporal                 analysis of news articles. A large audience uses so-called news
aspect of the story becomes a hard task.                                     aggregator systems, which provide latest articles clustered
   On the one hand, the vast amount of breaking news, and                    into groups of similar stories from different sources reporting
sources that provide them, require automated methods that will               on the same event. Publicly accessible aggregators such as
facilitate processing of the created information by the user in              Google News [2] or Yahoo News [3] show breaking news
order to regain the overview. But on the other hand, sharing                 of the moment sorted by number of sources and categories.
of the acquired data has to be realized with caution. Certain                Newsmap [4], which uses news aggregated by Google, shows
issues, such as legal or security related, define new constraints.           the data visually encoded into a TreeMap visualization, based
Sharing the data between companies, academic institutions                    on the amount of news in each cluster and category, to which
or other organizations can be a delicate issue, dependent on                 the cluster belongs to. A major drawback of these news
aggregators is that they are dealing only with the latest news, processes 80,000 - 100,000 articles per day, enriching them
i.e. they provide the data for a specific (current) point in with various metadata on which we perform our analysis.
time, there are no possibilities for temporal analysis (or it is Figure 1 presents the overall system architecture. Data
limited) and they don’t give much semantic information about retrieval is realized as an extension to the existing EMM web
the events. service architecture. Incoming data is handled by Java servlet,
The TextMap website, based on Lydia [5], is an entity search which is responsible for two-way communication with the
engine, which provides information about different entities other side from which it receives HTTP post requests. The
(people, places and things) extracted from the news sources. servlet is designed as an external EMM processing node con-
The Europe Media Monitor (EMM) [1] is a multilingual nected to the EMM pipeline, whose web service architecture
news aggregator system, which also provides information is briefly described in [1]. This push technology allows for
about entities, such as people, organizations and geographical immediate retrieval of the new data as soon as it becomes
location mentioned in the news. Websites, which give access available. Additionally, this architecture also allows us to send
to the data collected and processed by EMM are NewsBrief the results of our processing back, where it can be included in
[6] and NewsExplorer [7]. the EMM system. Similar nodes exist in the EMM processing
All of the above mentioned approaches lack or have limited chain and each of them performs a specific processing task on
possibilities for analysis of dynamic change of the information incoming data, which is retrieved from the upstream node, and
published on-line. Also, possibilities for visual exploration outputs processed data to the next node on the downstream.
of collections of news articles, which would make better Queueing and scheduling of jobs is implemented in every
use of human visual system in detecting trends, patterns and node to ensure successful transfers without loss of data. The
relationships in the news space, are also limited. One of the processing node thereby sends back HTTP response status
first approaches that used visualization to depict temporal code 200 to the node on the upstream to acknowledge that the
evolution of themes within collection of documents is The- data was successfully received, understood, and accepted. This
meRiver [8]. In [9], Wise et al. presented the IN-SPIRE visual simple modular architecture allows for easy implementation of
analytics system, which uses spatial visualization of the large new modules (nodes) in the system, or replacement of the old
collection of documents for enhanced analysis. LensRiver [10] ones.
extends the river metaphor from ThemeRiver into an analytical Incoming HTTP post requests are Unicode XML files con-
system for temporal analysis of unstructured text retrieved taining semantically annotated information in the metadata by
from video broadcast news. It deals with evolution of themes modules on the upstream. Very often, several XML documents
over time, their hierarchical structure, and employs different with news metadata are bundled within one incoming XML
visual analytics techniques to perform the analysis. Hetzler et file. We perform splitting of the articles into separate files
al. [11] proposed to visualize the incremental change in the based on the unique article id, which is more suitable for our
data by using highlighting of new (fresh) and old and probably analysis. The XML metadata is also transformed directly in
irrelevant (stale) documents. the servlet to our standardized internal XML format, which is
Temporal analysis of news is not just a question of visual used in our group for the analysis of text.
depiction of news over the time domain, but also a fundamental Our system is running on Solaris 10 on Sun Fire X4600
problem in textual data mining. An issue of considerable M2 x64 server, with 4 AMD Athlon Opteron 8384 CPUs and
interest is analysis of news articles as document streams 32 GB RAM. The storage is realized through a Sun Storage
that arrive continuously over time. Each stream is not only Tek J4400 Array with 32 1 TB hard drives. Apache Tomcat
an independent sequence of documents, but it also exhibits 5.5.27 is used as a servlet container and MySQL 5.4.2-beta.
braided and episodic character [12]. Moreover, in today’s news
B. Data
reporting, most attention is paid to breaking news about the
latest events, which are characterized by fast growth of amount Incoming XML file consists of semantically enriched meta-
of information until a certain peak is reached, and fading data that is of great interest for our analysis, such as entities,
of interest afterwards. A formal approach to model burst of categories, geo-tags, URL of the article, source, publishing
activity of topics appearing as document streams is presented time, date and language. An example file is shown in Figure
in [13]. Furthermore, the propagation of short quotes over 2.
news websites and blogs is analyzed in [14]. People and organizations mentioned in the article are ex-
tracted in the entity recognition process [15], which relies
heavily on multilingual Named Entity Recognition and Clas-
III. N EWS S TREAMING S YSTEM AND DATA sication (NERC) and cross-lingual information aggregation.
They are provided as element, together
A. System
with additional attributes: id, type, count, position, and name.
Europe Media Monitor (EMM) [1] is a news aggregator, Content from the tag and name attribute
which collects news articles from over 2,500 sources in 42 show, respectively, the name of the person or organization,
languages. These hand-selected sources include media portals, as it appears in the entity database and the name variant. The
government websites and commercial news agencies. EMM main reasons for these variations are morphological variants,Fig. 1. News streaming system. News articles are semantically annotated in the pipeline of processing nodes in EMM system and XML metadata is sent in
HTTP posts. On our side, the incoming data is processed within a servlet designed as an external EMM node.
basis for building a hierarchy over a large collection of
http://news.bbc.co.uk/2/hi/asia-pacific/8353451.stm
2009-11-10T19:19+0100
news articles in the future. Every article has a
bbc
Semantic analysis of news articles across multiple languages
en gives the analyst an overview of what’s being talked about in
The method for geolocation recognition and disambiguation
Security in the free text is described in [16].
Incoming data has to be transformed to our internal XML
NorthKorea
Barack Obama It is used to ensure consistency of work within the group, thus
South Korea
within the header. Text of the article, which could be retrieved
using URL information from the metadata, would belong to
Fig. 2. Semantically annotated metadata. Entities, categories and geographic element within of our XML. It should
locations extracted from the news articled are passed as content in appropriate
elements. Each metadata is enriched with additional information, such as
be annotated with attribute type with value section. Further
trigger words, scores, type, etc. processing of the text would split the structure of the text into
other types, such as paragraph, sentence, phrase or token.
In our analysis, we have worked with 5 months of data,
repeated use of the name in the text, spelling mistake or adap- which was collected between June and October 2009. In
tation of the name to local spelling rules. All articles are classi- total, 1,736,246 articles were collected, with 4,980,972 entities
fied into different categories based on combinations of trigger records and 8,847,596 categories records in English, German
words which are provided as a value of the and French. There are 87,472 unique entities and 1,110 unique
attribute within the element. Association of a categories in the database in this period. In total, our collection
news article to certain categories gives additional semantic is created from 979 news sources.
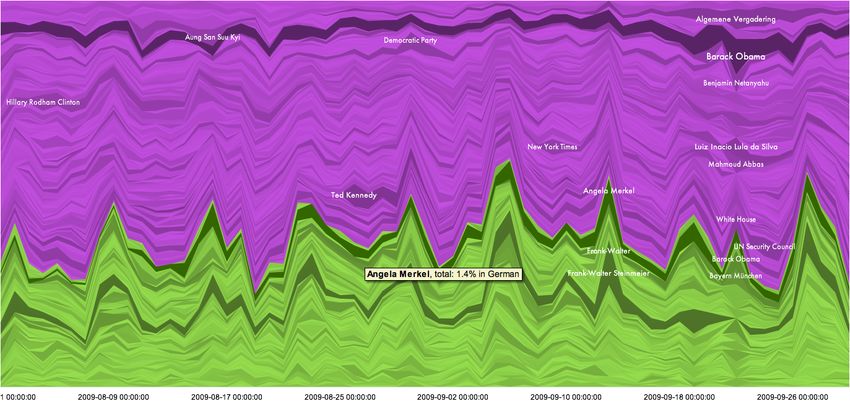
information that can be analyzed further. This is also a logicalFig. 3. Temporal analysis of entities. The x-axis represents time. Each stream represents a separate entity (person or organization). Height (y-value) of the
stream at certain point in time represents share (relative amount). Violet color represents entities mentioned in articles in English, green represents German.
Saturation is mapped to the total number of entities in the whole period. Entities mentioned more than 20 times per day are shown. Data for August and
September 2009 are shown, with daily aggregates.
IV. C ASE S TUDY normalized in order to show share of each entity per day.
We think that using share as a relative measure gives a better
A. Temporal Visual Analysis overview of entity popularity over time. It is also possible
In analyzing the temporal aspect of the news feed, we are to visualize absolute daily values for specific analyst tasks.
interested in the question how did the popularity of people Quick observation of visualization with absolute values can
mentioned in the articles evolve over time. Which people and reveal interesting patterns, such as low traffic on weekends.
organizations were most talked about in the news appearing Looking at the visualization it is easy to spot few highly
in different languages? Are we able to identify people who saturated streams. Another visual clue is given with text
are constantly in the news? Who are the people that had labeling of streams; stream, which has a daily share greater
only temporary popularity in some period of time? How can than a certain value, is labeled with the name of the entity.
the amount of information about these entities be compared? The label is positioned on the middle of the highest value in
Understanding temporal aspect in the analysis of entities is the stream. Inspection of highly saturated streams shows that
an interesting challenge and when we are dealing with such the person most mentioned in the news articles in English
an amount of information, visualizing the results helps in its is Barack Obama. In case of articles in German, most men-
processing and gathering new insights. tioned persons are Angela Merkel, Frank-Walter Steinmeier
Visualizing the temporal data using stacked time series and Barack Obama. Text labeling of entities reveals several
graphs is a well known approach. We employ a simple but other entities that stand out, and some of them have only a
efficient interactive solution based on NameVoyager [17] to temporary popularity. For example, Hilary Clinton was often
show the initial results of our collaboration and potential for in the news in early August while Ted Kennedy, US Senator
future research. from Massachusetts, who passed away on August 25, 2009,
Figure 3 shows streams of entities (people and organiza- was one of the people mentioned the most in the last week of
tions) that were mentioned in the news articles in August August.
and September 2009, from news sources from all over the Interactive features of the tool allow the user to get ad-
world that publish in English (violet) and German (green). ditional information about the dataset. For example, values
Streams are created from daily counts of entities in the that describe entities, such as total amount or percentage of
news articles. For improved visibility, only entities that were news articles in a specific language are provided in the tooltip.
mentioned at least once more than 20 times per day are shown. Besides, in the analysis of entities, Visual comparison of a
Saturation determines overall count for each entity and is used certain entity across languages (Figure 4) can be performed
to distinguish very popular entities in the whole period from by selecting the appropriate stream from the visualization, or
the less popular ones. The total daily amount of entities is by textual search. In case of Barack Obama, it is easy to noticeFig. 4. Visual comparison between languages for a single entity. Barack
Obama in news in English (violet) and German (green)
a similar pattern in both languages, which shows increasing
amount of news about him, with peaks toward the end of
September 2009.
Since visualization of large collection of documents gives a
good overview of the whole dataset and its characteristics,
detailed information about a specific news articles can be
provided on demand. Direct links to news sources can be
established, in case the analyst wants to read the full text of Fig. 6. Mahmoud Ahmadinejad Network. The figure shows imperfections
in the dataset, since Ahmadinejad’s political opponent, Mir-Hossein Mousavi,
the article. appears several times under similar names.
B. Exploring relationships
In analyzing the relationships between entities, the first
Analysis of network of people and organizations around
question is which entities appear together in the news. How
Hamid Karzai (Figure 5) gives an overview that is highly
do the networks of certain people or organizations look like?
related to presidential election in Afghanistan in August 2009,
How can we benefit from visual analysis of this dataset? A
which was characterized by controversy. Therefore, besides
good way to show this information is to visualize graphs of
Karzai’s political opponent Abdullah Abdullah, several UN
personal networks that could be interactively explored. As an
and NATO officials, Independent Elections Commission and
example, we have built a network of 1,000 most frequent co-
US Special Envoy for Afghanistan and Pakistan Richard Hol-
occurrences of persons during 4 months. Our tool uses the
brooke can be found appearing frequently together with Karzai
well-known radial tree layout to display the graph and allows
in the news. Other direct connections from the child nodes
interactive exploration of each subtree. By selecting a node,
can be immediately revealed, such as Richard Holbrooke
the surrounding nodes are rearranged on the same distance
and Barack Obama, or Anders Fogh Rasmussen and Jaap de
from the focus node, but their co-occurence pairs are taken
into account as well. Interesting subnetworks are shown on
Figures 5, 6 and 7.
Fig. 5. Hamid Karzai Network. The network shows people appearing in the
news articles covering elections in Afghanistan: UN and NATO officials, US Fig. 7. Michelle Obama Network
representatives, but also political rivals.Hoop Scheffer, current and former Secretary General of NATO in the direction of performing the analysis in near real-
(respectively). time. The borderline between historical and real-time data
Michelle Obama’s network (Figure 7) includes direct edges analysis raises a lot of issues in both textual data mining and
to her husband, Barack Obama and Luiz Inacio Lula da Silva, visualization research fields.
President of Brazil. Analysis of temporal dynamics of both
ACKNOWLEDGEMENTS
Lula da Silva and Obama reveals that they were mentioned
very often in the news in the end of September 2009. Further This work was partially funded by the German Research
inspection showed that Michelle Obama appeared together Society (DFG) under grant GK-1042, ”Explorative Analysis
with Lula da Silva in the news about the 2016 Summer and Visualization of Large Information Spaces”.
Olympics bids, where both took significant part (Obama R EFERENCES
supported Chicago as a candidate city, while Lula da Silva
[1] M. Atkinson and E. Van der Goot, “Near real time information mining in
supported Rio de Janeiro). mulitlingual news,” in WWW ’09: Proceedings of the 18th international
These examples show strength of parallel use of visual conference on World Wide Web. ACM, 2009, pp. 1153–1154.
analysis for exploration of entity relationships and for temporal [2] (2009) Google news. [Online]. Available: http://news.google.com/
[3] (2009) Yahoo news. [Online]. Available: http://news.yahoo.com/
analysis of entities, even on this initial stage, when simple [4] M. Weskamp, “Newsmap,” Webdesigning Magazine, June 2004,
techniques are employed. Also, it shows some weaknesses. http://www.newsmap.jp.
First of all, there is no distinction between frequent co- [5] L. Lloyd, D. Kechagias, and S. Skiena, “Lydia: A system for large-
scale news analysis,” in String Processing and Information Retrieval:
occurrences and non-frequent ones. Further analysis should 12th International Conference, SPIRE 2005, Buenos Aires, Argentina,
distinguish between frequent and rare pairs and also take into November 2-4, 2005: Proceedings, 2005, pp. 161–166.
account differences across languages and sources. Also, graph [6] (2009) Emm newsbrief. [Online]. Available: http://emm.newsbrief.eu/
[7] (2009) Emm newsexplorer. [Online]. Available:
layout should be improved to accommodate the networks of http://emm.newsexplorer.eu/
nodes with high number of edges, since radial tree layout [8] S. Havre, E. Hetzler, P. Whitney, and L. Nowell, “Themeriver: Visualiz-
produces overlapping, thus making the exploration of relation- ing thematic changes in large document collections,” IEEE Transactions
on Visualization and Computer Graphics, vol. 8, no. 1, pp. 9–20, 2002.
ships difficult. [9] J. Wise, J. Thomas, K. Pennock, D. Lantrip, M. Pottier, A. Schur, and
V. Crow, “Visualizing the non-visual: spatial analysis and interaction
V. C ONCLUSIONS with information from text documents,” Information Visualization, IEEE
Symposium on, vol. 0, p. 51, 1995.
In this paper, we presented a data sharing and analysis [10] M. Ghoniem, D. Luo, J. Yang, and W. Ribarsky, “Newslab: Exploratory
broadcast news video analysis,” in VAST ’07: Proceedings of the
system that is in use between the European Commission’s 2007 IEEE Symposium on Visual Analytics Science and Technology.
Joint Research Centre and the Data Analysis and Visualiza- Washington, DC, USA: IEEE Computer Society, 2007, pp. 123–130.
tion Group at the University of Konstanz in Germany. We [11] E. G. Hetzler, V. L. Crow, D. A. Payne, and A. E. Turner, “Turning
the bucket of text into a pipe,” in INFOVIS ’05: Proceedings of the
identified several tasks in the analysis of news articles and Proceedings of the 2005 IEEE Symposium on Information Visualization.
methods for exploration of semantically annotated news data Washington, DC, USA: IEEE Computer Society, 2005, p. 12.
and demonstrated them in two case studies: [12] J. Kleinberg, Temporal Dynamics of On-Line Information Streams.
Springer, 2006.
1) The first case study demonstrated the system’s use for [13] ——, “Bursty and hierarchical structure in streams,” in KDD ’02:
temporal analysis of entity occurrences over a time pe- Proceedings of the eighth ACM SIGKDD international conference on
Knowledge discovery and data mining. New York, NY, USA: ACM,
riod of two months including cross-language comparison 2002, pp. 91–101.
of entity occurrences. [14] J. Leskovec, L. Backstrom, and J. Kleinberg, “Meme-tracking and the
2) The second case study dealt with the analysis of relation- dynamics of the news cycle,” in KDD ’09: Proceedings of the 15th
ACM SIGKDD international conference on Knowledge discovery and
ships among entities, which we realized using a radial data mining. New York, NY, USA: ACM, 2009, pp. 497–506.
graph layout. [15] R. Steinberger and B. Pouliquen, “Cross-lingual named entity recogni-
tion,” Linguisticae Investigationes, vol. 30, no. 1, pp. 135–162, January
In particular, these case studies showed several possibilities 2007.
of using visualization to facilitate the exploration of large [16] B. Pouliquen, M. Kimler, R. Steinberger, C. Ignat, T. Oellinger,
collection of news articles using semantic metadata. K. Blackler, F. Fuart, W. Zaghouani, A. Widiger, A.-C. Forslund, and
C. Best, “Geocoding multilingual texts: Recognition, disambiguation and
Our future work in semantic analysis of news will include visualisation,” in Proceedings of LREC-2006, Sep 2006.
research on evolution of stories in which the entities (people [17] M. Wattenberg, “Baby names, visualization, and social data analysis,”
and organizations) are involved. News stories are built around in INFOVIS ’05: Proceedings of the Proceedings of the 2005 IEEE
Symposium on Information Visualization. Washington, DC, USA: IEEE
events and can have complex properties. Events can be disjoint Computer Society, 2005, p. 1.
in time, they can evolve from other events, or merge into the
same story. Therefore, news stories can also merge, morph,
divide, vanish and reappear. Understanding their hierarchical
and semantic structure is a great challenge in news analysis
research. Future analysis of EMM data stream will take into
account categories as a part of the hierarchical structure
of news, and also further comparison across languages and
sources will be performed. We will also continue our researchYou can also read