The business impact of pharmacy registration fees on registered pharmacies in Great Britain
←
→
Page content transcription
If your browser does not render page correctly, please read the page content below
The business impact of
pharmacy registration
fees on registered
pharmacies in Great
Britain

January 2020
This report has been prepared by Ernst & Young LLP, a limited liability partnership registered
in England and Wales with registered number OC300001, in accordance with an engagement
agreement for professional services with The General Pharmaceutical Council. The General
Pharmaceutical Council is a statutory corporation and the independent regulator for
pharmacists, pharmacy technicians and pharmacy premises in Great Britain.
Ernst & Young LLP’s obligations to The General Pharmaceutical Council are governed by that
engagement agreement. This disclaimer applies to all other parties (including The General
Pharmaceutical Council’s affiliates and advisors).
This report has been prepared for general informational purposes only and is not intended to
be relied upon as accounting, tax, or other professional advice. Refer to your advisors for
specific advice.
Ernst & Young LLP accepts no responsibility to update this report in light of subsequent
events or for any other reason.
This report does not constitute a recommendation or endorsement by Ernst & Young LLP to
invest in, sell, or otherwise use any of the markets or companies referred to in it.
To the fullest extent permitted by law, Ernst & Young LLP and its members, employees and
agents do not accept or assume any responsibility or liability in respect of this report, or
decisions based on it, to any reader of the report. Should such readers choose to rely on this
report, then they do so at their own risk.
Ernst & Young LLP reserves all rights in the Report.
EY i
Contents
Contents
1. Introduction ..................................................................................................................... 1
1.1 Background ............................................................................................................................................ 1
1.2 Scope of the study ................................................................................................................................. 1
2. Key Findings .................................................................................................................... 3
2.1 Financial analysis ................................................................................................................................... 3
2.2 Literature review..................................................................................................................................... 5
3. Financial Impact Analysis .............................................................................................. 6
3.1 Methodology .......................................................................................................................................... 6
3.2 Detailed analysis .................................................................................................................................... 8
4. Benefits of Regulation, Inspection and Accreditation – Literature Review ............ 13
4.1 Methodology ........................................................................................................................................ 13
4.2 Detailed findings................................................................................................................................... 14
Appendix A Detailed Financial Information for MPCs, SIPs and ISIPs ....................... 16
Appendix B Surplus/Deficit Size vs Fee – All Sampled Organisations ...................... 17
Appendix C Geo-mapping of Sampled Pharmacies ..................................................... 18
Appendix D Literature Review Bibliography ................................................................. 19
EY iiIntroduction
1. Introduction
1.1 Background
The General Pharmaceutical Council (GPhC) is the regulating body that sets professional
standards for pharmacists, pharmacy technicians and pharmacies in Great Britain. Some of
the key services provided by GPhC include conducting routine, intelligence-led and themed
inspections for member pharmacies to ensure a safe and effective service is being delivered
to the public. GPhC charges all member pharmacies a renewal fee of £262 for each of their
premises annually to meet the associated costs of regulatory activities. However, this fee and
other revenue streams (e.g., personal registration) have been insufficient for GPhC to break
even financially, with the GPhC having reported growing operating losses and net cash
outflows over the past 2 years. While the regulator has sought to improve efficiency,
increasing fees to meet the costs of regulation and monitoring may be required for the GPhC
to meet its costs. This study assesses the impact of current fees and a potential fee increase
of £103 (to £365) for premises on the financial health of pharmacies that are registered with
GPhC.
According to the pharmacy register published on GPhC’s website
(https://www.pharmacyregulation.org/registers), there are 14,313 registered pharmacies
across Great Britain. For the purposes of our study, we have stratified these by the number of
premises they operate using definitions provided by the GPhC. The purpose of stratification is
to allow us to analyse whether certain segments of the market may be disproportionally
affected by the proposed fee change. The strata used are: Large Pharmacy Chains (LPCs),
Medium-sized Pharmacy Chains (MPCs) and Small/Independent Pharmacies, which are
further subdivided into those which are geographically isolated (ISIPs), and those which are
not (SIPs). We have defined ISIPs as pharmacies that are independently owned and are the
only pharmacy operating in a given town. We have made this distinction as the financial
sustainability of services in areas which have a limited supply of pharmacy services may be
of particular interest when considering fee increases.
Table 1: Pharmacy strata summary
Group Count
LPCs (9+ premises) 8,236 premises owned by 81 companies
MPCs (2-9 premises) 2,766 premises owned by 944 companies
SIPs (1 premise, not isolated) 3,208
ISIPs (1 premise, isolated) 103
Total 14,313
The GPhC has informed us that included in the above statistics are premises from which
online only (i.e., with no high-street presence) pharmacies operate. As we were unable to
identify these directly from the publicly available register for the purposes of our study, the
GPhC has identified a number of these for analysis as a separate grouping; Online
Pharmacies (OLPs).
1.2 Scope of the study
The three key objectives of the study were to understand:
1. The estimated impact of existing fees on the financial viability of safe and effective
pharmacy service provision.
2. The estimated impact a £103 increase may have on the financial viability of pharmacies
providing these services.
3. The benefits the services provided by the GPhC may yield for the operators of registered
premises and society more broadly in qualitative terms.
EY 1Introduction
We have undertaken a financial impact analysis for objectives (1) and (2), and a literature
review in order to consider objective (3).
As part of undertaking an analysis of the potential impact of future fee increases on
registered pharmacies, we seek to understand the most recent financial performance and
position of a sample of registered pharmacies. In this context, we consider the impact of
current fee levels on financial viability, which we supplement by performing an analysis of the
impact of an increase of £103 per premise across the above strata.
Our sample, as described in the Financial Impact Analysis section of this document,
comprises 33 companies/pharmacy chains (five LPCs, five MPCs, 10 SIPs, 10 ISIPs and
three OLPs) out of 4,336 companies/groups (less than 1%) nationally. However, these
companies/groups represent 38% of registered pharmacy premises nationally (5,465 out of
14,313 premises), as a large number of premises are operated by LPCs.
As these groups report their financial performance at an aggregate level, it is not possible for
us to analyse the financial performance of individual premises within them. As such, our
findings are limited to providing an indicative rather than a comprehensive view of the
financial landscape of the pharmacy market. In particular, our analysis provides an estimate
of the impact of registration fees on reported surplus/deficit at a group but not individual
premise level.
There is limited literature on the impact of pharmacy sector regulation and, as such, we
consider analogues where evidence exists for the impact of regulation, inspection and
accreditation on consumers and businesses.
The remainder of this document covers:
► Key findings from both parts of the study.
► Further detail of our financial impact analysis, including our methodology.
► Further detail of our literature review, including our methodology.
EY 2Key Findings
2. Key Findings
This section sets out key findings from our financial analysis and literature review, which are
described in greater detail in sections 3 and 4 respectively, along with method statements.
2.1 Financial analysis
A review of financial information and a financial impact analysis of pharmacies was
conducted for a limited sample of pharmacy groups across different strata. Our analysis
covered five LPCs, five MPCs, 10 SIPs, 10 ISIPs and three OLPs. The key metric we
calculated across all strata was registration renewal fees (current and in the scenario of a
£103 increase per premise) as a percentage of surplus/deficit in absolute terms*.
* Where summing surplus and deficit for comparison to fee, we have used the absolute
value, so both surpluses and deficits are presented as positive numbers. This is because
where we are calculating fees divided by surplus or deficit, summing together a
combination of positive and negative numbers for the denominator of that calculation
would cancel each other out, skewing the resultant metric when used to consider the
magnitude of fees in relation to financial performance. See Appendix B for further detail.
Ideally, fees would have been compared to revenues, which are always a positive number
and in general more consistent year to year than surplus/deficit, but this was not possible
as only the LPCs consistently published full accounts with these figures available.
Table 2 summarises the key findings within our sample, with further detail set out in Section 3
and Appendices A and B:
► For most organisations, full annual accounts were not available publicly, and therefore
comparisons to revenue can only be made for the LPCs, for which current fees were on
average 0.02% of revenues.
► Two of five LPCs and two of five MPCs were in financial deficit in 2018.
► This was lower in proportionate terms than for SIPs and ISIPs collectively (10 of 20) and
ISIPs taken alone (seven of 10) but higher than SIPs taken alone (three of 10).
► All three of OLPs were in deficit, which may be due in part to accounting adjustments as,
for two of the three online pharmacies, cash in bank increased over the same periods as
the reported deficits, which may suggest underlying financial surpluses.
► Registration fees were a smaller proportion of the absolute level of surplus/deficit for
LPCs and MPCs (0.29% and 0.34% respectively), than for SIPs and ISIPs (0.49% and
0.79% respectively).
► For OLPs, the fee was 0.01% of surplus/deficit, although this may again reflect in part
non-cash accounting adjustments. They were, however, also less than 1% of cash in
bank (another measure of the financial scale and sustainability of an organisation).
EY 3Key Findings
Table 2: Pharmacy sample summary
Number of organisations
Number of organisations
Number of organisations
(2018+£103 per premise)
deficit (£’000)* -Forecast
absolute surplus/ deficit
Sum of fees paid (2018)
Total absolute surplus/
Total absolute surplus/
Fees modelled as % of
Fees as % absolute of
% of organisations in
Number of premises
surplus/ deficit
Fees modelled
deficit (£’000)*
in surplus
in sample
Segment
in deficit
deficit
£’000
LPC 5 3 2 40% 5,424 493,958 1,421.1 0.29% 493,831 1,979.7 0.40%
MPC 5 3 2 40% 18 1,401 4.7 0.34% 1,401 6.5 0.47%
SIP 10 7 3 30% 10 532 2.6 0.49% 531 3.6 0.69%
ISIP 10 3 7 70% 10 330 2.6 0.79% 330 3.6 1.11%
OLP 3 0 3 100% 3 12,284 0.8 0.01% 12,284 1.0 0.01%
Total 33 16 17 52% 5,465 508,504 1,431.8 0.28% 508,377 1,994.7 0.39%
The findings in Table 2 suggest:
► Current fee levels are not a major driver of financial performance, being less than 1% of
average surplus/deficit for each pharmacy strata and 0.02% of revenue for LPCs (for
which revenue information was available). It should be noted that for LPCs and MPCs
we were not able to view financial performance of individual premises and therefore we
are not able to comment upon the impact on surplus/deficit at this disaggregated level.
► Future fee increases of £103 also do not appear to have a significant impact on financial
performance as the fee would remain less than 1% of the average surplus/deficit for
each stratum, other than ISIPs, for which it would be 1.1%.
► However, the sector is demonstrating a notable fragility, with 52% of organisations in
deficit across our sample. As noted in the accounts of one of the LPCs for 2018, this is
reflective of a challenging environment which included changes to funding available to
pharmacies in England and reductions in drug reimbursement. Rising business rates
and the impact of business rates on smaller businesses are also well-known challenges
facing high-street businesses in general1.
► This suggests that, while registration fee rises may not be a major driver of financial
performance, the fragility of the system means care should be taken when considering
the extent of fee rises, and that a policy where differential fees are considered for
segments of the market based on their ability to absorb them may be required. It does
not necessarily follow that this differentiation would need to be on a similar basis to the
stratification used in our analysis (chain size) but may consider other factors, e.g.,
prescription volumes, range of services offered and whether local supply is dependent
on single isolated pharmacies.
► It is of note that ISIPs were more likely to be in deficit and registration fees were a larger
proportion of their surplus/deficit on average than other strata, and as such future policy
should consider the sustainability of services in areas served by a single pharmacy.
1
(https://www.fsb.org.uk/media-centre/press-releases/inquiry-into-unfair-business-rates-system-welcomed-by-small-
firms)
EY 4Key Findings
2.2 Literature review
While our financial analysis focused on the cost of registration fees and their impact on
pharmacy surplus/deficit, our literature review focuses on understanding the benefits
regulation by the GPhC might bring to these businesses and the wider public. No literature
was identified pertaining specifically to the impact of regulation in the pharmacy sector;
therefore, our analysis identified analogues for the activities of the GPhC from other sectors.
Evidence from these sectors was used to draw general inferences. We found:
► Regulation can improve consumer confidence and reduce the effects of
information asymmetry: Information asymmetry can cause market failure, where
consumers cannot distinguish “good” and “bad” products, and “bad” products eventually
“chase out the good” (as documented in George Akerlof’s “The Market for Lemons” in
1970). The Local Better Regulation Office (2012), suggests that regulation can provide
consumers with good quality products and prevent inferior products from entering the
market, thus reducing the impact of information asymmetry. The GPhC sets principles
and standards for registered pharmacy premises and staff, including how they manage
medicines and devices to safeguard health. These principles and standards, combined
with other regulatory activities such as inspection and registration, may increase
consumer confidence in respect of quality levels when accessing goods and services
through a registered pharmacy.
► Accredited services can attract higher prices: According to Frenz M. and Ray L.
(2013) – drawing from a survey conducted to assess the impact of accreditation and
infrastructure quality – prices for accredited services were higher than that for non-
accredited services, on average by an estimated 8%. This means increased consumer
confidence from the principles, standards and regulatory activities described above may
result in an increased willingness to pay for products sold by pharmacies – especially as
the term “pharmacy” is a protected title in law, with only registered pharmacies allowed
to brand themselves as such.
► Encouraging training can improve industry wide productivity and governance: The
Chartered Institute of Building (CIOB), (2015), suggests that professional bodies improve
industry wide productivity and governance through research and training. Applying this to
the pharmacy sector, the GPhC’s requirements for evidence of appropriate qualifications
for registered pharmacists and technicians, along with setting standards for the number
and qualification mix of staff, may help improve efficiency and thereby reduce the
operating costs and business risks faced by pharmacies.
► Regulation, inspection and accreditation can make a contribution to the wider
economy: The National Association of Testing Authorities of Australia (NATA), (2017)
lists the importance of accreditation at a company, industry and economy level. The
study estimates the economic value of NATA’s contribution to the Australian economy
highlighting activities such as setting standards and improving quality – analogous to the
role of the GPhC – as key contributors to its overall economic impact.
EY 5Financial Impact Analysis
3. Financial Impact Analysis
This section sets out in greater detail the methodology and findings of our financial impact
analysis of current and potential future registration fees.
3.1 Methodology
In estimating the impact of current registration fees and a potential £103 fee increase, we
selected a sample of pharmacies from the various strata (as described in section 1). The fees
we estimated these pharmacies / pharmacy chains paid were compared against key financial
metrics from their financial returns to Companies House. The analysis presented through this
document is conducted using a sample of 33 pharmacies. The distribution of these across
various strata is as follows:
Table 3: Pharmacy sample selection by strata
Group Agreed sample size
LPCs (>9 premises) 5
MPCs (2-9 premises) 5
SIPs (1 premise) 10
ISIPs (1 premise) 10
OLPs (1 premise serving online customers only) 3
Total Sample 33
We have anonymised the findings in this document, with details of the pharmacies included in
the sample and links to their financial returns held on file.
3.1.1 Criteria for sample selection
► For LPCs, the largest chains comprise a significant proportion of the overall market. As a
broad coverage of the market was desirable for the analysis, the top five companies by
number of premises was taken as the sample as opposed to performing random
sampling. Adjustments to the sample selection were made for chains where pharmacy
activities could not be disaggregated from other activities in the annual accounts, as
explained in more detail later in this section.
► For MPCs and SIPs, random sampling was used to select the sample, as described in
further detail later in this section.
► ISIPs were defined as pharmacies that are independently owned and are the only
pharmacy operating in a given town. 103 of these were initially identified, but a
geographical analysis found that a large proportion of these were relatively close to other
pharmacies in nearby towns and therefore in effect not ‘isolated’. We excluded these
pharmacies, thereby further narrowing this stratum to 50 pharmacies2. Random
sampling was used to select the sample from these fifty pharmacies. It should be noted
that in reality there may exist geographically isolated pharmacy premises which are part
of LPCs or MPCs, but as standalone financial information is not available for such
premises, they are not included in this grouping.
2
An exclusion criterion was applied for pharmacies with limited financial information available in Companies House
UK. Where pharmacies were excluded on this basis, the sampling process was repeated to obtain a suitable
replacement.
EY 6Financial Impact Analysis
► OLPs in Great Britain are also liable to pay £262 per trading name for premises
registration and renewal. Given the growing market penetration of online pharmacies in
Great Britain, these were also included within this study. A sample of four pharmacies
was suggested by GPhC. However, as one of the four had only recently been
incorporated, no financial returns were available and it was therefore excluded from the
analysis. Three OLPs remained in the sample.
3.1.2 Random sampling technique
Simple random sampling is a probability-based sampling procedure that gives every element
in the target population an equal chance of being selected. This helps to conduct a study
without human bias and helps to prevent skewed results. For stratified random sampling the
entire dataset is segmented into different strata and random samples are picked from each.
As detailed above, for this study the strata used are LPCs, MPCs, SIPs, ISIPs and OLPs.
3.1.3 Final Selected Samples
The following table shows LPCs (pseudonymised through the sequence of their selection in
the format Lx, with a similar naming convention used for the other strata) selected by market
coverage. Upon review of company accounts, L5 was identified as a supermarket chain
which reports its financials on a consolidated basis and hence due to data incomparability
was removed from the sample.
As set out in the table below, L6 was excluded from the sample for the same reason as L5.
L7 and L8 were both suitable candidates for inclusion as the fifth chain in the sample. As they
operated the same number of premises (223 each), random sampling (as described under
the Random Sampling Technique section of this document), was utilised to select between
them and L7 was included in the sample.
Table 4: Large pharmacy premises
Pharmacy pseudonym Count of premises 2018 Inclusion
L1 2344 Included
L2 1578 Included
L3 762 Included
L4 517 Included
L5 375 Excluded – pharmacy activity could not be
disaggregated from supermarket activity
L6 256 Excluded – pharmacy activity could not be
disaggregated from supermarket activity
L7 223 Included
L8 223 Excluded – random sampling used to select between
L7 and L8 as fifth chain included in the sample
For MPCs sample selection was undertaken using random sampling and the following
pharmacies were selected:
Table 5: Medium pharmacies premises
Pharmacy pseudonym Count of premises 2018
M1 6
M2 2
M3 2
M4 2
M6 6
EY 7Financial Impact Analysis
For the SIP and ISIP samples, selection was undertaken based on multistep random
sampling, whereby if the required financial information was not available for pharmacies
selected in the initial sample, these pharmacies were removed and a new sample was drawn
to identify suitable replacements. This process was followed until the agreed sample size was
reached.
Table 6: Availability financial information
Small Small isolated
Step/Category Found Not found Found Not found
0 6 4 6 4
1 - 4 4 -
2 2 2 - -
3 1 1 - -
4 1 - - -
Table 7: Final Small sample (10) and Small-isolated sample (10)
Small Pharmacies Small Isolated Pharmacies
Pharmacy Country Pharmacy Country
S1 England SI1 Scotland
S2 England SI2 England
S3 England SI3 Scotland
S4 England SI4 Scotland
S5 England SI5 Wales
S6 England SI6 Wales
S7 England SI7 England
S8 England SI8 England
S9 England SI9 Wales
S10 England SI10 Scotland
3.1.4 Additional notes/limitations of our approach
It should be noted that our analysis was undertaken based on annual accounts, which by
their nature provide an aggregated view of financial activities and performance for a legal
entity or group, and therefore do not allow for analysis of performance of individual premises
within a group. For groups of companies with multiple lines of service, we analysed the
accounts of the subsidiary we were able to identify as owning and operating pharmacies (we
excluded from our samples companies where activities were not sufficiently disaggregated
into separate subsidiaries to meaningfully isolate pharmacy activities). However, it is likely
that even these subsidiaries will have a portfolio of activities which extends beyond core
pharmacy services, e.g., sale of cosmetic and other consumer products, and it should be
noted that this may have a bearing on the calculated financial metrics. This may mean the
reported financial position for the organisations and scale of the registration fee in relation to
them is affected by financial flows not related to the core pharmacy business and may distort
comparisons between the different strata within our analysis.
Geo-mapping was undertaken to understand the geographical spread of premises for
sampled LPCs, MPCs, SIPs and ISIPs, and is included in Appendix C.
3.2 Detailed analysis
Below we set out our detailed financial analysis for the selected sample of
pharmacies/pharmacy chains. The financial information with which to conduct this analysis
varied by strata, with LPCs publishing full accounts, while MPCs, SIPs and ISIPs being small
EY 8Financial Impact Analysis
businesses and not publicly listed are exempt from doing so, and online pharmacies
generally being newer businesses with fewer yeas of financial information available. For this
reason our analysis in this section is grouped into the following sub-sections:
► LPCs
► MPCs, SIPs and ISIPs
► OLPs
Each of these subsections presents historical performance data followed by analysis of the
impact of a £103 fee increase per premise. Our key metric in this analysis is fees paid as a
percentage of surplus/deficit. For LPCs for which revenue information was available across
the breadth of the sample, we also used this as a secondary comparator to fees. For all other
strata, for which revenue information was not available, we used cash in bank as a secondary
comparator as this is also a common measure of organisational size and sustainability.
3.2.1 Large Pharmacy Chains
► Since 2016 surplus/deficit position has in general been declining for all five organisations
within this stratum (the only exception being an improvement for L3 in 2017). For 2018
two out of five organisations were in deficit.
Figure 1: Net surplus/deficit of sampled Large pharmacy groups 2017-2018
500 437.0
388.0
400
317.0
Suprlus/(Deficit) £m
300
200
100 19.1 17.6 14.6
12.8 5.9 5.1 11.8 7.9 13.9
0
(100) -10.7
(200) -152.5 -133.8
L1 L2 L3 L4 L7
Pharmacy group/year
2018 2017 2016
► Across the LPCs fees as a proportion of total revenue averaged 0.02%.
► Fees as a proportion of (absolute) surplus/deficit averaged 0.4%.
Table 8: Analysis of current fee impact for LPCs
Pharmacy Count of premises Fee as a % of Fee as a % of (absolute)
pseudonym 2018 revenue surplus/ deficit Fees paid (£m)
L1 2344 0.01% 0.27% 0.86
L2 1578 0.03% 0.38% 0.58
L3 762 0.04% 4.78% 0.28
L4 517 0.04% 1.78% 0.19
L7 223 0.02% 1.03% 0.08
Total / Average 5424 0.03% 0.40% 1.98
► As shown in Table 9 below, the impact of a fee-increase of £103 to £365 would have an
estimated impact of between 0.08% and 1.36% change in surplus/deficit for the LPCs
sampled (0.12% weighted average).
EY 9Financial Impact Analysis
Table 9: Surplus/deficit analysis of £103 fee increase for LPCs
Fee increase of
Base case £103 Scenario net Change in net
Pharmacy surplus/deficit surplus/ deficit surplus/deficit
pseudonym (£m) (£m) (£m) % change
L1 £317.00 316.76 (0.24) (0.08%)
L2 (152.50) (152.67) (0.17) (0.11%)
L3 5.90 5.82 (0.08) (1.36%)
L4 (10.66) (10.72) (0.06) (0.56%)
L7 7.89 7.87 (0.02) (0.25%)
3.2.2 Medium Sized Pharmacy Chains and Small/Independent Pharmacies
► For the MPCs, two of the five reported net losses in 2018, though most experienced an
improvement in the net surplus/deficit as compared to 2017 (see Appendix A).
► 3 out 10 SIPs reported net deficits for FY 2018.
► 7 out of 10 ISIPs reported net deficits for FY 2018.
Table 10: Current state analysis for MPCs, SIPs, and ISIPs
Indicator Stratum Min Max Average
Fee paid (£’000) MPCs 0.52 1.57 0.94
SIPs 0.26 0.26 0.26
ISIPs 0.26 0.26 0.26
Fee as a % of cash MPCs 0.3% 13.3% 3.6%
SIPs 0.0% 5.6% 1.3%
ISIPs 0.1% 262.0% 26.9%
Fee as a % of net MPCs 0.2% 1.7% 0.9%
surplus/deficit
SIPs 0.2% 3.1% 0.9%
ISIPs 0.3% 12.8% 3.4%
For SIPs and MPCs, the impact of a fee increase of £103 was within a similar range to the
LPCs, 0.08%-1.17% of absolute surplus/deficit, as can be seen in Table 11. However, for
ISIPs this range was larger, 0.11%-5.39%.
Table 11: Surplus/deficit analysis for MPCs, SIPs, and ISIPs in £103 increase scenario
Pharmacy Strata Base case Fee increase of £103 Change in net
pseudonym surplus/deficit Scenario net surplus/ surplus/deficit %
(£’000) deficit (£’000) (£’000) change
M1 MPCs (457.41) (458.03) (0.62) (0.14%)
M2 MPCs 40.94 40.73 (0.21) (0.51%)
M3 MPCs 31.49 31.28 (0.21) (0.67%)
M4 MPCs (67.89) (68.1) (0.21) (0.31%)
M6 MPCs 803.37 802.75 (0.62) (0.08%)
S1 SIPs (96.14) (96.24) (0.1) (0.10%)
S2 SIPs 21.82 21.72 (0.1) (0.46%)
S3 SIPs 49.4 49.3 (0.1) (0.20%)
S4 SIPs 8.56 8.46 (0.1) (1.17%)
S5 SIPs 25.8 25.7 (0.1) (0.39%)
S6 SIPs (64.37) (64.48) (0.11) (0.17%)
EY 10Financial Impact Analysis
S7 SIPs 49.05 48.95 (0.1) (0.20%)
S8 SIPs 117.63 117.53 (0.1) (0.09%)
S9 SIPs 79.94 79.83 (0.11) (0.14%)
S10 SIPs (19.03) (19.13) (0.1) (0.53%)
SI1 ISIPs (47.12) (47.22) (0.1) (0.21%)
SI2 ISIPs (47.72) (47.82) (0.1) (0.21%)
SI3 ISIPs 15.07 14.97 (0.1) (0.66%)
SI4 ISIPs (3.15) (3.25) (0.1) (3.17%)
SI5 ISIPs 50.6 50.5 (0.1) (0.20%)
SI6 ISIPs (4.4) (4.51) (0.11) (2.50%)
SI7 ISIPs (97.41) (97.52) (0.11) (0.11%)
SI8 ISIPs 10.07 9.96 (0.11) (1.09%)
SI9 ISIPs (52) (52.11) (0.11) (0.21%)
SI10 ISIPs (2.04) (2.15) (0.11) (5.39%)
3.2.3 Online Pharmacies
► All three pharmacies selected in this sample incurred net losses in 2018. However, two
of the three pharmacies are new in the market, such that market entry and start-up costs
may be reflected in reported financial performance.
► ON1 reported revenue of £43m in 2018, an increase of 67% to the prior year. However,
operating losses and net losses increased from £5m (2017) to £12m (2018).
► ON2 also incurred losses, but the losses have decreased from £1.50m (2017) to £0.15m
(2018). ON2 has seen cash in bank decrease both years analysed.
► ON3 reported a loss of £236 in 2018 while they achieved a surplus of £834 in 2017.
Cash in bank has increased each year for ON3.
► The impact of the current fee is 0%-0.2% of surplus/deficit for the two larger pharmacies
(ON1, ON2).
► For ON3 the fee is 110.2% of surplus/deficit. Fees being large compared to a
surplus/deficit could be misleading in terms of the significance of their impact (e.g., they
may still be small compared to revenues and total costs) so as such (and in the absence
of revenue data) we also compared the fees to the value of cash in bank. For ON3 we
found that fees were 0.37% of cash in bank (more in line with the other organisations
and lower than for SIPs, ISIPs and MPCs), and cash in bank had grown in both years
analysed.
► The impact of a fee increase of £103 (0% and 0.1% for ON1 and ON2 respectively) is
within the range for SIPs, ISIPs, MPCs or LPCs where analysed as a percentage of
surplus/deficit. For ON3, it represents a 47% impact on surplus/deficit.
EY 11Financial Impact Analysis
Table 12: Current state/historical analysis for OLPs
Fee as a %
Fee of (absolute) Fee as
Inc. Net surplus/deficit paid surplus/ a % of
Date (£’000) Cash (£’000) (£’000) deficit cash
2018 2017 2018 2017 2016 2018
ON1 1999 (12,133) (5,946) 20,900 614 656 0.26 0.0% 0.00%
ON2 2017 (150.4) (1,507) 360 457 465 0.26 0.2% 0.07%
ON3 2014 (0.2) 0.8 71 43 19 0.26 110.2% 0.37%
Table 13: Surplus/deficit analysis for OLPs in £103 increase scenario
Base case Flat fee-increase of £103 Change in
Pharmacy surplus/deficit scenario surplus/deficit surplus/deficit %
pseudonym (£’000) (£’000) (£’000) change
ON1 (12,133) (12,133) (0.11) (0.0%)
ON2 (150.4) (150.5) (0.11) (0.1%)
ON3 (0.2) (0.3) (0.11) (47.8%)
EY 12Benefits of Regulation, Inspection and Accreditation – Literature Review
4. Benefits of Regulation, Inspection and Accreditation –
Literature Review
This section sets out in greater detail the methodology and findings of our literature review as
to the potential benefits of effective regulation, inspection and accreditation activities to
pharmacies, and to society more broadly.
4.1 Methodology
We used search engines Google Scholar and Research Gate in addition to a more general
internet search to identify relevant articles. As no articles were identified specific to the
regulation of pharmacies, we focused on analogues from which inferences could be drawn.
Keywords used in these searches were:
► Conformity assessment.
► Economic benefits of regulation/standardisation and accreditation.
► Kite marks & economic impact or benefit.
► Health & safety inspections & economic impact or benefit.
► Food standards and economic impact or benefit; professional body registration; and
professional body accreditation.
Papers and websites identified through these searches were filtered through review of
abstracts, titles and summaries to filter down to 18 papers for full review.
12 of the papers reviewed in full refer primarily to UK markets, three refer to the USA with a
further paper referring to each of the EU, Canada and Australia.
On full text review 13 of these papers were used to inform our detailed findings, while no
information we deemed pertinent to our study question was identified in the other five.
Studies identified/included are listed in Table 14.
In addition to these studies, we utilised resources from the GPhC website to understand the
GPhC’s activities, the potential benefits of its work and how they may be analogous to the
activities and benefits described in the above studies.
► GPhC site: http://www.pharmacyregulation.org/
► Standards for registered pharmacies (premises):
http://www.pharmacyregulation.org/sites/default/files/document/standards_for_registered
_pharmacies_june_2018_0.pdf
► Standards for pharmacy professionals:
http://www.pharmacyregulation.org/sites/default/files/standards_for_pharmacy_professio
nals_wheel.pdf
EY 13Benefits of Regulation, Inspection and Accreditation – Literature Review
Table 14: Summary of articles identified by literature review
Title Main geography Publisher Included?
Economics for occupational safety and health US Research gate Y
Principles for Economic Regulation UK BIS Y
A short guide of regulations UK NAO N
Regulation and Growth UK Local Better Y
Regulation Office
The Economic Contribution of Standards to the UK UK Cebr Y
Economy
The Economics of Standardization: An update UK Innovative Economics Y
Limited
Conformity Assessment and Accreditation policy in UK BIS Y
the UK
The Economics of Accreditation UK UKAS Y
Economic Value of NATA Accreditation in Australia Australia University Y
Technology Sydney
Security Regulation, Conformity Assessment & EU European Y
Certification Commission
What Brexit means for regulated product conformity UK BSI N
assessment
Understanding the Value Of Professionals and UK CIOB Y
Professional Bodies
The Impact of Standardization on International Trade UK Research gate Y
The effects of economic regulation US MIT Y
Does accreditation stimulate change? A study of the Canada IS N
impact of the accreditation process on Canadian
healthcare organizations
The Economics of Standardization UK University of N
Manchester
How we analyse the costs and benefits of our policies UK FCA N
The Market for "Lemons": Quality Uncertainty and the US MIT Y
Market Mechanism
4.2 Detailed findings
Table 15 sets out key findings/themes from our literature review with supporting extracts from
the articles identified.
Table 15: Literature review detailed findings
Finding Relevance to pharmacy sector
Regulation can improve consumer confidence and The GPhC sets out standards and principles for
reduce the effects of information asymmetry: registered pharmacies. All five principles (under which
Information asymmetry can cause market failure, the standards are grouped) make reference to the
where consumers cannot distinguish “good” and “bad” safety and wellbeing of patients, which in a healthcare
products, and “bad” products eventually “chase out the setting is an important component of quality.
good” as documented in Akerlof G. (1970). Inspections are carried out on registered pharmacies to
test compliance with these standards, and only
Swann P. (2010) highlights the importance of a registered pharmacies are allowed to use the title
regulator in preventing market failure. “pharmacy” in Great Britain. This suggests a consumer
The Local Better Regulation Office (2012) suggests visiting a high-street or online pharmacy (marketing
that regulation may provide consumers with good itself as such) in Great Britain has some assurance that
quality products and prevent inferior products from the quality of service they receive will be of a certain
entering the market. Financial interests of consumers level, in effect removing the “lemons” from the market.
are also protected by regulators. The GPhC undertakes initial and renewal processes for
registration of premises, as well as inspections, which
would be expected to prevent poor quality pharmacy
premises entering/remaining on the market; improving
consumer confidence and experience.
EY 14Benefits of Regulation, Inspection and Accreditation – Literature Review
Finding Relevance to pharmacy sector
Markers of quality such as the Kitemark can be The status of the term “pharmacy” as a protected title
important to consumers in Great Britain may act in a similar manner to a
Hudson and Jones (2003) state that research for Kitemark, resulting in higher consumer confidence than
Kitemark found that about 82% of customers recognise would otherwise be the case. In addition, use of the
the Kitemark symbol and, of these, 93% percent GPhC’s logo via a voluntary internet logo scheme may
believe the product is safer due to carrying this symbol, provide a similar benefit to registered online
while 88% consider it a sign of trust and integrity. pharmacies.
Regulation, inspection and accreditation can make This study is consistent with the above analysis in
a contribution to the wider economy: suggesting that the GPhC’s role in setting standards
The National Association of Testing Authorities (2017) and safeguarding quality may have a positive impact
lists the importance of accreditation at a company, on the economic contribution of the pharmacy sector.
industry and economy level. The study estimates the
value of NATA’s contribution to the Australian
economy, identifying activities such as setting
standards and improving quality as key contributors to
its overall economic impact.
Accredited services can attract higher prices: It is possible that regulation by the GPhC and the
According to Frenz M. and Ray L. (2013) – based on a associated consumer confidence in the quality of
survey conducted to assess the impact of accreditation service received from pharmacies as outlined above
and infrastructure quality completed by 176 businesses result in the ability to commander higher sales volumes
– most respondents replied that prices for accredited and prices by pharmacies. For example, this may
services were higher than that for non-accredited contribute to revenues from non-medical fast-moving
services, on average by an estimated 8%. 50% of consumer goods sold by pharmacies.
respondents considered that accreditation was a
marketing and reputational advantage, while a further
16% felt that it was a requirement of their customers
and nearly 20% reported benefits in efficiency and
service quality from the assessment process.
Encouraging training can improve industry wide These studies suggest that pharmacies may be more
productivity and governance: productive and better governed as a result of the GPhC
Cebr (2015) states that standardisation helps providing a common framework of principles and
businesses to attain productivity. standards; e.g. through encouraging training through
qualification requirements.
The Chartered Institute of Building, (2015) suggests
that professional bodies improve productivity and
governance of industry through research and training.
The European Commission, (2011) seeks to assess
the impact of adoption of EU conformity assessment
standards by the security industry on producers and
consumers. For producers, these standards were
found to reduce costs related to multiple testing,
reduce the time taken by the product to reach the
market, enhance performance of the products, reduce
client trials and increase innovation. Consumers were
found to benefit from lower prices passed on by
producers with lower compliance costs, availability of
innovative solutions and enhanced information and
transparency.
The Department of Business, Energy and Industrial
Strategy (2017) states that “organisations can save
time and money by selecting accredited and therefore
competent conformity assessment services.”
Regulation can encourage competition: As outlined above, the term “pharmacy” in Great Britain
The Department of Business Innovation and Skills is a protected title, and this may in itself mean
(2011) stresses that regulation promotes competition pharmacies have a shared brand of sorts. This may
ultimately benefitting the consumers. make it easier for independent pharmacies and
smally/medium sized chains to compete with larger
players which are able to establish recognisable
brands.
Regulation can be effective in safeguarding safety The GPhC conducts routine, intelligence led and
and wellbeing: themed inspections. As stated above, the GPhC
Kankaanpa E., Aaltonen E. and Tulder M.V. (2014) documents a number of principles and standards which
suggests that regulations and inspection can reduce it states are “the backbone of our regulatory approach”.
occupational accidents. Public and patient safety and wellbeing is a stated aim
for each principle, and the standards are such that they
are also likely to have a positive impact on the safety of
staff.
EY 15Detailed Financial Information for MPCs, SIPs and ISIPs
Appendix A Detailed Financial Information for
MPCs, SIPs and ISIPs
Pharmacy Number of Net surplus/deficit Fee paid Fee as a
pseudonym premises Stratum (£’000) Cash (£’000) (£’000) % of cash
2018 2017 2018 2017 2016 2018 2018
M1 6 MPCs (457.41) (764.08) 422.72 140.30 0.10 1.57 0.37%
M2 2 MPCs 40.93 (341.98) 202.26 208.55 467.58 0.52 0.26%
M3 2 MPCs 31.49 35.48 14.82 13.34 76.26 0.52 3.53%
M4 2 MPCs (67.89) 63.20 3.93 158.01 189.89 0.52 13.32%
M6 6 MPCs 803.37 (1,219.30) 522.04 467.10 636.45 1.57 0.30%
S1 1 SIPs (96.13) (210.33) 4.70 0.00 0 0.26 5.57%
S2 1 SIPs 21.81 6.61 91.82 91.34 66.63 0.26 0.29%
S3 1 SIPs 49.39 (126.77) 5.75 5.69 56.43 0.26 4.55%
S4 1 SIPs 8.56 5.42 101.64 92.12 54.59 0.26 0.26%
S5 1 SIPs 25.80 27.66 19.30 62.34 4.05 0.26 1.36%
S6 1 SIPs (64.37) 10.23 73.41 87.23 22.07 0.26 0.36%
S7 1 SIPs 49.05 78.96 644.50 543.26 450.34 0.26 0.04%
S8 1 SIPs 117.63 56.41 1,578.68 1,537.82 1,464.09 0.26 0.02%
S9 1 SIPs 79.93 134.86 113.16 113.60 639.22 0.26 0.23%
S10 1 SIPs (19.02) 137.10 194.08 214.92 165.60 0.26 0.13%
SI1 1 ISIPs (47.11) (35.63) 67.12 49.78 25.75 0.26 0.39%
SI2 1 ISIPs (47.71) (57.67) 0.10 2.02 95.67 0.26 262%
SI3 1 ISIPs 15.07 8.61 13.56 6.80 15.80 0.26 1.93%
SI4 1 ISIPs (3.15) (23.49) 49.29 2.52 10.85 0.26 0.53%
SI5 1 ISIPs 50.59 55.62 367.56 391.17 300.97 0.26 0.07%
SI6 1 ISIPs (4.40) (11.84) 28.93 0.52 0.69 0.26 0.91%
SI7 1 ISIPs (97.41) 41.80 138.41 287.18 103.53 0.26 0.19%
SI8 1 ISIPs 10.06 (9.98) 29.44 19.15 38.16 0.26 0.89%
SI9 1 ISIPs (52.00) (10.89) 11.02 10.20 18.23 0.26 2.38%
SI10 1 ISIPs (2.04) 14.29 522.37 429.39 319.31 0.26 0.05%
EY 16Surplus/Deficit Size vs Fee – All Sampled Organisations
Appendix B Surplus/Deficit Size vs Fee – All
Sampled Organisations
Surplus/ (deficit) Absolute Fees paid Fees as % of
Pharmacy Pharmacy Number of 2018 (or most surplus/deficit (2018) absolute surplus/
pseudonym stratum premises recent year) £’000 (£’000) £’000 deficit
L1 LPCs 2,344 317,000.00 317,000.00 614.12 0.19%
L2 LPCs 1,578 (152,504.00) 152,504.00 413.43 0.27%
L3 LPCs 762 5,897.00 5,897.00 199.64 3.39%
L4 LPCs 517 (10,664.00) 10,664.00 135.45 1.27%
L7 LPCs 223 7,893.00 7,893.00 58.42 0.74%
M1 MPCs 6 (457.41) 457.41 1.57 0.34%
M2 MPCs 2 40.93 40.93 0.52 1.28%
M3 MPCs 2 31.49 31.49 0.52 1.66%
M4 MPCs 2 (67.89) 67.89 0.52 0.77%
M5 MPCs 6 803.37 803.37 1.57 0.20%
S1 SIPs 1 (96.13) 96.13 0.26 0.27%
S2 SIPs 1 21.81 21.81 0.26 1.20%
S3 SIPs 1 49.39 49.39 0.26 0.53%
S4 SIPs 1 8.56 8.56 0.26 3.06%
S5 SIPs 1 25.80 25.80 0.26 1.02%
S6 SIPs 1 (64.37) 64.37 0.26 0.41%
S7 SIPs 1 49.05 49.05 0.26 0.53%
S8 SIPs 1 117.63 117.63 0.26 0.22%
S9 SIPs 1 79.93 79.93 0.26 0.33%
S10 SIPs 1 (19.02) 19.02 0.26 1.38%
SI1 ISIPs 1 (47.11) 47.11 0.26 0.56%
SI2 ISIPs 1 (47.71) 47.71 0.26 0.55%
SI3 ISIPs 1 15.07 15.07 0.26 1.74%
SI4 ISIPs 1 (3.15) 3.15 0.26 8.31%
SI5 ISIPs 1 50.59 50.59 0.26 0.52%
SI6 ISIPs 1 (4.40) 4.40 0.26 5.95%
SI7 ISIPs 1 (97.41) 97.41 0.26 0.27%
SI8 ISIPs 1 10.06 10.06 0.26 2.60%
SI9 ISIPs 1 (52.00) 52.00 0.26 0.50%
SI10 ISIPs 1 (2.04) 2.04 0.26 12.82%
ON1 OLPs (12,133.00) 12,133.00 0.26 0.00%
ON2 OLPs (150.35) 150.35 0.26 0.17%
ON3 OLPs (0.23) 0.23 0.26 111.02%
EY 17Geo-mapping of Sampled Pharmacies
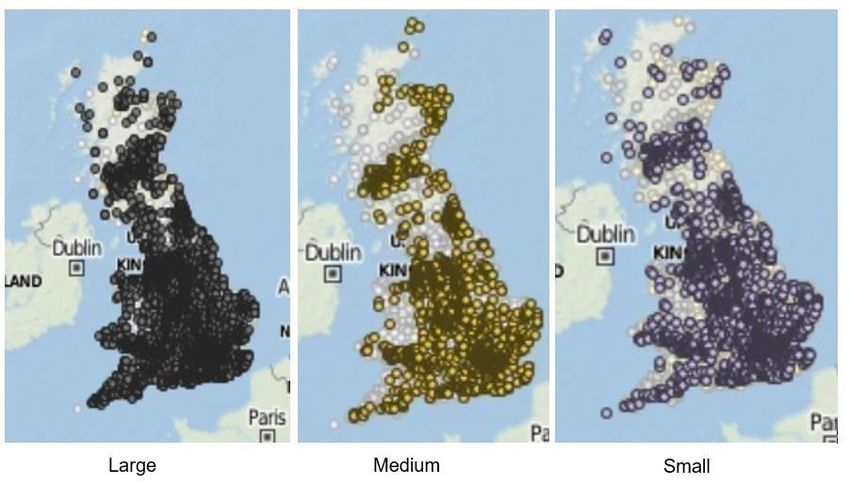
Appendix C Geo-mapping of Sampled Pharmacies
Distribution of all premises by state
Distribution of premises for the five Large chains sampled
Geographical distribution of premises for Medium chains sampled
Geographical distribution of premises for Small and Small Isolated chains
EY 18Literature Review Bibliography
Appendix D Literature Review Bibliography
► Swann P. (The Economics of Standardization: An Update, Business, Innovation and
Skills (BIS), 2010) – Link
► Frenz M. and Ray L. (The Economics of Accreditation, BIS/UKAS, 2013) – Link
► Local Better Regulation Office (Regulation and Growth, 2012)- Link
► Department of Business Innovation and Skills (Principles for Economic Regulation,
2011)- Link
► Hudson and Jones (The Impact of Standardization on International Trade, 2003)- Link
► Kankaanpa E., Aaltonen E. and Tulder M.V., (Economics for occupational safety and
health, 2014)- Link
► Cebr (The Economic Contribution of Standards to the UK Economy,2015) – Link
► CIOB (Understanding The Value Of Professionals And Professional Bodies, 2015) – Link
► European Commission (Security Regulation, Conformity Assessment & Certification,
2011) – Link
► Department of Business, Energy and industrial strategy (Conformity assessment and
accreditation Policy in the UK, 2017) – Link
► NATA (Economic Value of NATA Accreditation in Australia, 2017)- Link
► Joskow P. and Nancy R. (The effects of economic regulation, Massachusetts Institute of
Technology) – Link
► Akerlof G. (The Market for "Lemons": Quality Uncertainty and the Market Mechanism) –
Link
EY 19EY | Assurance | Tax | Transactions | Advisory Ernst & Young LLP © Ernst & Young LLP. Published in the UK. All Rights Reserved. The UK firm Ernst & Young LLP is a limited liability partnership registered in England and Wales with registered number OC300001 and is a member firm of Ernst & Young Global Limited. Ernst & Young LLP, 1 More London Place, London, SE1 2AF. ey.com
You can also read