EDETECT: A FAST ERROR DETECTION AND CORRECTION TOOL FOR LIVE CELL IMAGING DATA ANALYSIS - MPG.PURE
←
→
Page content transcription
If your browser does not render page correctly, please read the page content below
Article
eDetect: A Fast Error Detection and Correction
Tool for Live Cell Imaging Data Analysis

                                       Hongqing Han,
                                       Guoyu Wu,
                                       Yuchao Li, Zhike Zi

                                       zhike.zi@molgen.mpg.de

                                       HIGHLIGHTS
                                       eDetect is a user-friendly
                                       software for live cell
                                       imaging data analysis

                                       It provides an easy
                                       solution to detect and
                                       correct errors in imaging
                                       data analysis

                                       It enables precise cell
                                       lineage reconstruction
                                       from long-term imaging
                                       datasets

                                       It is compatible with
                                       CellProfiler and performs
                                       well in different imaging
                                       datasets

                                       Han et al., iScience 13, 1–8
                                       March 29, 2019 ª 2019 The
                                       Author(s).
                                       https://doi.org/10.1016/
                                       j.isci.2019.02.004
Article
eDetect: A Fast Error Detection
and Correction Tool for Live Cell
Imaging Data Analysis
Hongqing Han,1 Guoyu Wu,1 Yuchao Li,1 and Zhike Zi1,2,*
SUMMARY
Live cell imaging has been widely used to generate data for quantitative understanding of cellular dy-
namics. Various applications have been developed to perform automated imaging data analysis, which
often requires tedious manual correction. It remains a challenge to develop an efficient curation method
that can analyze massive imaging datasets with high accuracy. Here, we present eDetect, a fast error detec-
tion and correction tool that provides a powerful and convenient solution for the curation of live cell imag-
ing analysis results. In eDetect, we propose a gating strategy to distinguish correct and incorrect image
analysis results by visualizing image features based on principal component analysis. We demonstrate
that this approach can substantially accelerate the data correction process and improve the accuracy of im-
aging data analysis. eDetect is well documented and designed to be user friendly for non-expert users. It is
freely available at https://sites.google.com/view/edetect/ and https://github.com/Zi-Lab/eDetect.
INTRODUCTION
Live cell imaging has been widely used in monitoring cellular processes and dynamics at the single-cell level (Ni
et al., 2018; Specht et al., 2017; White et al., 2018). During the course of these studies, large volumes of time-lapse
images are often generated by automatic microscopes, which poses a challenge in quantifying cellular dynamics
from these datasets with high precision (Skylaki et al., 2016). In the past, computational tools have been devel-
oped to enable automated analysis of large image datasets (Blanchoud et al., 2015; Carpenter et al., 2006;
Cooper et al., 2017; de Chaumont et al., 2012; Held et al., 2010; Hilsenbeck et al., 2017; Liepe et al., 2016; Winter
et al., 2016). However, the errors in the automated analyses impaired the accuracy in quantifying long-term
single-cell dynamics. In most cases, fully automatic algorithms cannot guarantee 100% accuracy (Ulman et al.,
2017). Even a small portion of errors can result in a much larger amount of false cell lineages (Skylaki et al.,
2016). Therefore manual inspection and correction are needed (Hilsenbeck et al., 2016).
Several tools have provided functions to manually correct image data analysis results. For example,
CellProfiler and qTfy allow the users to manually edit the contours of segmented objects one by one (Car-
penter et al., 2006; Hilsenbeck et al., 2016). In addition, CellTracker, NucliTrack, LEVER, and tTt support
manual track editing (Cooper et al., 2017; Hilsenbeck et al., 2016; Piccinini et al., 2016; Winter et al.,
2016). These tools are useful, but an approach is still needed to improve the efficiency of data curation.
Here, we report an error detection and correction tool for live cell imaging data analysis (eDetect). In
eDetect, we proposed a new gating approach to classify flawed segmentation and tracking results by visu-
alizing image features in scatterplots based on principal-component analysis (PCA). As cell objects with
similar appearance often aggregate in the scatterplot, we can easily detect a group of errors from volumi-
nous time-lapse images. Similar errors can be efficiently corrected with batch operations in eDetect. In
addition, eDetect uses multiple quality control steps to achieve high accuracy in the final live cell imaging
analysis results. In summary, eDetect is a comprehensive software tool that integrates cell segmentation,
feature extraction, cell tracking, and efficient data curation. 1Otto-Warburg Laboratory,
Max Planck Institute for
Molecular Genetics,
RESULTS Berlin 14195, Germany
2Lead Contact
eDetect Provides a Fast Way to Detect Segmentation Errors
*Correspondence:
We first used eDetect to perform cell segmentation on the live cell imaging data of mouse stem cells, which zhike.zi@molgen.mpg.de
is a benchmark dataset (Fluo-N2DH-GOWT1) from the Cell Tracking Challenge (Maska et al., 2014; Ulman https://doi.org/10.1016/j.isci.
et al., 2017). The results of automatic segmentations are shown in the image display window (Figure 1A). We 2019.02.004
iScience 13, 1–8, March 29, 2019 ª 2019 The Author(s). 1
This is an open access article under the CC BY-NC-ND license (http://creativecommons.org/licenses/by-nc-nd/4.0/).A B
C D
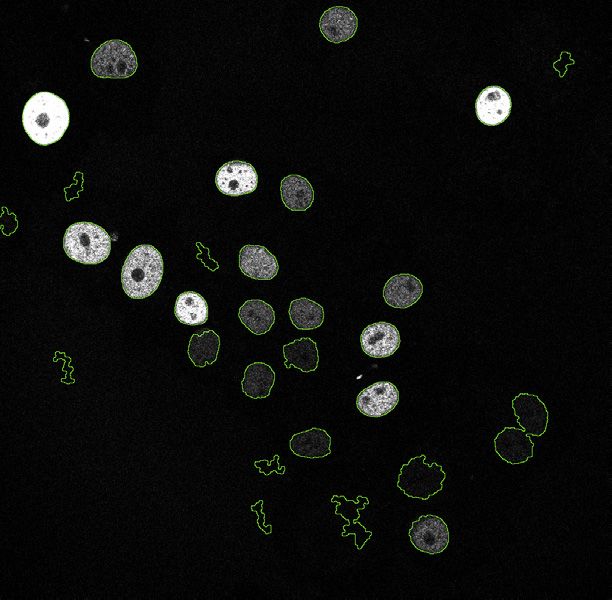
Figure 1. Main Features of eDetect
(A) Main interface of eDetect.
(B) Segmentation gating helps the users to separate correct and incorrect segmentation objects into different groups. Representative correct and incorrect
segmentation objects are shown for different groups.
(C) Batch correction of segmentation errors. Segmentation gating enables splitting a batch of under-segmentations (red points in panel B) or deleting
irregular segmentations (green points in panel B) in all frames with one batch operation.
(D) Cell pair gating function in eDetect. The red polygon gate indicates the likely misassigned cell divisions in the cell tracking. An example of misassigned
cell division is shown.
found that the application of automatic segmentation algorithms can result in different types of errors such
as under-segmentations (multiple adjacent nuclei are labeled as one object), over-segmentations (one nu-
cleus is divided into multiple objects), and irregular shapes. To efficiently detect these errors, eDetect pro-
vides a function of segmentation gating, which uses a scatterplot to visualize image features based on PCA.
Each point in this plot represents a segmented object. As shown in Figure 1B, the correct and wrong seg-
mentation objects are well separated and displayed as different groups. By clicking on the points in the
scatterplot, the corresponding segmentation objects are highlighted in the image display window. In
this way, the users can easily inspect and identify different groups of segmentation errors.
eDetect Can Correct a Group of Errors with Batch Operations
To further improve the efficiency of error correction, eDetect provides both manual and batch operations
for splitting and deleting cell segmentations. When the same type of segmentation errors are grouped
2 iScience 13, 1–8, March 29, 2019Figure 2. Cell Lineages Display in eDetect Improves the Accuracy of Live Cell Imaging Analysis Results
eDetect enables the detection of other overlooked errors with heatmap visualization. Two examples of errors in cell lineages results are zoomed in and
shown on the right: (i) abnormal cell divisions (the cell division between frame #48 and #49 is misassigned), and (ii) outliers (the highlighted nucleus in frame
#203 has an inaccurate segmentation).
together in the PCA plot, eDetect can correct these types of errors with a batch operation after selecting
them with a polygon. For example, the cluster of under-segmentations can be corrected by one click of
splitting objects in eDetect (Figure 1C). Similarly, the irregular non-cell segmentations can be easily dis-
carded with one ‘‘Delete objects’’ operation.
Multiple Quality Control Steps Improve the Accuracy of Live Cell Imaging Data Analysis
Although segmentation gating can assist the users to correct segmentation errors efficiently, some mis-
takes may still exist. Therefore eDetect provides additional steps to improve the accuracy of data analysis.
To illustrate this feature, we applied eDetect to analyze a live cell imaging dataset (HaCaT-FUCCI) from hu-
man HaCaT cells that stably express the CFP-H2B nuclear marker and mCherry-Geminin FUCCI cell cycle
indicator proteins (Sakaue-Sawano et al., 2008).
To improve the precision of cell tracking, eDetect uses cell pair gating to visualize identified cell divisions in
another PCA-based scatterplot. eDetect automatically locates and marks the corresponding pair of cells in
the original image when the user points at a cell division pair (Figure 1D). By inspecting the highlighted
pairs of cells, the users can find and correct misassigned cell divisions.
As the last quality control module in eDetect, cell lineages display window assists the users to identify
missed errors from previous steps. This is implemented by visualizing different measurements (e.g., nuclear
area) of the objects in cell lineages with a heatmap. In general, nuclear area changes gradually under
normal cell growth and only shows abrupt changes during cell divisions. The users can easily find abnormal-
ities such as abnormal cell divisions, abrupt changes of nuclear sizes, and incomplete cell lineages (Fig-
ure 2). eDetect can assist us to check and correct these abnormalities in convenient ways. For example,
eDetect has an automatic outlier detection function to mark abrupt changes within cell lineage branches.
In addition, it can generate a synchrogram (a sequence of images of the selected cell lineage), which facil-
itates the check on the correctness of cell lineages (Sigal et al., 2006). After multiple error correction steps,
iScience 13, 1–8, March 29, 2019 3we can accurately quantify the dynamics of the cell cycle sensor protein mCherry-Geminin in individual HaCaT cells (Figure S1). Compatibility of eDetect with CellProfiler eDetect can be used together with CellProfiler to maximize its interoperability. The users can first perform image preprocessing and segmentation with CellProfiler and then import the results into eDetect for error detection and correction. As CellProfiler provides advanced algorithms and pipelines for image analysis, the compatibility of eDetect with CellProfiler will improve the broad application of eDetect for live cell imaging analysis. Evaluation of eDetect Performance to Detect and Correct Errors in Live Cell Imaging Data Analysis To evaluate the effectiveness and time cost of eDetect in error detection and correction, we first performed automatic data analysis in CellProfiler (CellProfiler*) and eDetect (eDetect*) without any corrections. In par- allel, we imported the automatic analysis results from CellProfiler and then performed additional error correction with eDetect (CellProfiler+). In addition, we implemented automatic image analysis and error correction with eDetect (eDetect). Performance was quantified based on segmentation accuracy (SEG), tracking accuracy (TRA), complete tracks (CT) and recall of complete lineages (RCL). The RCL score mea- sures the fraction of cells (including their descendants) that are correctly tracked from the first frame to the last frame of the movie. A detailed description of the performance metrics is provided in the Trans- parent Methods. The performance scores were calculated for four datasets, consisting of an imaging data- set HaCaT-FUCCI and three training datasets from the Cell Tracking Challenge. As shown in Figure 3, eDetect can improve the performance of data analyses on different datasets by implement- ing error correction (comparing eDetect* and eDetect). The average values of SEG and TRA for the tested four datasets are increased by 0.04 and 0.10, respectively. More importantly, the average values of CT and RCL are increased to a larger extent, by 0.55 and 0.38, respectively. Similar performance augmentation is observed by comparing CellProfiler* and CellProfiler+. The improvement of CT and RCL values is more apparent when a long-term live cell imaging dataset is analyzed. For the 2-day imaging dataset HaCaT-FUCCI, although auto- matic algorithms in CellProfiler* and eDetect* reached very good SEG and TRA scores, the corresponding CT and RCL values are very low. This result indicates that a small portion of segmentation and tracking errors occurring in the automatic analysis can lead to a lot of errors in CT, which need to be corrected to reach valid conclusions. By performing error detection and correction in eDetect, the RCL value was increased from 0.111 to 1 with about 9 min of error correction on HaCaT-FUCCI dataset. The RCL value is especially important to draw biological conclusions when a reconstruction of complete cell lineages is needed. Therefore, eDetect is very useful especially for long-term imaging data analysis. In general, eDetect is efficient and has a low time cost (Figure 3). The execution time (TIM) for the automatic analysis step is less than 1 min for six tested imaging videos running on windows with eight CPU cores (Intel Core i7-6,700 Processor, 3.4 GHz). The time used in the error detection and correction steps (TIM_EDC) depends on the performance of automatic segmentation algorithms and the size of the image dataset. The error correction steps took about 10–90 min for six of the analyzed videos with total number of frames ranging between 65 and 206. For the video #2 of Fluo-N2DH-SIM+ dataset, the performance measures are relative poor when automatic analyses were performed in both CellProfiler* and eDetect*. This might be caused by the artificial noise introduced in this simulated dataset. In this case, several hours of manual correction of segmentations are needed to substantially improve the accuracy of data analysis. We next compared eDetect with the top-three performing methods from Cell Tracking Challenge using three benchmarking datasets (Figure 4). In terms of the SEG and TRA scores, eDetect has comparable per- formance to those of top-performing methods. It is important to note that, with the function of error detec- tion and correction, eDetect could achieve the best performance in the measurements of complete tracks and recall of complete lineages. These results highlight the importance of error correction in long-term live cell imaging data analysis. DISCUSSION The quantification of long-term single-cell dynamics is crucial for understanding cell signaling dynamics and cell fate in development. Although improving the accuracy of automatic algorithms is very important 4 iScience 13, 1–8, March 29, 2019
Figure 3. The Performance of Error Detection and Correction Function in eDetect
The performance values were obtained with or without additional error correction steps in eDetect. CellProfiler*: automatic pipeline analysis with CellProfiler.
CellProfiler+: automatic pipeline analysis was performed with CellProfiler first and then the results were imported to eDetect and additional error detection
and correction was performed. eDetect*: automatic analysis with eDetect. eDetect: automatic analysis plus error detection and correction in eDetect.

for live cell imaging data analysis (Maska et al., 2014; Ulman et al., 2017), an efficient curation tool is also
urgently needed because a small fraction of errors, especially occurring earlier in the videos, could lead
to a large fraction of errors in the complete cell lineages. In eDetect, we proposed a PCA-based approach
to detect and correct errors, which substantially reduces the time for manually pinpointing errors from
massive image datasets. In addition, eDetect can help us to correct or remove errors with one-click batch
operations. Last, but not least, multiple quality control steps ensure a high precision in the final imaging
analysis results.

Despite its effectiveness, segmentation gating in eDetect is inherently limited: it requires the users to
customize PCA input variables. In practice, it is difficult to completely separate correct and incorrect

                                                                                                                       iScience 13, 1–8, March 29, 2019       5
Figure 4. Comparison of eDetect with Top Three Performing Methods from the Cell Tracking Challenge For each dataset, the performance scores were computed by the average of scores from two training videos. The color code below indicates the top three performing methods submitted by the corresponding participants in Cell Tracking Challenge. segmentations at once. The users can achieve accurate segmentations by applying multiple gating steps with different PCA inputs even if each round of gating is not ideal. Moreover, overlooked errors can still be found in subsequent quality control steps. On the other hand, supervised learning methods have been pre- viously used for phenotypic analysis of high-content imaging data (Piccinini et al., 2017; Ramo et al., 2009; Smith et al., 2018). In the future, these methods could be potentially used in eDetect to detect segmenta- tion errors. Here, we demonstrated eDetect’s capability to detect and correct errors in live cell imaging data analysis. Making sense of large imaging datasets is a demanding challenge that requires powerful and efficient computational tools. The development of eDetect will be valuable for improving the precision of live cell imaging data analysis. Limitations of This Study Current release of eDetect does not provide multiple algorithms for segmentation and tracking. The per- formance of automatic analysis in eDetect may not be suitable for certain datasets. The compatibility of eDetect with CellProfiler offers the choice of various segmentation and tracking methods from CellProfiler, but it requires additional pipeline setup work. In the future, eDetect could be improved by integrating 6 iScience 13, 1–8, March 29, 2019
more established methods for segmentation and tracking. In addition, there is also a strong demand for the
analysis of high-throughput time-lapse datasets. Although eDetect can in principle handle these datasets,
it would require a large amount of manual labor. To address this challenge, it would be helpful to apply
machine learning methods for error detection and correction.

METHODS
All methods can be found in the accompanying Transparent Methods supplemental file.

SUPPLEMENTAL INFORMATION
Supplemental Information includes Transparent Methods, one figure, and one table and can be found with
this article online at https://doi.org/10.1016/j.isci.2019.02.004.

ACKNOWLEDGMENTS
The authors want to thank Dr. E. Bártová for providing a dataset from the Cell Tracking Challenge and
Dr. Xuedong Liu and Adrian Ramirez for proofreading of the manuscript. We are grateful to anonymous
reviewers for their constructive suggestions, which have helped us to improve eDetect. This work was sup-
ported by grants to Z.Z. from the Federal Ministry of Education and Research (BMBF, Germany)-funded
e:Bio SyBioT project (031A309) and the German Research Foundation (DFG, GRK 1772, Computational Sys-
tems Biology). H.H. was supported by a fellowship from International Max Planck Research School for
Computational Biology and Scientific Computing.

AUTHOR CONTRIBUTIONS
H.H. developed the software and implemented performance evaluation on benchmark datasets. G.W.
generated some live cell imaging data for testing this software. Y.L. tested the tool. Z.Z. conceived and su-
pervised the project, provided input on the design and features of the application, and tested the tool. Z.Z.
wrote the paper with input from H.H.

DECLARATION OF INTERESTS
The authors declare no competing interests.

Received: September 27, 2018
Revised: January 17, 2019
Accepted: February 4, 2019
Published: March 29, 2019

REFERENCES
Blanchoud, S., Nicolas, D., Zoller, B., Tidin, O.,     Held, M., Schmitz, M.H., Fischer, B., Walter, T.,      reconstruction of cell and particle tracks from 3D
and Naef, F. (2015). CAST: an automated                Neumann, B., Olma, M.H., Peter, M., Ellenberg,         live imaging data. Cell Syst. 3, 102–107.
segmentation and tracking tool for the analysis of     J., and Gerlich, D.W. (2010). CellCognition: time-
transcriptional kinetics from single-cell time-        resolved phenotype annotation in high-                 Maska, M., Ulman, V., Svoboda, D., Matula, P.,
lapse recordings. Methods 85, 3–11.                    throughput live cell imaging. Nat. Methods 7,          Matula, P., Ederra, C., Urbiola, A., España, T.,
                                                       747–754.                                               Venkatesan, S., and Balak, D.M. (2014). A
                                                                                                              benchmark for comparison of cell tracking
Carpenter, A.E., Jones, T.R., Lamprecht, M.R.,                                                                algorithms. Bioinformatics 30, 1609–1617.
Clarke, C., Kang, I.H., Friman, O., Guertin, D.A.,     Hilsenbeck, O., Schwarzfischer, M., Loeffler, D.,
Chang, J.H., Lindquist, R.A., Moffat, J., et al.       Dimopoulos, S., Hastreiter, S., Marr, C., Theis,
                                                       F.J., and Schroeder, T. (2017). fastER: a user-        Ni, Q., Mehta, S., and Zhang, J. (2018). Live-cell
(2006). CellProfiler: image analysis software for                                                             imaging of cell signaling using genetically
identifying and quantifying cell phenotypes.           friendly tool for ultrafast and robust cell
                                                       segmentation in large-scale microscopy.                encoded fluorescent reporters. FEBS J. 285,
Genome Biol. 7, R100.                                                                                         203–219.
                                                       Bioinformatics 33, 2020–2028.

Cooper, S., Barr, A.R., Glen, R., and Bakal, C.                                                               Piccinini, F., Balassa, T., Szkalisity, A., Molnar, C.,
                                                       Hilsenbeck, O., Schwarzfischer, M., Skylaki, S.,       Paavolainen, L., Kujala, K., Buzas, K., Sarazova, M.,
(2017). NucliTrack: an integrated nuclei tracking      Schauberger, B., Hoppe, P.S., Loeffler, D.,
application. Bioinformatics 33, 3320–3322.                                                                    Pietiainen, V., Kutay, U., et al. (2017). Advanced
                                                       Kokkaliaris, K.D., Hastreiter, S., Skylaki, E., and    cell classifier: user-friendly machine-learning-
                                                       Filipczyk, A. (2016). Software tools for single-cell   based software for discovering phenotypes in
de Chaumont, F., Dallongeville, S., Chenouard,         tracking and quantification of cellular and            high-content imaging data. Cell Syst. 4, 651–
N., Herve, N., Pop, S., Provoost, T., Meas-Yedid,      molecular properties. Nat. Biotechnol. 34,             655.e5.
V., Pankajakshan, P., Lecomte, T., Le Montagner,       703–706.
Y., et al. (2012). Icy: an open bioimage informatics                                                          Piccinini, F., Kiss, A., and Horvath, P. (2016).
platform for extended reproducible research.           Liepe, J., Sim, A., Weavers, H., Ward, L., Martin,     CellTracker (not only) for dummies.
Nat. Methods 9, 690–696.                               P., and Stumpf, M.P. (2016). Accurate                  Bioinformatics 32, 955–957.

                                                                                                                       iScience 13, 1–8, March 29, 2019            7
Ramo, P., Sacher, R., Snijder, B., Begemann, B., of nuclear proteins. Nat. Methods 3, Ulman, V., Maska, M., Magnusson, K.E.,
and Pelkmans, L. (2009). CellClassifier: supervised 525–531. Ronneberger, O., Haubold, C., Harder, N.,
learning of cellular phenotypes. Bioinformatics Matula, P., Matula, P., Svoboda, D., and
25, 3028–3030. Skylaki, S., Hilsenbeck, O., and Schroeder, T. Radojevic, M. (2017). An objective comparison of
(2016). Challenges in long-term imaging and cell-tracking algorithms. Nat. Methods 14, 1141–
quantification of single-cell dynamics. Nat. 1152.
Sakaue-Sawano, A., Kurokawa, H., Morimura, T.,
Biotechnol. 34, 1137–1144.
Hanyu, A., Hama, H., Osawa, H., Kashiwagi, S.,
Fukami, K., Miyata, T., Miyoshi, H., et al. (2008). White, M.D., Zhao, Z.W., and Plachta, N. (2018).
Smith, K., Piccinini, F., Balassa, T., Koos, K.,
Visualizing spatiotemporal dynamics of In vivo imaging of single mammalian cells in
Danka, T., Azizpour, H., and Horvath, P. (2018).
multicellular cell-cycle progression. Cell 132, development and disease. Trends Mol. Med. 24,
Phenotypic image analysis software tools for
487–498. 278–293.
exploring and understanding big image data
from cell-based assays. Cell Syst. 6, 636–653.
Sigal, A., Milo, R., Cohen, A., Geva-Zatorsky, N., Winter, M., Mankowski, W., Wait, E., Temple, S.,
Klein, Y., Alaluf, I., Swerdlin, N., Perzov, N., Specht, E.A., Braselmann, E., and Palmer, A.E. and Cohen, A.R. (2016). LEVER: software tools for
Danon, T., Liron, Y., et al. (2006). Dynamic (2017). A Critical and comparative review of segmentation, tracking and lineaging of
proteomics in individual human cells fluorescent tools for live-cell imaging. Annu. Rev. proliferating cells. Bioinformatics 32, 3530–
uncovers widespread cell-cycle dependence Physiol. 79, 93–117. 3531.
8 iScience 13, 1–8, March 29, 2019ISCI, Volume 13 Supplemental Information eDetect: A Fast Error Detection and Correction Tool for Live Cell Imaging Data Analysis Hongqing Han, Guoyu Wu, Yuchao Li, and Zhike Zi
Supplemental Figures and Legends

Figure S1: The dynamics of mCherry-Geminin protein in HaCaT single cells, which were
quantified with eDetect. Related to Figure 2.!

!

!
Supplementary Tables
           Table S1. Names and IDs of shape and additional features, Related to Figure 1.

     ID in Segmentation Gating           Feature Category                   Feature Name
        and Cell Pair Gating
               v{1}                           shape1                             Area
               v{2}                            shape                         Eccentricity
               v{3}                            shape                         Orientation
               v{4}                            shape                           Solidity
               v{5}                            shape                          Perimeter
               v{6}                            shape                        MeanIntensity
               v{7}                         additional2                   radial distribution
1
  The meanings of shape features can be found at:
    https://www.mathworks.com/help/images/ref/regionprops.html
2
  The additional feature “radial distribution” describes how intensity varies as a function of distance
from the nearest point in the border of the object.
Transparent Methods Cell segmentation eDetect uses an adaptive thresholding approach to segment cell nuclei from nuclear marker images (Bradley and Roth, 2007). To de-clump the clustered nuclei, we apply watershed transformation (Meyer, 1994) on a filtered distance map of nuclei contours (Schneider et al., 2012). Because single nuclei sometimes are wrongly split into smaller objects, we adopt a hierarchical procedure to merge directly adjacent objects based on the areas of minimum enclosing ellipses (Moshtagh). Feature extraction eDetect extracts cellular features from nuclei contours and nuclear marker images. It provides the options of computing 5 categories of features, i.e. shape, intensity, Haralick features (Haralick and Shanmugam, 1973), Zernike features (Boland et al., 1998) and additional features. By default, eDetect calculates shape and additional features, which are listed in Table S1. The calculations of intensity, Haralick and Zernike features are implemented using the source code of CellProfiler (Carpenter et al., 2006). Cell tracking eDetect adopts a constrained nearest-neighbor strategy for cell tracking. For each object (except the objects in the first frame), eDetect calculates its distances to all the objects in the previous frame. The closest object in the previous frame is the predecessor, unless this shortest distance is still larger than a predefined threshold. Sometimes, consecutive frames are not perfectly aligned to each other in the x-y plane because of paraxial shifts of the field. We tackle this problem using an optimization-based approach. For each frame, before calculating distances, eDetect subtracts a “shift vector” from the coordinates of all objects in the current frame. Therefore, the assignment of predecessors depends on the value of this “shift vector”, and the sum of the aforementioned shortest distances is a function of the “shift vector”. eDetect searches for the “shift vector” (within a square whose size is user-defined) that minimizes this function. The assignment that is associated to this minimal is the tracking result. Measurements In eDetect, the following measurements are calculated for different fluorescent channels (the channels for signal extraction): nuclei median and mean intensities, cytoplasm median and mean intensities, and nuclear-cytoplasmic ratios of median and mean intensities. To approximate nuclei regions, we shrink the nuclear segmentations by a user-defined distance to exclude nuclear membrane pixels. The cytoplasm regions are approximated using peri-nuclear ring regions, whose inner and outer contours are expanded from nuclear segmentations. In order to compensate medium illumination, background intensity is subtracted from both nuclei and cytoplasm intensities. To generate the foreground region, we expand the nuclear segmentations by a large distance that is the maximum of the following two values: (1) the largest object diameter and (2) twice of the distance by which nuclear segmentations are expanded to generate the outer contour of the peri-nuclear ring regions. Afterwards, we derive the background region by removing the foreground region from the whole image.
In eDetect, to shrink an object by a distance of !, we remove the contour pixels of the object ! times
iteratively. Similarly, to expand an object by a distance of !, we add a layer of pixels to the exterior of
the object ! times iteratively. We implemented both shrinkage and expansion operations with an
algorithm of morphological operations on binary images in Matlab.

Segmentation gating and cell pair gating
eDetect segmentation gating and cell pair gating employ principal component analysis (PCA) to
project high dimensional cellular features onto a 2D plane, where the data is visualized with scatter
plots. PCA converts a data table, in which the observations are described by a set of possibly
correlated variables, into a new one, where the new variables (i.e.: principal components) are
uncorrelated (Abdi and Williams, 2010). From the first principal component (PC) to the last one, each
PC maximizes the data variance under the constraint that it is orthogonal to all the preceding ones. In
eDetect, PC1 and PC2 are used as the x- and y-axis variables in the scatter plots. The meanings of
imaging features for the PCA input are listed in Table S1.

In cell pair gating, apart from the variables specified in the formula, the input to PCA additionally
includes 3 default variables: the 3 sharp angles between 3 lines. The 3 lines are: the major axes of the
2 objects and the line that passes through the centroids of the 2 objects.

Outlier detection in cell lineages display
In eDetect, abrupt changes of cellular measurements are detected based on the median absolute
deviation (Leys et al., 2013). eDetect calculates relative difference of measurements between each cell
and its predecessor. Among all the relative differences, those whose distances to the median value are
larger than a certain predefined number of standard deviations are defined as outliers.

The calculation of performance scores
Segmentation accuracy (SEG), tracking accuracy (TRA) and complete tracks scores (CT) are
calculated using the evaluation software packages provided in the Cell Tracking Challenge website.
Recall of complete lineages (RCL) is calculated with a customized MATLAB script.

Complete lineages are lineages that start in the first frame and end in the last frame of the entire video.
The formula of recall (or sensitivity) is given below (!": true positive, !": false positive, !": false
negative.):

                                                        !"
                                           !"#$%% !
                                                      !" ! !"

The ground truth of HaCaT-FUCCI dataset was produced by manually correcting the result of eDetect
automatic analysis until the tracks were correct and segmentations were accurate under human
inspection.
Supplemental References Abdi, H., and Williams, L.J. (2010). Principal component analysis. Wiley interdisciplinary reviews: computational statistics 2, 433-459. Boland, M.V., Markey, M.K., and Murphy, R.F. (1998). Automated recognition of patterns characteristic of subcellular structures in fluorescence microscopy images. Cytometry 33, 366-375. Bradley, D., and Roth, G. (2007). Adaptive thresholding using the integral image. Journal of graphics tools 12, 13-21. Carpenter, A.E., Jones, T.R., Lamprecht, M.R., Clarke, C., Kang, I.H., Friman, O., Guertin, D.A., Chang, J.H., Lindquist, R.A., Moffat, J., et al. (2006). CellProfiler: image analysis software for identifying and quantifying cell phenotypes. Genome Biol 7, R100. Haralick, R.M., and Shanmugam, K. (1973). Textural features for image classification. IEEE Transactions on systems, man, and cybernetics, 610-621. Leys, C., Ley, C., Klein, O., Bernard, P., and Licata, L. (2013). Detecting outliers: Do not use standard deviation around the mean, use absolute deviation around the median. Journal of Experimental Social Psychology 49, 764-766. Meyer, F. (1994). Topographic distance and watershed lines. Signal processing 38, 113-125. Moshtagh, N. Minimum volume enclosing ellipsoid. Schneider, C.A., Rasband, W.S., and Eliceiri, K.W. (2012). NIH Image to ImageJ: 25 years of image analysis. Nature methods 9, 671.
You can also read