Voluntary product stewardship scheme - PUBLIC PLACE RECYCLING 31 March 2020 - The Packaging Forum
←
→
Page content transcription
If your browser does not render page correctly, please read the page content below
PUBLIC PLACE RECYCLING

Voluntary product
stewardship scheme
31 March 2020
“It’s not easy for me to become a
tidy Kiwi, considering I’m a lion. So
if I can do it, you can too! Looking
after the environment is much
easier than you think! For example,
I have this cool re-usable cup I use
for all my coffees. Using a cup like
mine keeps you from needing a
single use cup which often ends up
in our oceans or in landfill. Oh! And
recycling is even easier! You just
put things in the correct bin,
S I M P L E #tidykiwi #tidylion
#leoothelion #wellingtonlions
#rugby”
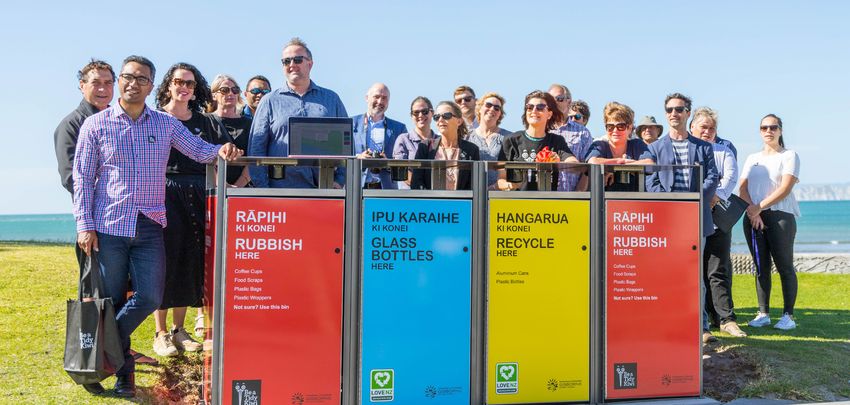
table of contents

1. SCOPE OF SCHEME              3
Reporting period                 3
Scheme governance                4
Review of the scheme             5
Projects funded by the scheme    6
Health & safety                  6

2. CURRENT WASTE GENERATION     7
Methodology                      7
Recovery & recycling	            8

3. OBJECTIVES & TARGETS         11
Current status                   11
Annual targets                  12
Recycling data by location      13
Waste diversion                 13
Stakeholder communications      13
Funding mechanism               15
Cost of recycling               16

4. SUMMARY OF PROJECTS          17
5. FACTORS AFFECTING SCHEME     17
6. PROMOTION OF SCHEME          19
Market research                 20
Media evaluation                22

Cover image : Launch of smart
technology bins in Gisborne

2
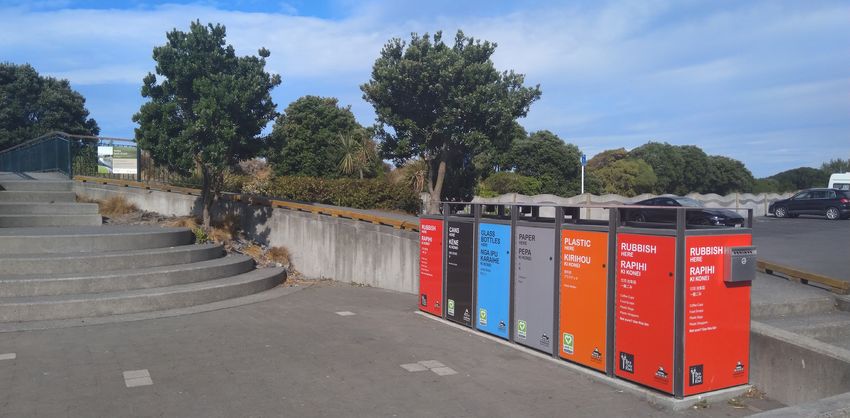
Kaikoura recycling bins

1.0                                                     From 1 April 2019, the Packaging Forum restructured
                                                        its fee structure so that all Packaging Forum
SCOPE OF SCHEME                                         members are members of the Public Place Recycling
                                                        scheme.
The scope of the Packaging Forum’s Public Place
Recycling Voluntary Product stewardship scheme          During 2019, The Public Place Recycling Scheme
includes the end of life collection of packaging        completed the final year of the “Litter Less Recycle
(and where applicable food waste) away from             More” (LLRM) Waste Minimisation Fund project which
home. The scheme includes the funding of projects,      it manages in conjunction with the Auckland Litter
infrastructure and educational programmes to            Prevention Steering Group. During the report period
increase the recovery and recycling of plastic,         the scheme allocated $25,000 as the balance of the
aluminium, paper and glass packaging from food and      final year’s contribution to the LLRM project.
beverages consumed in public places.

Public places include street locations, transport
hubs, tourism and hospitality venues, shopping malls,   1.1
stadia, canteens and other venues managed by            REPORTING PERIOD
commercial entities.
                                                        The report provides the following data:
The scheme also provides annual data on the
amount of packaging and organic waste collected         • Reports on the performance against scheme KPIs
for recycling through the Public Place Recycling Bins     to end 2019.
operated by councils.                                   • Financial period 1 April 2019 to 31 March 2020
                                                          (financial year for the scheme).
Scheme members include companies that
manufacture products or their packaging that
are typically consumed away from home such
as beverages and snack foods. The scheme
also includes venues where these products are
consumed.

The scheme is funded by brand owners, packaging
manufacturers and recyclers working with event
organizers, councils and other organisations.

3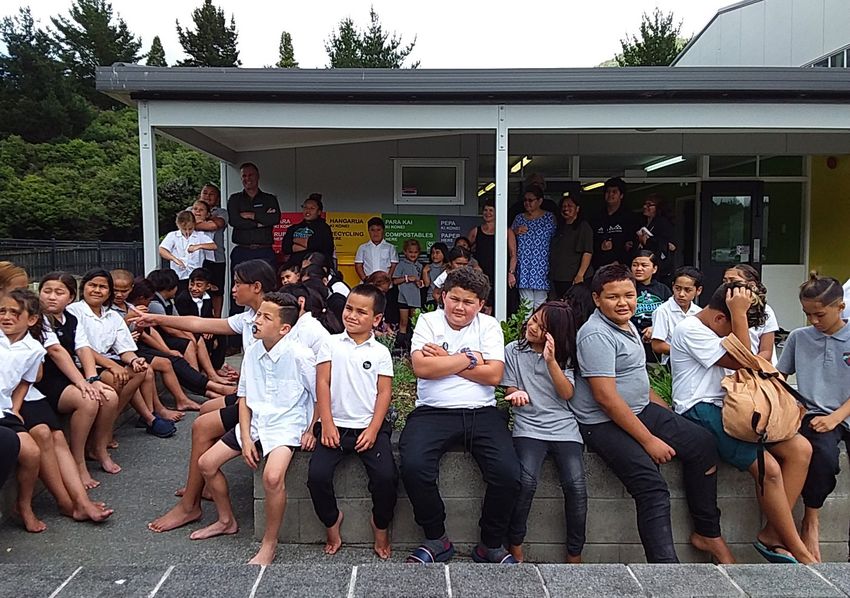
1.2
SCHEME GOVERNANCE
Following the 2019 Annual General Meeting, the PPRS    The Audit & Finance Committee comprise:
Scheme’s Steering Committee was restructured as
a Litter & Recycling Advisory Group reporting to the   Nick Baker
Packaging Forum’s Board and with financial guidance    General Manager, Visy Recycling
from the Finance and Risk Committee.                   Terri Bray
                                                       Independent, Bray Associates
The Litter & Recycling Advisory Group delivering
                                                       Gavin Fong
the PPRS Scheme for the 2019/20 financial year is:
                                                       Managing Director, Plus Pac Packaging
Nick Baker		                                           David Pasco
General Manager, Visy Recycling Chair                  Senior Commercial Manager - ANZ Supply Chain,
Rosie Cotter                                           Frucor Suntory
Sustainability Manager, DB Breweries
Gavin Fong
Managing Director, Plus Pac Packaging
Geraldine Oldham
Chief Marketing Officer, Restaurant Brands

The governing board of The Packaging Forum
appointed by the steering committees of the schemes
comprises:

Nick Baker
General Manager, Visy Recycling
Campbell Everett
Sales & Marketing Manager, Sealed Air
Malcolm Everts
Marketing Manager, Cottonsoft
Gavin Fong
Managing Director, Plus Pac Packaging
Rob Langford
Independent Chair
Amber McEwen
Corporate Affairs Director, DB Breweries
Sara Tucker
External Relations Director, Lion

4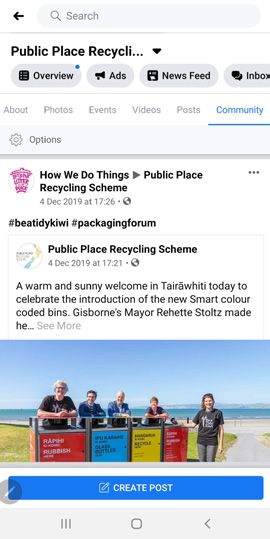
CONTINUED INCREASE IN
AWARENESS OF PUBLIC
PLACE RECYCLING BINS
1.3 2 OUT OF 3 NEW ZEALANDERS SAY
REVIEW OF SCHEME THEY HAVE PUBLIC PLACE
RECYCLING BINS IN THEIR AREA
In the year to December 2019, the PPRS has continued 2015 v 2020
to deliver on its KPI’s which are presented in Section 3.
Key numbers for the year are summarised below. 40% 64%
Achieved 10% increase in the number of permanent
recycling bins installed either directly through PPRS
83%
funding or through partnerships if soft plastic recycling
bins are excluded from the data set. Maintained overall
number of public place bins despite 73% reduction
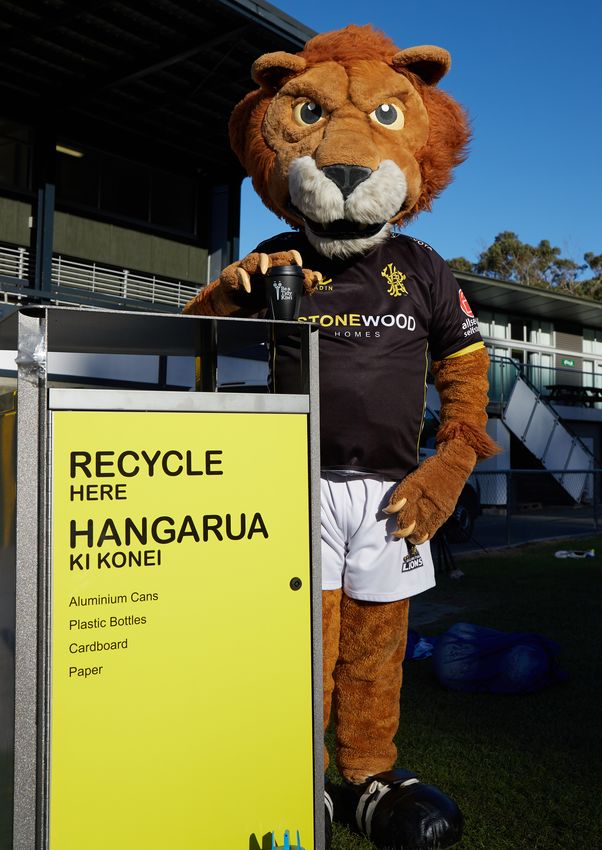
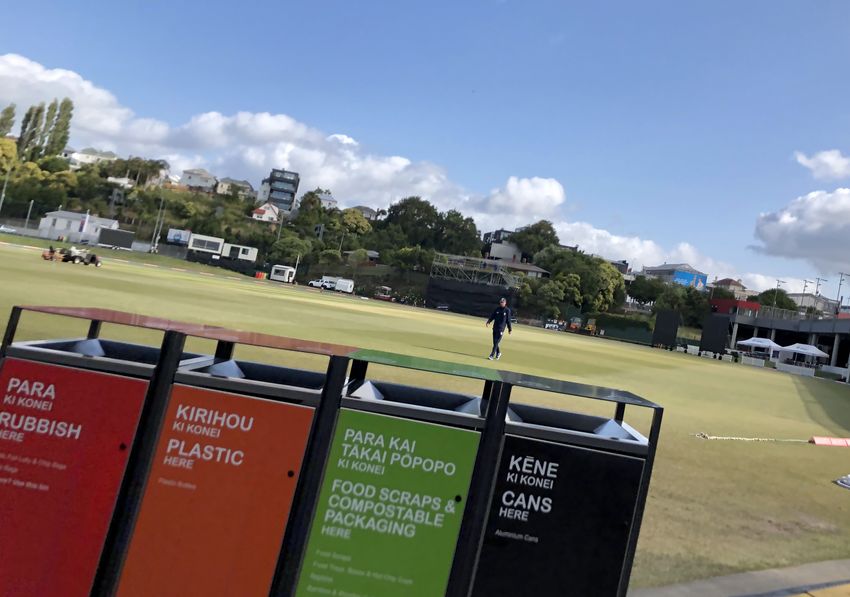
PEOPLE SAY STANDARDISED
in number of soft plastic collection facilities.1 COLOURS AND SIGNAGE
Packaging and organic waste diverted from
MAKE IT EASIER TO CHOOSE
THE RIGHT BIN
landfill through the scheme’s partners has
increased overall by 9% with packaging up
by 8.6% and organics collections by 15%.
The expansion of the Litter Less Recycle More
standardised recycling and rubbish facilities has
helped increase the local government sector share
of the total tonnage collected to 38% from 26%.
COLOUR CODING
Overall waste diversion at stadia and events has IS WORKING
increased significantly to 65% from 46% in 2018.
Events outside of sports stadia have a 79% average
recycling rate. Waste diversion at permanent THE HIGHEST LEVEL OF
public place recycling bins in malls, transport hubs, AWARENESS OF THE
DHBs etc increased slightly from 34% to 35%. COLOUR CODED BINS
WAS AMONG YOUNGER
Scheme Membership & Funding RESPONDENTS
The Packaging Forum membership now covers
an allocation to the PPRS. All members of
the Packaging Forum now contribute to the
PEOPLE SAY THERE IS
PPRS – Litter and Recycling programme.
LESS LITTER ABOUT AND
ARE DOING SOMETHING
The scheme is now delivering close to a ABOUT IT
$1 million per annum in kind investment in public
place recycling and litter abatement.
79% OF PEOPLE WILL
In Kind Income Type Income $ Income $
2018 2019
WALK >10 METRES TO
Servicing costs including 635,396 818,000
FIND A BIN
LLRM bins and EYEFI
2019 v 2020
Capital expenditure 144,294 103,000
Promotional Costs 50,000 39,000 44% 29%
Total 829,690 960,000 SAID THERE WAS A PROBLEM
WITH LITTER IN THEIR AREA
1 Soft plastic collection bins have been included in the data set since 1 IN 3 WILL ASK OTHERS TO PICK
2016 prior to the establishment of the Soft Plastics Recycling Scheme.
UP LITTER IF THEY SEE THEM
DROP IT AND A SIMILAR NUMBER
WILL PICK IT UP THEMSELVES
5
2019/2020 Funded Projects
The scheme has allocated $59,114 to projects which
increase the availability of public place recycling
and rubbish facilities and to education and research
programmes.

Events | $7,164 | 12%
Capital Expenditure | $19,450 | 33%
National Litter Project | $25,000 | 42%
Research & Education | $7,500 | 13%

Health & Safety
All recipients of funding from the PPRS are required
to provide details of how their project is managed
according to their health & safety policy.

                                                       Te Kura Taumata
                                                       o Panguru school
                                                       receives a mobile
6                                                      bin frame unit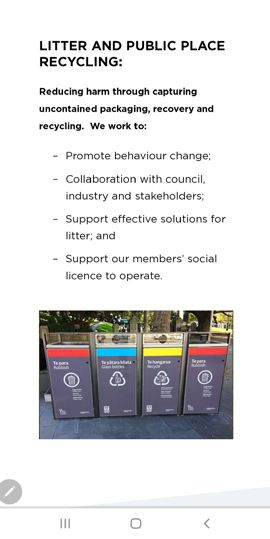
2.0                                                        2.1
CURRENT WASTE                                              METHODOLOGY
GENERATION – MASS                                          Kilograms are provided by location either as a
BALANCE                                                    commingled stream or separated into material type.

Packaging and organic waste collected in public            Some locations provide number of empties by bin
places is measured in tonnes. Data has been collected      size or cubic metres of recycling and this is converted
for the Love NZ branded public place recycling bins        into kilograms based on an assessment of average
since September 2011.                                      kilogram as follows:

The data is now maintained as follows:                     Figure 1: Conversion Volume to Weight

1.   Recycling data for commercial entities which
     include transport hubs, stadia, leisure facilities.   Material                      Volume        KG per bin
                                                           Plastic                       240 litre     31kg
2.   Recycling data for councils and commercial
                                                           Cardboard/Paper               240 litre     59kg
     entities combined.
                                                           Glass                         120 litre     70kg
                                                           Glass                         240 litre     140kg
                                                           Plastic/Cans/Paper            240 litre     33kg
                                                           Commingled incl glass         240 litre     59kg
                                                           Glass                         1m 3
                                                                                                       583kg
                                                           Plastic/Cans or Organics      1m 3
                                                                                                       130kg
                                                           Mixed                         1m3           231kg
                                                           Paper                         1m 3
                                                                                                       231kg

                                                           It is to be noted that glass recovered in public place
                                                           recycling bins is also included in the mass balance
                                                           collated by the glass packaging product stewardship
                                                           scheme.
                                                           We reviewed the conversion rates during 2015 and
                                                           have retained these again in 2019 as representative
                                                           across a range of different venues.

7
2.2
RECOVERY & RECYCLING
The scheme measures what is collected through              The amount collected for diversion from landfill from
public place recycling facilities for participating        those organisations and councils which report their
scheme members or stakeholders. It does not verify         recycling data is 7596 tonnes of packaging against a
how what is collected is recycled.                         target 5755 tonnes (excluding organic waste collected
                                                           for composting).
The scheme collates data supplied by various
waste management companies including Waste                 This represents an increase of around 9% over 2018.
Management, EnviroNZ, Rubbish Direct, Reclaim              The average monthly recovery rate is 633 tonnes.
and Smart Environmental. These companies have
markets for the recyclables collected and the scheme
assumes that product collected and measured from
commercial entities and councils and supplied to the
scheme either directly or via the owner of the “bins”
is processed for recycling either on shore or off shore.
Enviro NZ, Waste Management, Smart Environmental
and Visy NZ are members of the Packaging Forum.

Figure 2: Performance Jan 2019-Dec 2019
commercial and councils

ANNUAL RECYCLING & ORGANICS
PERFORMANCE 2014-2019

10,000

 8,000

 6,000

4,000

 2,000

      0
           14

                    15

                             16

                                         17

                                               18

                                                     19
                                    20
                           20

                                                    20
                 20

                                              20
          20

            TOTAL RECYCLING
            TOTAL RECYCLING + ORGANICS
            (LINEAR) TOTAL RECYCLING

ORGANICS                                                          RECYCLING PER MONTH
    800
    700                                                               350
    600                                                               300
    500                                                               250
                                                                      200
                                                                000

8   400
                                                                       150
    300
    200                                                               100
Figure 3: Breakdown of recycling data 2019
Total
Annual Total Recycling &
Tonnes Mixed Plastic Cans Glass Paper Recycling Organic Organic
Commercial 1379 60 0 521 2482 4442 740 5182
Councils 742 12 7 1599 793 3153 0 3153
Total 2121 72 7 2120 3275 7595 740 8335
Figure 4: Breakdown of recycling data 2018
Total
Annual Total Recycling &
Tonnes Mixed Plastic Cans Glass Paper Recycling Organic Organic
Commercial 1553 97 1 698 2827 5176 642 5818
Councils 334 216 6 455 805 1818 0 1818
Total 1887 313 7 1153 3632 6994 642 7636
Figure 5: Breakdown of recycling data 2017
Total
Annual Total Recycling &
Tonnes Mixed Plastic Cans Glass Paper Recycling Organic Organic
Commercial 1720 144 4 449 2399 4716 580 5296
Councils 206 215 11 387 715 1532 0 1532
Total 1926 359 15 836 3114 6248 580 6830
Figure 6: Breakdown of recycling data 2016
Total
Annual Total Recycling &
Tonnes Mixed Plastic Cans Glass Paper Recycling Organic Organic
Commercial 1828 75 1 155 2093 4152 379 4531
Councils 286 17 11 375 462 1151 11 1162
Total 2114 92 12 530 2555 5303 390 5693
Figure 7: Breakdown of recycling data 2015
Total
Annual Total Recycling &
Tonnes Mixed Plastic Cans Glass Paper Recycling Organic Organic
Commercial 1551 73 2 239 1460 3326 335 3661
Councils 177 14 9 294 122 615 0 615
Total 1728 87 11 533 1582 3941 335 4276
920
20
20
20
20
20
1
1
1
1
1
1
20
20
20
20
20
20
MIXED PLASTIC CANS
GLASS PAPER ORGANICS
COMMERCIAL
COUNCIL TOTAL RECYCLING
TOTAL RECYCLING + ORGANICS
(LINEAR) TOTAL RECYCLING
Figure 8: Recovery of material by material type [2014-2019] Figure 9: Organic/compostable collections [2014-2019]
TOTAL RECYCLING ORGANICS
4,000 800
3,500 700
3,000 600
2,500 500
2,000 400
1,500 300
1,000 200
500 100
0 0
14
15
16
17
18
19
14
15
16
17
18
19
20
20
20
20
20
20
20
20
20
20
20
20
MIXED PLASTIC CANS COMMERCIAL
GLASS PAPER ORGANICS COUNCIL
Figure 10: Recovery of material by material type by month 2019
RECYCLING PER MONTH
350
300 TOTAL RECYCLING
250
4,000
TONNES
200
000
150 3,500
100 3,000
50 2,500
0 2,000
1,500
N
B
AR
R
AY
N
L
G
P
V
EC
CT
JU
SE
AP
O
FE
JA
JU
AU
1,000
M
O
D
M
N
MIXED PLASTIC CANS
GLASS PAPER ORGANICS 500
0
4
15
6
17
18
19
1
1
20
20
20
20
20
20
MIXED PLASTIC CANS
GLASS PAPER ORGANICS
103.0
OBJECTIVES & TARGETS: CURRENT STATUS
Note: Actuals are presented as at end of 2019 with the differential between actual and the 2019 target identified.
Baseline Actual TARGET Actual
Objective Dec 2012 Dec 2018 Dec 2019 2019
1a Increase in packaging collected for recycling by 1375 tonne 5176 tonne 5375 tonne 4443 tonne
commercial sector
1b Increase in organic waste collected for composting 215 tonne 642 tonne 318 tonne 739 tonne
by commercial sector
2a Measure increase in packaging collected by councils 1907 tonne 6994 tonne 5755 tonne 7596 tonne
and the commercial sector
2b Measure increase in organic waste collected by 233 tonne 642 tonne 321 tonne 739 tonne
councils and the commercial sector
3 Monitor and report on recycling data by location type n/a
4 Number of permanent bins 1150 2847 3148 2854 (note: 245
soft plastic bins
removed)
5 Scheme Membership: Increase in participation 32 59 (fees) + 30 64 109
= 89
6 Increased consumer awareness of PPR bins through 800,000 OTS 59% 50% 64%
media coverage
7 Waste diversion overall 46% 46% 43%
7a Waste diversion - events 46% recycled 76% events 65% 65% events &
(events not stadia
incl. stadia) 79% events
45% stadia 63% stadia
7b Waste diversion - all venues (malls, DHB, tourism, 35% recycled 34% 39% 35%
stadia) 36% (transport 32% (transport
hubs only) hubs only)
8 Engagement with stakeholders including local 58% satisfied 48% satisfied 69% satisfied n/a
government and recycling operators 23%
dissatisfied
9 Evaluate and report on cost of recycling in public n/a see 3.5
places at events and permanent locations
10 Conduct and report on Branded Litter Survey to n/a 14% reduction Observed litter
inform scheme members and potential scheme in packaging behaviour rate2
members litter from 2015 = 29%
2 The CCAT is an environmental monitoring tool for measuring the
incidence of littering in a given area. The observed litter behaviour
rate reduced 23% from 2017 through 2019. (from 38% in 2017 down to
29% in 2019)
11ANNUAL TARGETS 2016-2020
Base Actual Target Actual Target Actual Target Actual Target
KPI Objective Dec 12 Dec 16 Dec 17 Dec 17 Dec 18 Dec 18 Dec 19 Dec 19 Dec 20
1a Packaging - commercial partners 1375 4152 4442 4716 4886 5176 5375 4443 5912
1b Organics - commercial partners 215 379 263 580 289 642 318 739 349
2a Packaging - commercial & councils 1907 5303 4757 6248 5232 6994 5755 7596 6331
2b Organics - commercial & councils 233 390 265 580 291 642 321 739 353
3 Tonnes collected for recycling by Summary to be produced for each annual report
type of collection point
4 Number of PPR bins (permanent) 1150 2342 2385 2597 2862 2847 3148 2854 3462
5 Scheme Membership (fee paying 32 83 58 90 64 86 64 109 64
and in kind)
6 Consumer awareness : awareness not 55% 46% 55% 48% 59% 50% 64% 52%
of bins in their area measured
7 Waste diversion overall 38% 41% 35% 43% 41% 46% 43% 50%
7a Waste diversion - stadia/events 46% 42% 60% 45% 63% 46% 65% 65% 70%
7b Waste diversion - transport hubs, 35% 37% 37% 34% 38% 34% 39% 35% 40%
malls, DHBs, education
8 Engagement with stakeholders 64% 65% 58% 67% 48% 69% 70%
9 Funding mechanism in place
10 Cost of recycling through PPR bins
11a Conduct nationwide branded litter
survey and count
11b Reduce litter volume by 10% 5% n/a 10%
123.1 3.3
RECYCLING DATA BY STAKEHOLDER
LOCATION COMMUNICATIONS
Shopping Malls: Average 65% recycling rate The Packaging Forum conducted research in 2019
to ascertain what members would like to see in a
There are 104 shopping malls in New Zealand with 16 new website. The two items which came through
of these over 34,000 square metres. The number of consistently were:
malls reporting to the scheme has reduced with data
available from three shopping malls. The average • Advocacy via a short and snappy e-news related to
recycling rate for those malls has increased to 65%. packaging.
• Member matching portal on website so they can
Airports: Average 35% recycling rate no change connect with other members.
There are six New Zealand airports which have both
domestic and international flights. The vast majority
of tourist arrivals to New Zealand come through
Auckland Airport which handled over 21 million
passengers in 2018.
Auckland Airport, Christchurch Airport and Wellington
Airport have been part of the Love NZ programme
since 2008. These three airports receive over 34 million
visitors in 2019 and generated over 5500 tonnes of
waste of which an estimated 35% was recycled.
In addition to the quarterly newsletter and the
Stadia: Average 63% recycling rate website portal, the PRRS connects with stakeholders
via its Facebook page and Linkedin.
There are 15 stadia in New Zealand with capacity over
16,000 patrons. The scheme receives recycling data
from 40% of these on either a regular or ad hoc basis
depending on fixtures. Data received from Wellington,
North Harbour, Waikato, Whangarei and Forsyth Barr
stadia and the Trusts Arena in Waitakere shows that
the average recycling rate has increased to 63%.
Events: Average 79% recycling rate
The average recycling rate for 21 events which were
attended by over 240,000 people was 79% with some
events achieving over 90% waste diversion. The roll out of the Let’s Put Litter in its Place campaign
continued with more than 10,000 pledges to Be a
3.2 Tidy Kiwi made. In 2019, the TV commercial reached
WASTE DIVERSION 820,879 people and the promotion played 17,500 times
on Newstalk ZB. Wellington Rugby Football Union has
STATISTICS joined the campaign with club mascot Leo the Lion
and players making their pledge.
Waste diversion as reported by those councils and
venues which provide both recycling and waste data
has increased from 41% to 42% on average. There are
differences year on year because some venues start to
introduce their waste data as well as recycling data and
some cease to provide both sets of data. See Figure 10.
13Figure 10: Recycling to Waste comparison
2015 2016 2017 2018 2019
Recycling Recycling Recycling Recycling Recycling
Location % % % % %
All locations reporting 38 38 34 41 43
Events/stadia (closed loop locations) 40 42 45 46 65
Venue e.g. transport hub, garage 37 37 34 34 35
forecourt, shopping mall, DHB, education
Recycling at the
14 Eden Park Oval3.4 FUNDING MECHANISMS IN PLACE From the 1 April 2019, The Packaging Forum introduced a new membership system. All members of the Packaging Forum now contribute to the PPRS to enable all companies to share in the funding of public place recycling and litter solutions. Company Liquorland Abe’s Bagels Lululemon A.E. Tilley Maritime Museum Amcor Flexibles Mars Confectionery Arthur Holmes Meadow Mushrooms Babich Wines Metal Art Beam Suntory Method Recycling Bio Pak Mexicano Blackmores Moi Agencies Bluebird Food Mondelez International BNZ Mouldings Unlimited Brewers Association NZ Mrs Rogers Bunzl Naturally Organic Cas-Pak Negociants Coca Cola Amatil NZ Neill Cropper Coffee Supreme Nestle NZ Columbus Coffee NZ Hothouse Coopers Creek NZ Safety Blackwoods Cottonsoft OI NZ Coveris - TC Transcontinental OOB CUB - Harvest Bulmer Orora Beverages DB Breweries Pernod Ricard Delegat NZ Pioneer Equipment Detpak Pluspac Packaging Domino’s Pizza Primepac Ecoclean Profile Foods/Mother Earth Ecoware Restaurant Brands EnviroNZ - KFC Epic Dairy - Pizza Hut Fairfax Media - Carl’s Jnr Farrahs - Taco Bell Fel Group Rubbish Direct Flight Plastics Sacred Hill Wines Foodstuffs Saverglass NZ Frucor Suntory Sileni Estate (Booster Wines) Fulton Hogan Simplot George Weston Skyline Queenstown Giesen Wines Smart Environmental Greystone/Muddy Waters Snell Packaging & Safety Griffins Something to Crow About Hansells - Walter & Wild Spy Valley Wines Heinz Watties Tetrapak Hell Pizza The Warehouse Group - 1 Day Henry’s Liquor South Island The Warehouse Hospitality NZ Totalpak Hubbards - Walter & Wild Tui Products Hunters Wines Villa Maria Estate Innocent Packaging Visy Recycling Innopack Wainhouse Distributors Integria Health Waste Management Jacobs Douwe Ebgerts/Bell Tea Westpac Jadcup Whitehaven Wines James Crisp - Sunrice Yealands Estate Karma Cola Z Energy Kathmandu Kimberly Clark Kono Beverages L’affare Lawson Dry Wines Lion 15
3.5
COST OF RECYCLING
On average across the variety of locations, our current
information is that it costs around 25.75 cents to
collect 1 kilogram of recyclables compared to 14.37
cents per kilogram in 2018. This change may reflect a
different portfolio of organisations providing the data.

On average around 88kg (up from 82kg in 2018) of
recyclables are collected per public place recycling
bin per month across the councils reporting to the
Scheme.

In comparison, data collected through the LLRM
project of Smart Colour Coded Bins for January-
December 2019 in 10 pilot regions finds that an
average of 155kg of recyclables per bin unit per
month and 117kg of waste in the single rubbish bin
units which “bookend” the recycling bins.

As part of the Litter Less Recycle More project, we
have been seeking to evaluate the impact of smart
technology on servicing costs. However due to the
ongoing development of the EYEFI technology it
has not been possible to assess the performance of
the bins on servicing costs. Pilot regions will provide
the data during 2020 now that the EYEFI units are
operational with the upgraded technology and
routing system.

16
4.0
SUMMARY OF PROJECTS
Note: projects covered in financial year to end March 2020 rather than calendar year

                                                            Allocation
Grants :                                                    $ excluding
Capital Expenditure                                         GST           Category
Clean Events - Bins                                         8,000         Capex

The Trust Arena                                             7,000         Capex

Waitemata DHB                                               4,450         Capex

LLRM binfrastructure                                        25,000        Capex

Total                                                       $44,450

                                                            Allocation
Grants :                                                    $ excluding
Events                                                      GST
Waiheke Resource Trust                                      720

AIMS Games                                                  1,000

Be A Tidy Kiwi pledge booths at Diwali Festival             5,000

Waiheke Gulf News (Trolley Derby)                           444

Total                                                       $7,164

In Kind Expenditure as at 31 March 2020

In kind contributions                                       $             Category
Servicing costs                                             818,000       Opex

Purchase of bins                                            103,000       Capex

Promotion by brand owners at events and for                 39,000        Promotional
the Let’s Put Litter in its Place campaign
Total                                                       $960,000

5.0
FACTORS AFFECTING SCHEME
There are no factors noted which affect scheme’s environmental or financial performance.
There are no variations to the scheme.
There are no compliance issues to be reported.

17
6.0
PROMOTION OF SCHEME
Stakeholder Activity Frequency Measurement 2019 Performance
Brand Owners, Packaging Information about Scheme Ongoing Attendance Update to members circulated with
Manufacturers and Membership and Scheme invoices
Retailers Performance – existing Membership Members meeting AGM July 2019
members and target members brochure
Facebook/website
Quarterly newsletter
FMCG magazine promotions
LinkedIn - 103 followers
Use of Love NZ Brand subject Annual Review meeting Requests from members have been
to use conditions established managed on an as required basis
by brand manager
Request feedback on scheme Annual Independent Packaging Forum survey on preferred
stakeholder communications
survey
Retail outlets, hospitality Information about Scheme Bi-monthly Supply of data/ Recycling data captured from
sector, tourist locations, Membership and Scheme engagement 28 organisations
stadia and event Performance – existing
Servicing costs captured from
organisers members and target members
9 organisations
FMCG Magazine features
Request feedback on scheme Annual Independent Packaging Forum survey on preferred
stakeholder communications
survey
Councils Request recycling data and Bi-monthly Data supplied 18 councils engaged in LLRM
costs. Provide update on conference Newsletter circulated to 77 local and
overall performance call regional councils
Trade stand at WasteMINZ 2019
Local Government magazine features
November
Request Feedback on scheme Annual Independent n/a
stakeholder
survey
Allocation of grants Quarterly Funding amount
Recyclers Request recycling data and Bi-monthly Membership of Packaging Forum
costs. Provide update on Recycling data received from recyclers
overall performance
Representation on Packaging Forum
Board and Schemes
General Stakeholders Survey Annual Horizon Research Horizon Research 2020
April 2020
Consumers What, how and where to Ongoing Website introduced new website
recycle in public place packagingforum.org,nz
Facebook - 386 followers
Consumer attitudes to Annual 64% say they Continued monitoring of awareness
recycling and recognition of have public place about recycling and litter
brand bins in their area
Consumer education & Per schedule Allocations $ allocated to events in the financial year
promotion
Media communications Ongoing Media 650,000 people reached with messages
monitoring. about the scheme in period to end June
Number reached. 2019
Government Progress report Annual Report Participation in MFE led Litter Working
Group
196.1
MARKET RESEARCH
Horizon Research surveyed 1,076 respondents There is little difference in awareness by personal
nationwide between 30th March and 2 April 2020. income and household type, but awareness falls
below the overall average of 64% to 52% among those
Respondents are members of the HorizonPoll online
aged 45 to 54 years. It is highest among those aged
panel and a third party research panel which are
18-24 (79%) and 75+ (75%).
representative of the New Zealand population aged
18+ at the 2018 census. New colour-coded bins
The survey is weighted by age, gender, educational
83% people say standardized
qualification, personal income, region and
employment status to provide a representative colours and signage make it
sample of the New Zealand adult population at the easier to choose the right bin
most recent census. At a 95% confidence level, the
maximum margin of error is +/- 3%. 54% of respondents, equivalent to around 1.94 million
adults, have seen the new colour-coded recycling
Results were compared with data from similar surveys and rubbish bins — up significantly from 37% in 2019.
conducted in March 2019, March 2018, April 2017, May 83% said that the colours and signage make the bins
2016, June 2015, April 2014, April 2013, July 2012 and easier to use. Recognition in places where the bins
November 2011. have been installed for over 12 months is as follows:
Marlborough District (80%); New Plymouth (61%) Clutha
Public place recycling bins and the District (100%); Tauranga (66%); Wellington (77%)
Love NZ brand Queenstown Lakes (100%). Note the Clutha District and
Queenstown Lakes result is from a small respondent
2 out of 3 New Zealanders sample and is highly indicative only.
say they have public place
The number who had seen the colour coded bins
recycling bins in their area varied significantly by age.
64% of respondents said they had public place Compared with the overall result of 54%, 79% of
recycling bins in their area – up from 59% in 2019. This 18-24-year-olds had seen the bins and 65% of those
result indicates that about 2.3 million adults have aged 25-34 years.
public place recycling in their area. 23% say they
have Love NZ branded recycling bins in their area (up The number who had not seen the bins peaked at 43%
slightly on 22% in 2019 and an increase from 10% in among those aged 55+ (53%).
2015).
Seen bins – by household type
There were significant variations in the number of
those who have seen colour coded bins according to
their household type.
Single parent households with one or two children
at home were most likely to say they had not seen a
colour coded bin (48%). 50% had seen a bin.
Among the predominant household type, two parent
families with one or two children at home, 67% had
seen the bins, 32% had not.
20Perspective on litter Brand awareness
People say there is less litter about 38% of respondents said they were aware of the Love
NZ brand before the survey (compared to 27% in 2019;
29% of respondents (equivalent to around 1,042,000 40% in 2018, 35% in 2017; 29% in 2016). This indicates that
adults) said there was a problem with litter where they around 1.36 million adults are currently aware of the
live — which shows a significant reduction from 44% in Love NZ brand. The variation between awareness in
2019 and previous results in 2017 and 2018. 2018 and 2020 is not statistically significant.
The number who will make an extra effort to walk to There was a marked difference in awareness of the
bins has remained constant. brand by age.
21% of people said they would not walk more than 10 The older people are the less likely they are to have
metres to find a rubbish or recycling bin (21% in 2019 heard of it. This includes 73% of those aged 75+, 71% of
and 30% in 2017). 65-74-year-olds and 64% of 55-64-year-olds.
37% of people said they would walk more than 40 The highest number to have heard of Love NZ before
metres, equivalent to around 1.33 million adults -29% the survey was 55%, of 25-34-year-olds.
in 2019 and significantly up from 23% in 2018 (826,969
adults). The “Be a Tidy Kiwi” brand was recognised by 83% or
around 2.98 million adults – (92% in 2019; 87% in 2018;
Willingness to walk each distance measured does not 84% in 2017.
appear to be influenced by age or gender.
Awareness increases with age but is still high at 84%
37% said they would tell someone to pick it up if they among 25-34-year-olds. It is 92% among those aged
saw someone drop litter in the street (38% in 2019) 55-64.
while 36% said they would pick litter up themselves
(36% in 2019).
Women were more likely to ask someone dropping
litter to pick it up: 41%, compared with men 33%.
Women were also more likely to pick up the litter
themselves (39%) than men (31%).
Educational qualification levels also appear to have
an influence on directly asking others to pick up litter
or pick it up themselves. Those with degrees or post
graduate degrees were more likely than average to
pick it up themselves.
216.2 Summary of coverage 2017-2019
MEDIA EVALUATION Volume of PPRS messages by items
The annual IMPACT report outlines the media profile
for the Public Place Recycling Scheme (PPRS); Be a Tidy
Kiwi and Litter Less Recycle More for the 12 months
from July 2018 - June 2019.
190 items were submitted for evaluation compared to
191 the previous year.
71 items name-checked the Packaging Forum
compared to 47 in 2017/18.
32 items mentioned the Love NZ brand compared to 21
in 2017/18.
29 referred to the Public Place Recycling Scheme or
July 2018-June 2019
a ‘Be a tidy Kiwi’ campaign, compared to 5 specific
mentions of the PPRS in 2017/18.
The Packaging Forum appeared in items that also
mentioned Love NZ in 20 items compared to 5 in
2017/18. PPRS and the Packaging Forum appeared in
the same item 18 times compared to 4 in 2017/18.
The total coverage reach for The Packaging Forum,
Soft Packaging Recycling, Love NZ and PPRS/’Be a
Tidy Kiwi’ campaign was in excess of 5.27m. This is
based on circulation where known — actual potential
readership/audiences could be higher.
The total coverage reach for the PPRS/’Be a Tidy Kiwi’
campaign was 650,000. This is based on circulation
where known — actual potential readership/
audiences could be higher.
22Public Place Recycling scheme messages Targets The PPRS aims to improve access for the consumer to do the right thing by increasing the national public place recycling bin network in shopping malls, transport hubs, tourist locations, sports stadia and other public locations. The PPRS aims to increase waste diversion at major events and venues. Commercial Sector (Brand & Retailers) The campaign is backed by leading brands and corporations who are members of the PPRS and pay levies. The PPRS allows brands to manage their reputation with regard to ensuring their packaging is disposed of properly by consumers away from home. Community Awareness The PPRS builds community awareness and pride encouraging a sense of shared ownership of Love NZ branded public place recycling facilities nationwide through partnerships between councils, industry and communities. Litter Reduction The PPRS measures and sets targets for litter reduction 23
The covers for the wheelie bins
funded by the PPRS
Public Place Recycling Scheme

Managed by
The Packaging Forum Inc.
PO Box 58110
Botany, Manukau 2163
Auckland
phone 09 271 0073
donna@packagingforum.org.nz
You can also read