Hyperspectral-reflectance dataset of dry, wet and submerged marine litter - ESSD
←
→
Page content transcription
If your browser does not render page correctly, please read the page content below
Earth Syst. Sci. Data, 13, 713–730, 2021
https://doi.org/10.5194/essd-13-713-2021
© Author(s) 2021. This work is distributed under
the Creative Commons Attribution 4.0 License.

                          Hyperspectral-reflectance dataset of dry,
                             wet and submerged marine litter
               Els Knaeps1 , Sindy Sterckx1 , Gert Strackx1 , Johan Mijnendonckx1 , Mehrdad Moshtaghi1 ,
                                    Shungudzemwoyo P. Garaba2 , and Dieter Meire3
                  1 FlemishInstitute for Technological Research (VITO), Boeretang, 200, 2400 Mol, Belgium
               2 MarineSensor Systems Group, Institute for Chemistry and Biology of the Marine Environment,
               Carl von Ossietzky University of Oldenburg, Schleusenstraße 1, Wilhelmshaven 26382, Germany
                          3 Flanders Hydraulics Research, Berchemlei 115, 2140 Antwerp, Belgium

                                      Correspondence: Els Knaeps (els.knaeps@vito.be)

                                    Received: 1 October 2020 – Discussion started: 21 October 2020
                           Revised: 21 January 2021 – Accepted: 26 January 2021 – Published: 2 March 2021

       Abstract. This paper describes a dataset consisting of 47 hyperspectral-reflectance measurements of plastic
       litter samples. The plastic litter samples include virgin and real samples from the Port of Antwerp. They were
       measured in dry conditions in the Flemish Institute for Technological Research (VITO) calibration facility, and
       a selection of the samples were also measured in wet conditions and submerged in a water tank at Flanders
       Hydraulics. The construction on top of the tank allowed us to submerge the plastics and keep sediments in
       suspension. The spectral measurements were performed using an Analytical Spectral Devices (ASD) Field-
       Spec 4 and a Spectral Evolution (SEV) spectrometer. The datasets are available on the 4TU.ResearchData
       open-access repository (ASD dataset: https://doi.org/10.4121/12896312.v2, Knaeps et al., 2020; SEV dataset:
       https://doi.org/10.4121/uuid:9ee3be54-9132-415a-aaf2-c7fbf32d2199; Garaba et al., 2020).

1   Introduction                                                    cussed (Garaba and Dierssen, 2020). The HYPER dataset
                                                                    is an extension to the existing datasets because it includes
                                                                    spectral measurements of additional plastic specimens and
Spectral-reflectance measurements of plastic specimens have         involves simulated scenarios of submerged samples with var-
been collected in the framework of the Hyperspectral Re-            ied water clarity. The dataset has the potential to help to de-
mote Sensing Of Marine Plastics (HYPER) project. The data           velop appropriate algorithms for marine-plastic detection and
were used to provide guidance on the selection of appro-            identification and to select appropriate sensors relevant for
priate wavelengths for marine-plastic identification. Spec-         marine plastics.
tral reflectance of dry plastic polymers is known, and this            In total, 47 plastic specimens were measured with the
knowledge is used in the industry for sorting plastics from         Analytical Spectral Devices (ASD) FieldSpec 4 spec-
other litter and to discriminate between different polymers         trometer. Six of them were also submerged in a con-
(Huth-Fehre et al., 1995; Masoumi et al., 2012). Knowledge          trolled way in a water tank. The plastic specimens con-
of spectral reflectance of marine litter, which is wet or sub-      sist of virgin plastics and real samples from the Port of
merged, is however limited. To this end, there has been a           Antwerp. The dataset has been made publicly available
rising interest in establishing spectral-reference libraries of     (Knaeps et al., 2020: https://doi.org/10.4121/12896312.v2).
plastic litter in different conditions, states, types, pixel cov-   For comparison, a few plastic specimens have also been
erage and observation geometries (Garaba et al., 2021).             measured with a Spectral Evolution (SEV) SR-3501 hy-
   More recently, an open-access dataset of the spectral re-        perspectral radiometer with its own preprocessing ap-
flectance of marine-harvested and virgin plastics which were        plied. The SEV dataset is also publicly available (Garaba
measured in dry and wet conditions was reported and dis-

Published by Copernicus Publications.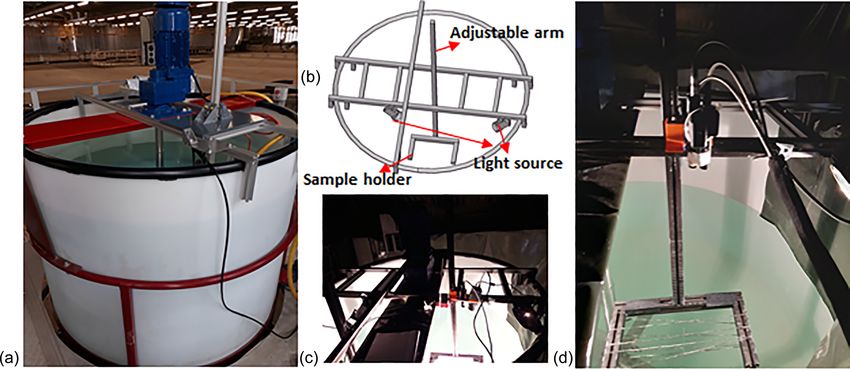
714 E. Knaeps et al.: Hyperspectral-reflectance dataset of dry, wet and submerged marine litter
et al., 2020: https://doi.org/10.4121/uuid:9ee3be54-9132- approximately 3 nm at around 700 nm. The spectral resolu-
415a-aaf2-c7fbf32d2199). tion in the SWIR varies between 10 and 12 nm. The SEV
spectroradiometer has a spectral resolution between 4 and
10 nm. For both instruments, we derived a relative hemi-
2 Laboratory and tank set-up
spherical directional reflectance (R) of the sample, which
was normalized to a 99 % Labsphere Spectralon® Lamber-
Measurements of the spectral reflectance were performed at
tian panel. In the tank, the Spectralon panel was placed at
two locations. The first was an optical calibration labora-
the same position where the plastic specimen was placed, i.e.
tory at Flemish Institute for Technological Research (VITO),
on the holder of the adjustable arm. For brevity, additional
Belgium. The spectral observations of dry plastics were
specifications are summarized below (Table 1).
conducted in the dark laboratory room equipped with two
Processing of the ASD data included calculation of the
halogen tungsten lamps. Further experiments were done
mean and standard deviation (SD) from the replicate mea-
using a water tank at the Flanders Hydraulics facility in
surements. No additional smoothing was applied to the
Antwerp, Belgium (Fig. 1). The water tank (diameter = 2 m,
data. The SEV measurements were smoothed using a third-
depth = 3 m) was customized to simulate and assess the op-
order polynomial Savitzky–Golay least-square algorithm at
tical properties of submerged plastics at fixed water depths
a frame length of 31. No splice correction was applied to the
and changing water clarity. The tank was equipped with a
data to compensate for typical steps in spectra due to the tran-
propeller that allowed the mixing of the water to create near-
sition between the three detectors. We computed the unbiased
homogenous distribution of sediments. A set of two halogen
percentage difference (UPD) as a measure of uncertainty be-
tungsten lamps (12 V 50 W GY9.5, Original Gilway L9389)
tween the two spectroradiometers:
were used to provide artificial lighting simulating sunlight.
A tailor-made aluminium frame was attached to the wa- !
|RλASD − RλSEV |
ter tank for the attachment of the spectroradiometer detec- UPD(%) = 200 · , (1)
tor, lights and samples (Fig. 1b). The frame was also painted RλASD + RλSEV
black so that it would not contribute to the bulk spectral sig-
nal expected from only the plastic targets. An adjustable arm where R is the reflectance at wavelength (λ) the ASD and
was integrated on the frame with a holder for the targets SEV, respectively.
and predetermined depth markings (Fig. 1c). A black cloth
was used to create a dark surrounding over the water tank to 3.2 TSM measurements
mitigate unwanted stray light from the laboratory surfaces.
Furthermore, the side walls of the tank were covered with Water clarity was changed by adding fine clay collected from
a black plastic to mitigate background reflections; no back- Deurganckdok, a tidal dock in the Port of Antwerp, con-
ground correction was applied to the measurements as it was nected to the Scheldt River (B). The clay had a median par-
determined to be negligible. The foreoptic end of the ASD ticle size D50 of 11.0 ± 0.3 µm and ranged between a D10
and SEV radiometers was attached to the aluminium frame of 2 µm and a D90 of 51 µm. Initial water clarity was high,
on top of the tank to make sure they viewed the same target meaning no suspended material; a small amount of clay was
at the same distance (Fig. 1d). then added to achieve medium and finally low visibility with
a high concentration of TSM. The sediment concentration
was measured by taking water samples of 1 L at the water
3 Data collection surface and filtering the samples.
Data collection consisted of spectral-reflectance measure-
3.3 Plastic specimens
ments of different plastic specimens, both virgin plastics and
plastic waste from the Port of Antwerp. Spectral measure- Several criteria were used to select the plastic items. First of
ments were performed by two different teams using different all, the plastics should be representative of the plastics that
instruments (ASD FieldSpec 4 and SEV SR-3501 hyperspec- are commonly found in rivers and coastal areas. Secondly,
tral radiometers). In the tank, sediments were added, and the plastics with different colours should be included to under-
total suspended matter (TSM) concentration was analysed af- stand the effect on the spectral reflectance. Finally, several
ter each set of measurements. plastics should be selected which are uniform and can be sub-
merged in a controlled way in the tank.
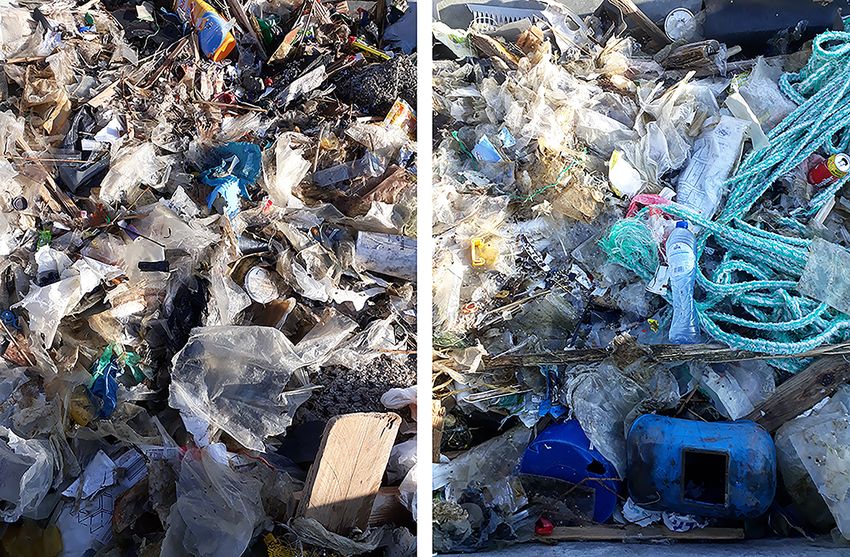
3.1 Spectral measurements The above criteria resulted in a set of real and weathered
and virgin plastics. Weathered marine litter was gathered
Spectral reflectance of the plastic targets was measured with from the Port of Antwerp consisting of plastic bottles, plas-
an ASD FieldSpec 4 and a SEV SR-3501 hyperspectral spec- tic bags, rope, drinking containers and wood (Fig. 2). Virgin
troradiometer from the ultraviolet (UV) to shortwave infrared plastics (off the shelf) consisted of ropes, bags, place mats,
(SWIR). The ASD spectrometer has a spectral resolution of bottles, cups and foam. We gathered blue, yellow, pink and
Earth Syst. Sci. Data, 13, 713–730, 2021 https://doi.org/10.5194/essd-13-713-2021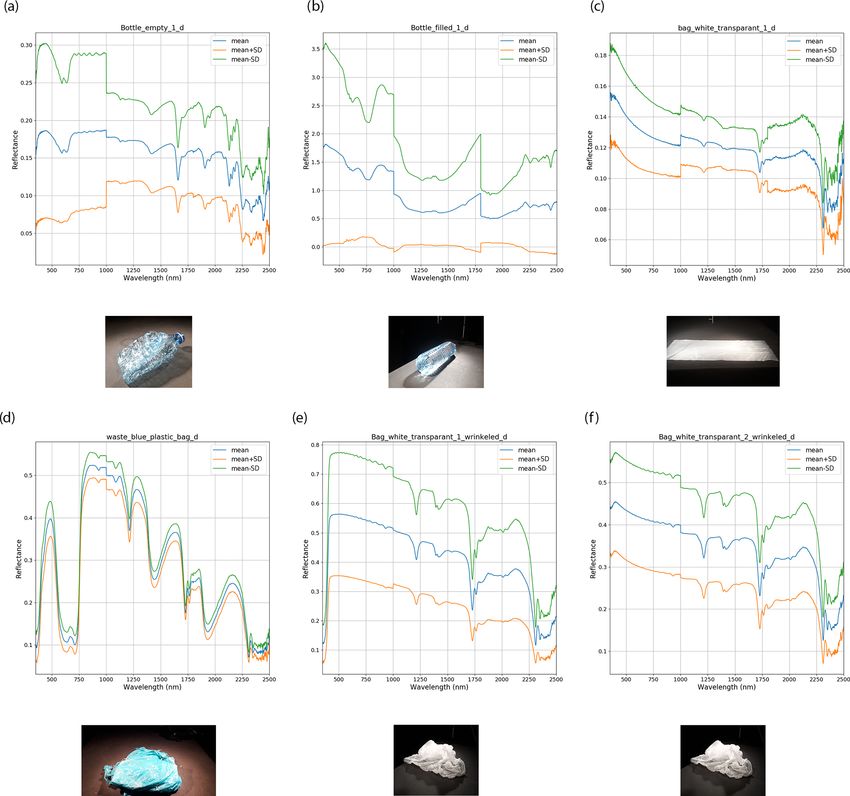
E. Knaeps et al.: Hyperspectral-reflectance dataset of dry, wet and submerged marine litter                                          715

Figure 1. (a) Original set-up of the tank; (b) schematic of the aluminium frame; (c) experimental set-up of the tank inside, covered with
black cloth; and (d) foreoptic ends of the ASD and SEV spectroradiometers.

Table 1. Hyperspectral-radiometer specifications and settings during the study. VNIR: visible–near infrared; SWIR: shortwave infrared.

                                                          ASD                    SEV
                               Spectral range (nm)        350–2500               280–2500
                               Spectral resolution (nm)   VNIR: ca. 3 nm         4 nm (280–1000 nm)
                                                          SWIR: 10–12 nm         ≤ 10 nm (1000–1900 nm)
                                                                                 ≤ 7 nm (2100–2500 nm)
                               Scans per measurement      30                     30
                               Replicate measurements     5                      5
                               Foreoptic field of view    8◦                     8◦

orange place mats as well as orange, blue and white ropes.             making a uniform flat target. First tests were performed with
The ropes were prepared for the reflectance measurements in            clear water before adding the clay sediments. The plastics
three ways: compact on a roll as bought in the store, unrolled         were measured first in dry conditions in the tank just above
and nicely aligned along a frame (Table 2).                            the water surface followed by submerging to fixed depths
   The         following          naming           convention          of 2.5 (as just below water surface), 5, 9, 12, 16 and (the
(name_state_depth_TSM) was utilized to identify the                    deepest) 32 cm. Finally, the plastics were measured again
type or name of plastic specimen; state of sample as d (dry),          just above the water surface as wetted plastics. These steps
w (wet) or s (submerged); the depth below water surface                were repeated after adding sediments for the two scenarios
[cm]; and TSM concentration [mg L−1 ]. For example,                    of moderate and high TSM concentrations.
OrangePlacemat_s_4_200 refers to measurements of an
orange place mat submerged at 4 cm depth and a TSM of
                                                                       4     Results and discussion
200 mg L−1 . There are four different polymer types within
the dataset: polyethylene terephthalate (PET), Low-density             4.1     TSM results
polyethylene (LD-PE), Polyester(PEST) and polypropylene
(PP). A total of 47 materials were investigated, and the               Laboratory analyses of the water samples taken from the tank
descriptors as well as metadata are summarized below                   after dilution 1 showed a TSM concentration of 75 mg L−1
(Table 2).                                                             and a TSM concentration of 321 mg L−1 after dilution 2 (Ta-
                                                                       ble 2).

3.4   Tank scenarios
                                                                       4.2     Reflectance results
The tank experiment involved carefully submerging a selec-             4.2.1    Tank water
tion of plastic samples to fixed depths. The selected samples
include the new place mats (orange, blue, pink, yellow) and            The water in the tank was measured with the ASD spectrom-
PP ropes (orange, blue, white) bound to a plexiglass frame,            eter without any plastics in the water. “Clear” tank water was

https://doi.org/10.5194/essd-13-713-2021                                                  Earth Syst. Sci. Data, 13, 713–730, 2021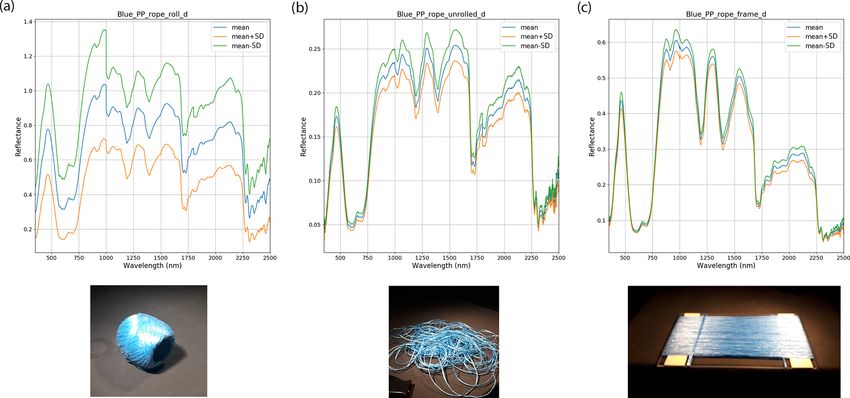
716                                E. Knaeps et al.: Hyperspectral-reflectance dataset of dry, wet and submerged marine litter

Table 2. Overview of measurements.

        Type         Plastic specimen                                          Polymer type     Available measurements
                                                                                                (d: dry; w: wet;
                                                                                                s: submerged)
        Bottles

        Virgin       Bottle filled with water 1                                PET              d

        Virgin       Bottle filled with water 2                                PET              d

        Virgin       Bottle empty and crushed 1                                PET              d

        Virgin       Bottle empty and crushed 2                                PET              d

        Virgin       Bottle empty and crushed 3                                PET              d

        Virgin       Bottle empty and crushed 4                                PET              d

        Virgin       Bottles on frame                                          PET              w
        PET Cups

        Virgin       White LD-PE cup flat                                      LD-PE            d

        Virgin       White LD-PE cup straight                                  LD-PE            d
        Place mats

        Virgin       Orange place mat                                          Not specified    d, w, s

        Virgin       Blue place mat                                            Not specified    d, w, s

        Virgin       Pink place mat                                            Not specified    d, w, s

        Virgin       Yellow place mat                                          Not specified    d, w, s

Earth Syst. Sci. Data, 13, 713–730, 2021                                             https://doi.org/10.5194/essd-13-713-2021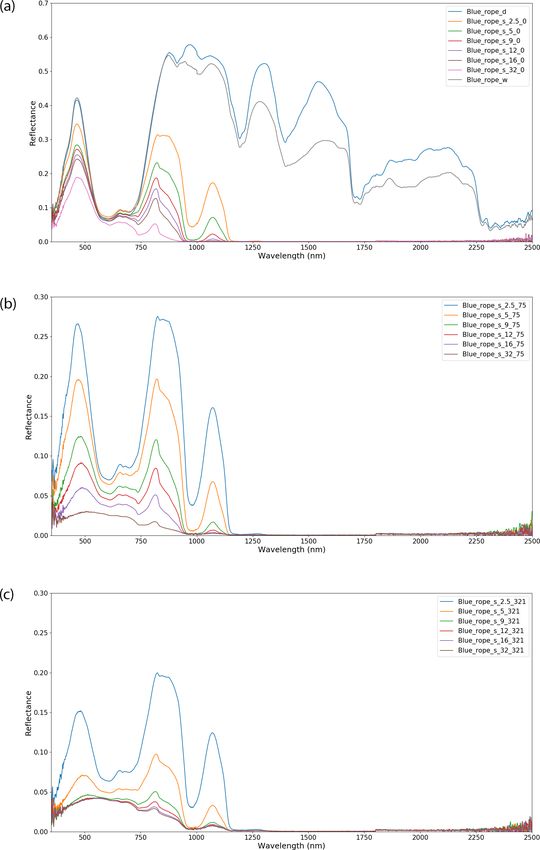
E. Knaeps et al.: Hyperspectral-reflectance dataset of dry, wet and submerged marine litter                        717

Table 2. Continued.

        Type          Plastic specimen                                    Polymer type    Available measurements
                                                                                          (d: dry; w: wet;
                                                                                          s: submerged)
        Ropes

        Virgin        Orange PP rope on a roll                            PP              d

        Virgin        Orange PP rope unrolled                             PP              d

        Virgin        Orange PP rope aligned around frame                 PP              d, w, s

        Virgin        Blue PP rope on a roll                              PP              d

        Virgin        Blue PP rope unrolled                               PP              d

        Virgin        Blue PP rope aligned around frame                   PP              d, w, s

        Virgin        White PP rope on a roll                             PP              d

        Virgin        White PP rope unrolled                              PP              d

        Virgin        White PP rope aligned around frame                  PP              d, w, s

        Virgin        White polyester rope on a roll                      Polyester       d

        Virgin        White polyester rope unrolled                       Polyester       d
        other

        Virgin        Garden net                                          Not specified   d

        Virgin        Green foam                                          Not specified   d

https://doi.org/10.5194/essd-13-713-2021                                       Earth Syst. Sci. Data, 13, 713–730, 2021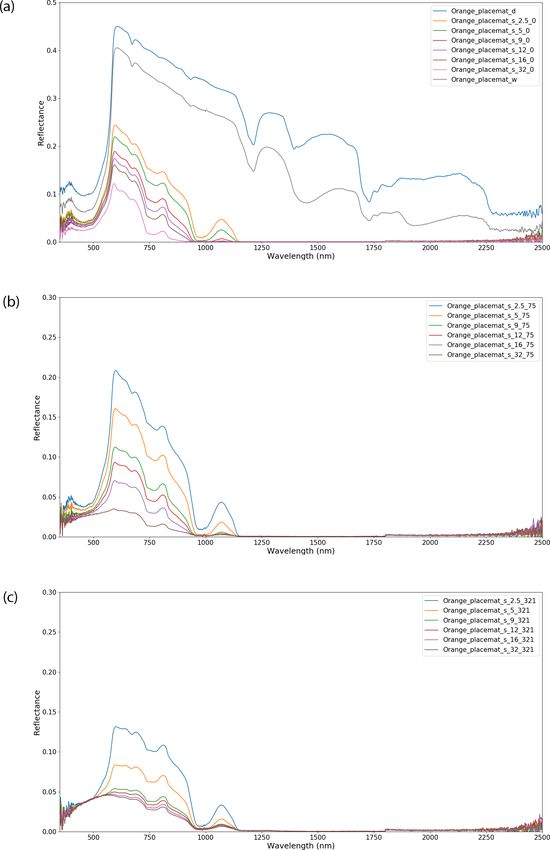
718                                 E. Knaeps et al.: Hyperspectral-reflectance dataset of dry, wet and submerged marine litter

Table 2. Continued.

        Type          Plastic specimen                                          Polymer type     Available measurements
                                                                                                 (d: dry; w: wet;
                                                                                                 s: submerged)
        Bags

        Virgin        White transparent plastic bag 1                           Not specified    d

        Virgin        White transparent plastic bag 1, wrinkled                 Not specified    d

        Virgin        White transparent plastic bag 2                           Not specified    d

        Virgin        White transparent plastic bag 2, wrinkled                 Not specified    d

        Virgin        Black plastic bag                                         Not specified    d

        Virgin        Black plastic bag on frame                                Not specified    w

        Virgin        White transparent plastic bag 1 on frame                  Not specified    w
        Port of Antwerp

        Real          Grey cloth                                                Not specified    d

        Real          Waste rope                                                Not specified    d

        Real          Waste blue plastic bag                                    Not specified    d

        Real          Waste green rope                                          Not specified    d

        Real          Orange tube                                               Not specified    d

        Real          Transparent wrapping foil                                 Not specified    d

Earth Syst. Sci. Data, 13, 713–730, 2021                                             https://doi.org/10.5194/essd-13-713-2021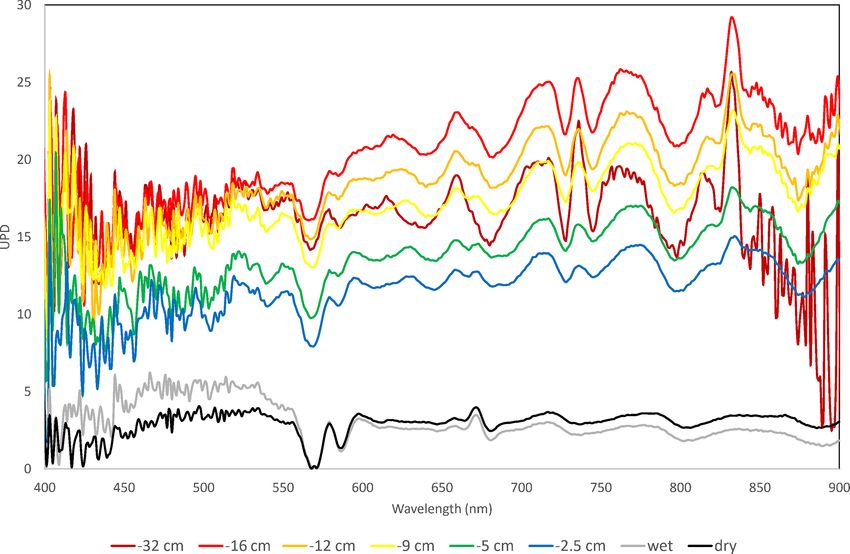
E. Knaeps et al.: Hyperspectral-reflectance dataset of dry, wet and submerged marine litter                                719

Figure 2. Litter specimens found in the Port of Antwerp, Belgium.

Figure 3. Spectral reflectance of tank water with various TSM.

measured on two dates: 18 October 2019 and 12 Decem-                (NIR) and SWIR, the water from 12 December has a clear
ber 2019. Both water spectra are shown in Fig. 4 by a black         reflectance signal, which is not expected because of strong
and dashed black line. In the visible region, the tank water        pure water absorption. The reason for the difference in re-
measured on 18 October has a higher reflectance than the            flectance between both dates can be some remaining sed-
tank water measured on 12 December. In the near-infrared            iments in the water and some dust floating on the surface

https://doi.org/10.5194/essd-13-713-2021                                            Earth Syst. Sci. Data, 13, 713–730, 2021
720                                 E. Knaeps et al.: Hyperspectral-reflectance dataset of dry, wet and submerged marine litter

Table 2. Continued.

        Type           Plastic specimen                                                Polymer type      Available measurements
                                                                                                         (d: dry; w: wet;
                                                                                                         s: submerged)

        Real           Pellets                                                         Not specified     d

        Real           Thin isolating wrapping foil                                    Not specified     d

        Real           Extended polystyrene (EPS)                                      Not specified     d

        Real           Energy drink container                                          Not specified     d

        Real           Wood 1                                                          n/a               d

        Real           Wood 2                                                          n/a               d

        Real           Wood 3                                                          n/a               d

        Real           Wood 4                                                          n/a               d

      n/a: not applicable

Table 3. TSM concentrations.

                            12 December 2019      Time       Sample 1      Sample 2      Sample 3      Mean ± SD
                                                  [UTC]      [mg L−1 ]     [mg L−1 ]     [mg L−1 ]     [mg L−1 ]
                            Dilution 1            12:53:00          79            74             72      75 ± 3.6
                            Dilution 2            14:02:00         315           325            324     321 ± 5.5

on 12 December, meaning that the water was not completely                bid tank water with TSM concentrations corresponding to 75
clear. On 18 October the water was clearer, and the white bot-           and 321 mg L−1 is also shown in (Fig. 3). Increase in TSM
tom of the tank was visible, which can contribute to the re-             concentration results in an overall increase in the spectral re-
flectance signal. On 12 December the white bottom was less               flectance. The NIR is no longer zero, and a local maximum
visible, and the dust on the surface might cause the non-zero            reflectance is observed around 1070 nm in the SWIR.
reflectance in the NIR and SWIR. It is possible to account
for this remaining reflectance in the NIR and SWIR by sub-
                                                                         4.2.2   Place mats
tracting the reflectance at 1200 nm as is also done to account
for residual sky glint reflection in outdoor water reflectance           The reflectance in dry conditions from the VIS to the SWIR
measurements (Knaeps et al., 2015). The result is shown in               can be seen in (Fig. 4). In the visible–near-infrared (VNIR)
Fig. 4 by the dotted black line. The reflectance of the tur-             spectral range, all place mats look very different, and the in-

Earth Syst. Sci. Data, 13, 713–730, 2021                                                     https://doi.org/10.5194/essd-13-713-2021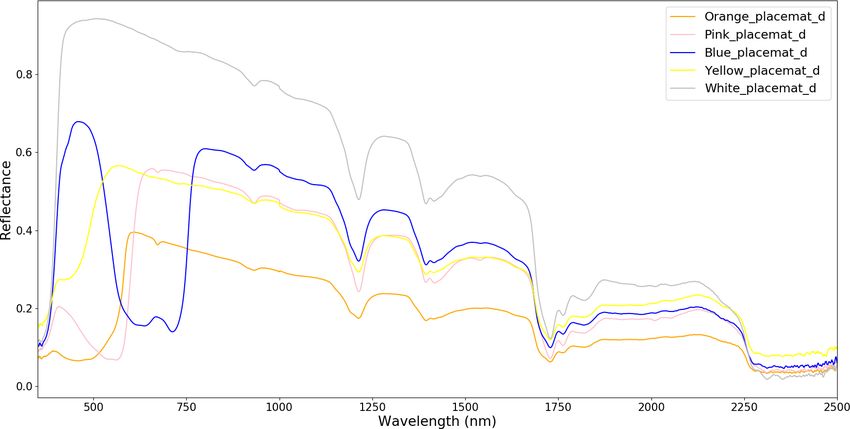
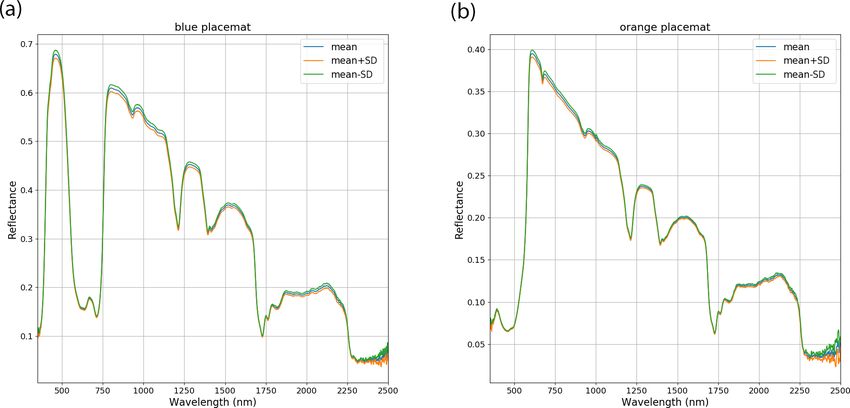
E. Knaeps et al.: Hyperspectral-reflectance dataset of dry, wet and submerged marine litter                                 721

Figure 4. Spectral reflectance of dry plastic place mats.

Figure 5. Mean and SD for the dry blue and orange place mat.

herent spectral-reflectance shape in the visible spectrum was     position of the plastic target. Hence, very homogeneous tar-
consistent with the apparent colour of the samples. Overall,      gets will have a smaller SD. The mean and SD for the blue
the white place mat had the highest reflectance, and in the       and orange place mats were very small: 0.00056 and 0.00283
SWIR, the spectral shapes of the specimens were identical.        for the blue place mat at 400 and 900 nm, respectively, and
Furthermore, the absorption features in the SWIR spectrum         0.00484 and 0.00690 for the orange place mat at 400 and
were located at the same wavebands, suggesting these place        900 nm, respectively (Fig. 5). The small SD was also used
mats shared similar polymeric composition. The strongest          as a prerequisite for submersion in the tank because mea-
absorption features were observed around 1216, 1397 and           surements at the different depths should not be influenced by
1730 nm. Absolute reflectance differs considerably, in par-       differences in the spectral reflectance of the plastic specimen
ticular between 1000 and 1700 nm.                                 itself (due to e.g. inhomogeneities of the surface).
   The mean and SD, as shown in Fig. 5, were calculated              The spectral measurements of the orange place mat when
based on five replicate measurements. The dry measurements        submerged in the water tank, in clear conditions and with
were collected in the VITO calibration facility, and the repli-   different dilutions of sediment, are shown in Fig. 6. In ad-
cate measurements were obtained by slightly changing the          dition, the first figure includes a dry measurement in blue

https://doi.org/10.5194/essd-13-713-2021                                            Earth Syst. Sci. Data, 13, 713–730, 2021
722                              E. Knaeps et al.: Hyperspectral-reflectance dataset of dry, wet and submerged marine litter

Figure 6. Spectral reflectance of the orange place mat submerged in (a) clear water, (b) water with a TSM concentration of 75 mg L−1 and
(c) water with a TSM concentration of 321 mg L−1 .

Earth Syst. Sci. Data, 13, 713–730, 2021                                                https://doi.org/10.5194/essd-13-713-2021
E. Knaeps et al.: Hyperspectral-reflectance dataset of dry, wet and submerged marine litter 723
Table 4. Wavelength corresponding to a reflectance threshold of 0.001 for the orange place mat.
Wavelength (nm) Depth (centimetres below the water surface)
1 2 2.5 3 4 5 8 9 12 13 16 18 32
Clear tank water 1415 1324 1287 1162 1134 1090 1058
Clear tank water 1153 1147 1124 1098 1079 1051
75 mg L-1 1151 1151 1140 1142 1138 1156
321 mg L−1 1358 1315 1322 1314 1303 1308
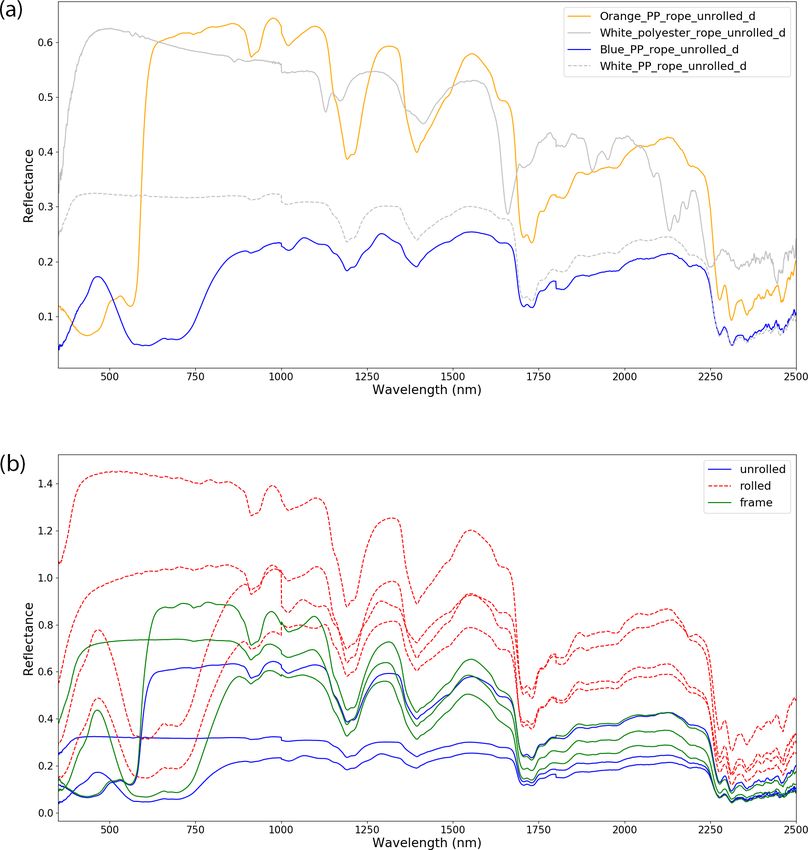
Figure 7. Spectral reflectance of dry ropes; (a) white, orange and blue rope; and (b) all ropes in different conditions: on a roll as bought in
the store, unrolled and aligned on a plexiglass frame.
https://doi.org/10.5194/essd-13-713-2021 Earth Syst. Sci. Data, 13, 713–730, 2021724 E. Knaeps et al.: Hyperspectral-reflectance dataset of dry, wet and submerged marine litter Figure 8. Mean and SD for the blue rope in three conditions: on a roll as bought in the store, unrolled and aligned on a plexiglass frame. and a wet measurement in grey. The figures show the de- With sediment in suspension, the reflectance of the orange crease in reflectance when the plastic is wet and submerged place mat will be slightly or fully masked by the reflectance and the changes to the shape of the spectrum, particularly in of the sediments. As shown in the table, there is measurable the NIR. Between 900 and 1000 nm, the absorption of water reflectance in the SWIR, even with the orange place mat at strongly increases, causing a rapid decrease in reflectance de- 32 cm depth. Comparing these values with the values of the tected from the submerged targets in both deep (32 cm) and clear tank water shows that the reflectance at these longest shallow (2.5 cm) water. Compared to the neighbouring wave- wavelengths is coming from the sediments in the water. bands between 1000 and 1140 nm, absorption by water is lower, resulting in reflectance peaks of the plastic targets over this spectrum range. Table 4 shows, for all the depths and for 4.2.3 Ropes different turbidity, the wavelength at which the reflectance The white polyester rope (unrolled) was the most reflective reaches a threshold of 0.001. Beyond this wavelength, re- item in this group, particularly in the visible. The blue and or- flectance will always be lower than 0.001, and the plastic tar- ange ropes had a lower reflectance in the visible, with spec- get cannot be detected. For instance, when the orange place tral shapes in agreement with the apparent colour (Fig. 7). mat is submerged in clear tank water at a depth of 8 cm, there Three of the ropes are polypropylene polymers, which can will be no measurable reflectance beyond 1134 nm. These also be observed from the spectral-absorption features in the values are specific for the orange place mat and will be dif- SWIR. The white polyester rope has different features in ferent for other plastic specimens. The reader can easily pro- the SWIR. Additional measurements were conducted on the duce similar values based on the published dataset. The re- off-the-shelf and rolled ropes, unrolled ropes and the rope flectance threshold was subjectively chosen, and the reader aligned on the plexiglass. It was noted that the rolled rope is also free to use a different one. For the clear tank water, had the highest reflectance (Fig. 7b). One of the rolled ropes measurements from 18 October 2019 and 12 December 2019 even had a reflectance above 1, probably due to the exact are included. Although TSM concentrations are not exactly position of the ASD fibres pointing towards a highly reflec- known, it has been shown (Fig. 4) that on 18 October 2019 tive glint area on the rope. The SD is smallest for the rope the water in the tank was clearer, and there was remaining aligned along the frame (Fig. 8). The rope aligned on a plex- dust and/or sediment in the tank on 12 December 2019. iglass frame was also used for submersion in the tank. In The values in Table 4 for the clearest tank water (18 Oc- some of the spectra, a small jump can be observed around tober 2019) show that SWIR wavelengths between 1000 and 1000 nm and a second smaller one around 1750 nm. This is 1415 nm provide information on the orange place mat when caused by the design of the ASD, consisting of three spec- slightly submerged (1 up till 18 cm). These results should trometers and a fibre-optic cable, which is actually a bundle however be confirmed in an outdoor setting under different of 57 individual, randomly oriented fibres (Analytical Spec- lightning conditions and in the presence of surface features. tral Devices, 1999). VNIR and SWIR fibres are organized Earth Syst. Sci. Data, 13, 713–730, 2021 https://doi.org/10.5194/essd-13-713-2021
E. Knaeps et al.: Hyperspectral-reflectance dataset of dry, wet and submerged marine litter                                           725

Figure 9. Spectral reflectance of the blue rope submerged in (a) clear water, (b) water with a TSM concentration of 75 mg L−1 and (c) water
with a TSM concentration of 321 mg L−1 .

https://doi.org/10.5194/essd-13-713-2021                                                   Earth Syst. Sci. Data, 13, 713–730, 2021
726                               E. Knaeps et al.: Hyperspectral-reflectance dataset of dry, wet and submerged marine litter

Figure 10. Spectral reflectance of bags and bottles.

differently, which leads to different areas of the surface be-     sults for the orange place mat. The plastic specimens were
ing observed with different parts of the spectrum, resulting       measured dry, wet and submerged at 2.5, 5, 9, 12, 16 and
in steps in spectra at the joints between each detector (Arthur    32 cm without adding any sediments in the tank. The unbi-
et al., 2012). This effect is observed when targets are non-       ased percentage difference (UPD) was calculated for the dry
uniform. It was decided not to apply any correction to the         specimens. For the dry measurements, the datasets agree very
spectra because the jumps can provide information on the           well with the UPD mostly below 10 %. At short (< 400 nm)
uniformity of the target. However, readers can apply a splice      and long (< 2240 nm) wavelengths, larger differences can be
correction themselves, which might be useful when readers          observed due to the lower sensitivity of the instruments and
apply further analysis to the data. The splice correction re-      noisy spectra. Small differences can also be explained by a
moves or compensates for the steps in the spectra. The VNIR        slightly different position of the two instruments. Although
and SWIR-2 data can be adjusted to match the SWIR-1 data.          mounted closely, the footprint of the two instruments on the
The difference at 1000 and 1001 nm can be used to correct          water surface will be slightly different.
the VNIR data, whilst the difference at 1800 and 1801 nm              Figure 14 shows the UPD for the dry, wet and submerged
can be used to correct the SWIR-2 data.                            orange place mat for wavelengths from 400 to 900 nm. The
                                                                   UPD is higher for the submerged plastic samples, and it
                                                                   generally increases with deeper submersion of the samples.
4.2.4    Bags, cups and bottles
                                                                   Where the UPD for the dry plastic is below 5 % for this spec-
The spectral reflectance of plastic cups, bottles and bags was     tral range, the UPD for the plastic submerged at 16 cm lies
less uniform than the solid plastic samples shown earlier          between 15 % and 30 %. This can be explained by the foot-
(ropes and place mats). Cups and bottles have different poly-      print of the spectrometer, which will increase and will be
meric composition, HD-PE vs. PET, which is also reflected in       slightly different for the two spectrometers as submersion
the absorption features in the SWIR (Fig. 10). We observed         depth increases.
variations in the magnitude and shape of reflectance of the
cup, bag and bottle that were influenced by the condition of
the items as wrinkled, crushed, straightened or containing a
fluid (Fig. 11).                                                   5   Data availability

4.3     Comparison of ASD and SEV                                  All the datasets are available in a public data
                                                                   repository.      ASD      measurements     are   available
Figures 12 and 13 show the comparison of the spectral-             at       https://doi.org/10.4121/12896312.v2      (Knaeps
reflectance measurements made with the ASD and SEV spec-           et al., 2020); SEV measurements are available at
troradiometers in the tank. Figure 12 shows the results for the    https://doi.org/10.4121/uuid:9ee3be54-9132-415a-aaf2-
blue rope aligned along the frame, and Fig. 13 shows the re-       c7fbf32d2199 (Garaba et al., 2020).

Earth Syst. Sci. Data, 13, 713–730, 2021                                            https://doi.org/10.5194/essd-13-713-2021
E. Knaeps et al.: Hyperspectral-reflectance dataset of dry, wet and submerged marine litter 727
Figure 11. Mean and SD for the bags and bottles.
6 Conclusions The results have shown that high-quality spectral-
reflectance measurements were made in the VITO calibra-
tion facility and the tank at Flanders Hydraulics. The dataset
Remote-sensing images, collected either by satellites, drones
includes a large variety of plastic specimens, measured in
or fixed cameras, have a great potential to provide a bet-
dry and wet conditions and submerged in the tank. Submerg-
ter view of the marine-plastic distribution and quantities.
ing of plastics was done in a controlled way. Only plastics
There is however a lack of knowledge of the optical prop-
which were flat and homogeneous were submerged in the
erties of marine plastics in order to design appropriate de-
tank, and their spectral reflectance was measured. Although
tection algorithms and process these images into actionable
these plastics are not found in the same way in nature, the re-
maps for decision-making. This spectral-reflectance dataset
sults provide insights into the effect of water absorption and
contributes to a better understanding of the optical proper-
suspended sediments on the measured reflectance. It allows
ties of marine-plastic litter and encourages scientists to use
researchers to select the most appropriate wavelengths and
the dataset in developing remote sensing of marine-litter-
prevent false detections. For instance, a turbid water plume
relevant algorithms.
https://doi.org/10.5194/essd-13-713-2021 Earth Syst. Sci. Data, 13, 713–730, 2021728 E. Knaeps et al.: Hyperspectral-reflectance dataset of dry, wet and submerged marine litter Figure 12. Comparison of ASD and SEV with unbiased percentage difference (UPD) for the blue rope. Figure 13. Comparison of ASD and SEV with unbiased percentage difference (UPD) for the orange place mat. Earth Syst. Sci. Data, 13, 713–730, 2021 https://doi.org/10.5194/essd-13-713-2021
E. Knaeps et al.: Hyperspectral-reflectance dataset of dry, wet and submerged marine litter                                        729

Figure 14. Unbiased percentage difference (UPD) for the orange place mat, measured at different depths.

can be easily misinterpreted for a brownish plastic sample.            gemeinschaft (grant no. 417276871) and Discovery Element of
A deeper submersion of plastics might be misinterpreted as             the European Space Agency’s Basic Activities (ESA contract
a decrease in the abundance of plastics.                               no. 4000132037/20/NL/GLC).
   The gathered dataset also shows the complexity of measur-
ing plastics in a marine environment. Even more complexity
is expected in an outdoor environment when surface features            Review statement. This paper was edited by David Carlson and
(glint, white caps) and changing light conditions come into            reviewed by Konstantinos Topouzelis and two anonymous referees.
play.
                                                                       References
Author contributions. EK and SS designed the experiments. GS           Analytical Spectral Devices: ASD Technical guide, Analytical
designed the construction on top of the tank. EK, JM, SS, GS and         Spectral Devices, Inc., Boulder, 1999.
SPG performed the spectral measurements in the calibration facility    Arthur, A. M., MacLellan, C. J., and Malthus, T.: The fields
and the tank. MM (ASD) and SPG (SEV) prepared the spectral-              of view and directional response functions of two field spec-
reflectance databases. DM performed the TSM measurements. EK             troradiometers, IEEE T. Geosci. Remote, 50, 3892–3907,
prepared the manuscript with contributions from all co-authors.          https://doi.org/10.1109/TGRS.2012.2185055, 2012.
                                                                       Garaba, S. P. and Dierssen, H. M.: Hyperspectral ultraviolet to
                                                                         shortwave infrared characteristics of marine-harvested, washed-
Competing interests. The authors declare that they have no con-          ashore and virgin plastics, Earth Syst. Sci. Data, 12, 77–86,
flict of interest.                                                       https://doi.org/10.5194/essd-12-77-2020, 2020.
                                                                       Garaba, S. P., de Vries, R., Knaeps, E., Mijnendonckx, J.,
                                                                         and Sterckx, S.: Spectral reflectance measurements of dry
Acknowledgements. We would like to thank the Port of Antwerp             and wet virgin plastics at varying water depth and wa-
for providing the plastic litter samples and Robin de Vries for sup-     ter clarity from UV to SWIR (SEV-1), 4TU.Centre for Re-
porting the SEV spectral measurements.                                   search Data, https://doi.org/10.4121/uuid:9ee3be54-9132-415a-
                                                                         aaf2-c7fbf32d2199, 2020.
                                                                       Garaba, S. P., Arias, M., Corradi, P., Harmel, T., de Vries,
Financial support. This project has received funding from the            R., and Lebreton, L.: Concentration, anisotropic and appar-
ATTRACT project funded by the EC (grant no. 777222). Shun-               ent colour effects on optical reflectance properties of virgin
gudzemwoyo P. Garaba was supported by the Deutsche Forschungs-           and ocean-harvested plastics, J. Hazard. Mater., 406, 124290,
                                                                         https://doi.org/10.1016/j.jhazmat.2020.124290, 2021.

https://doi.org/10.5194/essd-13-713-2021                                                 Earth Syst. Sci. Data, 13, 713–730, 2021
730 E. Knaeps et al.: Hyperspectral-reflectance dataset of dry, wet and submerged marine litter Huth-Fehre, T., Feldhoff, R., Kantimm, T., Quick, L., Winter, F., Knaeps, E., Strackx, G., Meire, D., Sterckx, S., Mijnendonckx, Cammann, K., van den Broek, W., Wienke, D., Melssen, W., J., and Moshtaghi, M.: Hyperspectral reflectance of marine and Buydens, L.: NIR – Remote sensing and artificial neu- plastics in the VIS to SWIR, 4TU.Centre for Research Data, ral networks for rapid identification of post consumer plas- https://doi.org/10.4121/12896312.v2, 2020. tics, J. Mol. Struct., 348, 143–146, https://doi.org/10.1016/0022- Masoumi, H., Safavi, S. M., and Khani, Z.: Identification and clas- 2860(95)08609-Y, 1995. sification of plastic resins using near infrared reflectance spec- Knaeps, E., Ruddick, K. G., Doxaran, D., Dogliotti, A. I., troscopy, Int. J. Mech. Ind. Eng., 6, 213–220, 2012. Nechad, B., Raymaekers, D., and Sterckx, S.: A SWIR based algorithm to retrieve total suspended matter in ex- tremely turbid waters, Remote Sens. Environ., 168, 66–79, https://doi.org/10.1016/j.rse.2015.06.022, 2015. Earth Syst. Sci. Data, 13, 713–730, 2021 https://doi.org/10.5194/essd-13-713-2021
You can also read