RP 2021 Greening Suburban Travel - Smartcard data analysis - Analysis & Policy ...
←
→
Page content transcription
If your browser does not render page correctly, please read the page content below
RP 2021 Greening Suburban Travel
Smartcard data analysis

                                   1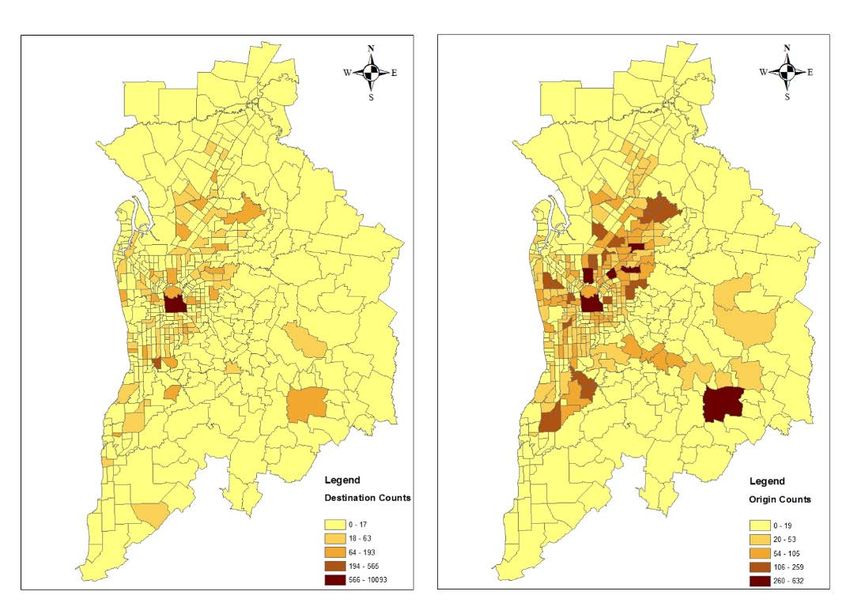
Authors              Mrs. Mona.Mosallanejad, Dr. Sekhar Somenahalli and Mr. Callum Sleep
                        Smartcard data analysis
Title

ISBN

Format

Keywords             Low Carbon Living, Smartcard data, Adelaide

Editor

Publisher            CRC for Low Carbon Living

Series

ISSN

Preferred citation

                                                                                           2
Acknowledgements
This research is funded by the CRC for Low Carbon Living Ltd supported by the Cooperative Research Centres program,
an Australian Government initiative.

Disclaimer
Any opinions expressed in this document are those of the authors. They do not purport to reflect the opinions
or views of the CRCLCL or its partners, agents or employees.

The CRCLCL gives no warranty or assurance and makes no representation as to the accuracy or reliability
of any information or advice contained in this document, or that it is suitable for any intended use. The
CRCLCL, its partners, agents and employees, disclaim any and all liability for any errors or omissions or in
respect of anything or the consequences of anything done or omitted to be done in reliance upon the whole
or any part of this document.

Peer Review Statement
The CRCLCL recognises the value of knowledge exchange and the importance of objective peer review. It is
committed to encouraging and supporting its research teams in this regard.

The author(s) confirm(s) that this document has been reviewed and approved by the project’s steering
committee and by its program leader. These reviewers evaluated its:

    • originality
    • methodology
    • rigour
    • compliance with ethical guidelines
    • conclusions against results
    • conformity with the principles of the Australian Code for the Responsible Conduct of Research (NHMRC
       2007),
and provided constructive feedback which was considered and addressed by the author(s).

© 2018 Cooperative Research for Low Carbon Living

                                                                                                               3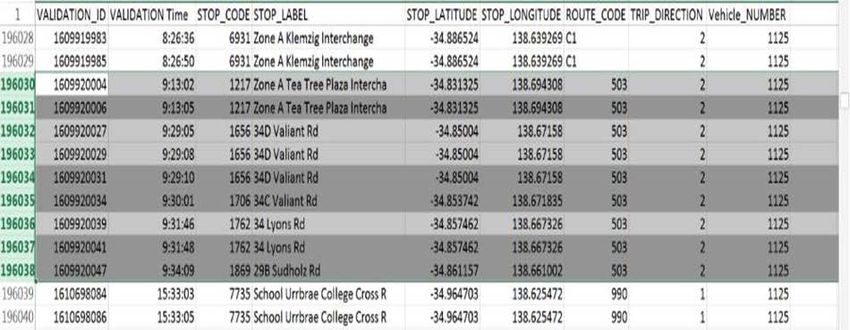
Greening Suburban Travel
Smartcard data analysis

Table of Contents
    Acknowledgements ..................................................................................................................................... 3

    Disclaimer.................................................................................................................................................... 3

    Peer Review Statement ............................................................................................................................... 3

Background ...................................................................................................................................................... 2

Data Structure .................................................................................................................................................. 3

Extraction of OD matrices ................................................................................................................................ 5

Origin and Destination analysis ........................................................................................................................ 6

On-Time Performance of Bus Services using smartcard data ......................................................................... 10

Assessing bus arrival time reliability............................................................................................................... 12

Processing data for reliability ......................................................................................................................... 13

Analysis of bus arrival time reliability ............................................................................................................. 14

Conclusions .................................................................................................................................................... 17

References...................................................................................................................................................... 18

                                                                                                                                                              4
List of Figures
Figure 1. Origin and Destination counts for each suburb (bus users) ............................................................... 6
Figure 2 Suburbs with a high number of transfers (morning peak and weekdays) .......................................... 8
Figure 3 Transfer type during weekends and weekdays................................................................................... 9
Figure 4 Comparison of weekday and weekend route lateness frequency distribution................................. 14
Figure 5 The distribution of lateness at boarding stops ................................................................................ 15
List of Tabless
Table 1 Individual MetroCard information ....................................................................................................... 3
Table 2 Initial boarding data structure .......................................................................................................... 13
Table 3 Descriptive statistics of route groupings .......................................................................................... 15
Table 4 Statistics for passenger observation data .......................................................................................... 16
5demand and its reliability will facilitate the
Background design of appropriate public transport routes,
and increase the efficiency which will, in turn,
As public transport agencies increasingly adopt
enhance public transport patronage. The data
the use of automatic data collection systems, a
used in this research was provided by the
significant amount of boarding data becomes
Department of Planning Transport and
available, providing an excellent opportunity for
Infrastructure (DPTI) in Adelaide, South Australia
transit planners to access spatial-temporal data
for the month of May 2017. A methodology was
(Rahbar et al. 2017; Tao 2018) which can be used
developed, using SQL software and based on the
for a better understanding of human mobility
trip chain model, to create an OD matrix for
and the performance of a transit system ( Mahrsi
Adelaide’s bus users, and from it to estimate the
et al. 2017). Smartcard data can be used to
demand for the system. Adelaide was chosen for
examine a whole network regularly, and to make
this study because unlike in other cities,
practical estimates of passenger origin-
commuters scan their smartcard upon boarding
destination (OD) patterns and is a great asset in
but not on alighting. This allows the algorithm to
understanding public transport reliability issues.
be generic and therefore applicable elsewhere.
Having knowledge of public transport travel
2information. In Adelaide, where a flat fare policy
Data Structure operates, commuters validate their cards when
they board a public vehicle but not on alighting.
The primary function of the smartcard is to
Three modes of transport are available: bus,
collect a fare, but it can also be utilised for
train and tram. The information for each
finding passengers’ travel patterns. Usually,
smartcard transaction contains card
smartcard data does not directly provide the
identification, time, date, transport mode used,
information required for planners (Kurauchi &
fare type, stop code, stop label, route code and
Schmöcker 2016). The flat fare policy and some
validation type (see Table 1). When passengers
zonal fare policies require commuters to tap
swipe their card and pay an initial transaction,
once after boarding and record only a single
the fare is valid for two hours, and passengers
transaction. However, in some cities, an exit
can use any public transport within this time
reader is available as well if the fare is based on
without incurring further costs.
distance or zones. In such a system, each trip
generates two records: for boarding and for
alighting (Kurauchi & Schmöcker 2016). Each
MetroCard contains spatial and temporal
Table 1. Individual MetroCard information
Media Fare Transport Date & Stop Latitude Longitude Route Direction
code type mode time code code
807***CB SV 4 2017-05- 8089 - 138.525912 Tram 1
01 34.979759
09:49:35
94E***FB TICKETS 1 2017-05- 3351 - 138.598468 251 1
01 34.924343
10:39:15
11C***89 28DAY 1 2017-05- 3285 - 138.607313 271 1
05 34.920343
10:46:32
707***27 OTHER 1 2017-05- 2072 - 138.638452 H22 1
01 34.870071
11:04:05
584***97 SV 5 2017-05- 1852 - 138.650472 GWC 1
08 34.860916
11:06:36
Note: Transport mode: 1 = Bus, 3 = Station, 4 = Tram, 5 = Train
3There are some deviations from the one-swipe
rule: railway stations in Adelaide operate under
a closed system, and swiping is required for both
boarding and alighting, and various systemic and
user issues mean that transfers between the
train and other modes cannot be estimated
directly from the MetroCard. In addition, there is
a free tram zone in Adelaide where passengers
do not need to swipe their cards; this means that
the tram boarding point is not available. Given
these limitations, this study focuses on bus
users.
4Extraction of OD matrices • A passenger’s alighting point is assumed
to be within walking distance of the
Knowledge of transit demand plays a decisive next boarding stop
role in public transport plans to improve the • Passengers return to the place where
performance of the system. One common they first boarded that day, or to some
method for estimating the destination is the trip other nearby station.
chain model. As mentioned previously, each • Commuters take the first available
smartcard can provide the boarding location and service after arriving at a boarding
time of each bus trip but not the alighting place.
location, so the trip chain model assumes the • Each smartcard is used by a single
alighting stop is located within acceptable commuter and cannot be used by
multiple passengers.
walking distance of the next stop. Some
• Commuters who use the public
assumptions considered in this algorithm are:
transport system do not use any other
• The initial boarding location of a trip leg mode of transport on that same day
is the ‘origin’.
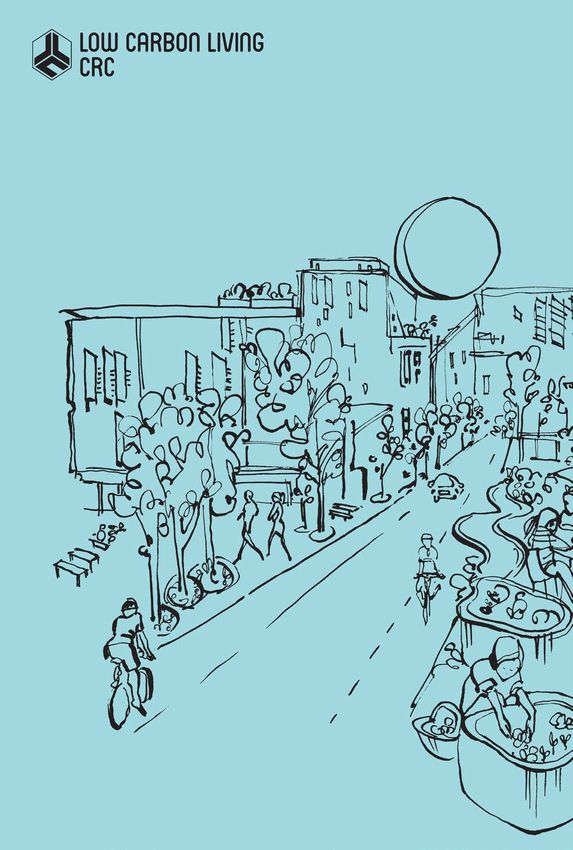
5the trip chain model, bus users’ origins and
Origin and Destination analysis destination counts during the morning peak
were derived for each suburb (Figure 1). Most
One of the critical considerations when planning
trips originated from Paradise, Modbury,
transit services is estimating the demand for
Adelaide, and Klemzig suburbs. Adelaide,
each route, to determine the frequency and
Bedford and Modbury suburbs were the
capacity of the vehicles (Tamblay, Muñoz &
destinations for most journeys during the day.
Ortúzar 2018). An OD matrix provides critical
Suburbs with the highest origins and
information for transit planners by estimating
destinations were shortlisted and analysed.
the number of journeys between different
Finally, the data was validated using other
zones, information which can be used in
sources from the Department of Transport and a
transportation planning, design and
limited survey.
management. After analysing the data based on
Figure 1. Origin and Destination counts for each suburb (bus users)
6The origin-destination analysis showed that bus exploring the option of a direct route
movements were radial, and most trips during from Paradise to Flinders University that
the morning peak ended in the CBD. These avoids congested city links.
movements were further explored to rationalise
• Modbury–North Adelaide: bus routes
the existing routes. The information from an OD
between these two suburbs run through
analysis that was used to identify new bus routes
the CBD. As explained above, by
to optimize the bus routes and reduce
introducing direct routes between these
congestion within the Central Business District
two suburbs will lead to reduced
(CBD) of Adelaide. Few examples of suggested
congestion in the city center.
new routes are given below:
• Modbury–Bedford Park: the OD analysis
showed high demand from Modbury to The OD analysis also helped us in greater
Flinders University during the morning understanding about the mode transfers and the
peak, but just one route (G40) runs role played by the key interchanges. In addition,
between the suburbs, going through the the results indicate that all the transfer points
CBD. The results indicate that providing are the same for both weekdays and weekends,
direct routes from Modbury interchange although destinations may change. Most
to Bedford park will reduce overall transfers during weekdays occurred in three
travel time to passengers and also suburbs: Adelaide (CBD), Paradise, and Modbury
reduce congestion in the Adelaide CBD. and as expected most passengers travelled to
Adelaide during the morning peak to start a daily
• Paradise–Bedford Park: there are two
activity (refer Figure 2) . Modbury and Paradise
bus routes between these two suburbs
are identified as the busiest interchanges, and it
(W90 and G40), and both pass through
is evident that most commuters use these
the CBD, which is heavily congested
locations for transfer.
during the morning peak. It is worth
7Figure 2 Suburbs with a high number of transfers (morning peak and weekdays)
As presented in Figure 3, the comparison of train on the weekdays is higher than on the
weekday and weekends illustrates that transfer weekend. It can be related to the reliability of
between bus to bus and train to train are more trains in comparison with bus due to traffic
popular than other kinds of transfers. While on congestion and less travel time, so people prefer
the weekend, most commuters transferred from to use a more reliable system on the weekdays
bus to bus (51%), and on the weekdays it to access to their destination. Travel pattern
decreased to 39.76%, which means that the among bus to train transfers and vice versa is the
number of passengers who transfer from train to same during weekdays and weekend.
8Weekday Weekend
BT BT
1.16
TB TB
0.36
BTM 6.68 BTM
6.18 0.83 6.41
6.74
BCP 1.74
0.21 BCP
0.60 29.84
44.53 BB BB
BCB 0.55 BCB
0.19
39.76 TMB 0.57 0.00 TMB
1.78 51.04
0.62
0.01 TMT TMT
0.18
TTM TTM
TT TT
Figure 3: Transfer type during weekends and weekdays.
9South Australia’s Public transport system is
On-Time Performance of Bus Services operating well below its full potential.
using smartcard data According to the Australian Bureau of Statistics
(Australian Beaurau of Statistics, 2009), 14.4 per
Throughout the world, the reliability of public cent of adults across Australia were using public
transport systems is constantly under review. In transport for their trip to work or study in 2006,
recent years, the widespread prevalence of while in Adelaide this figure was less than 10%.
privately owned motor vehicles and people’s The use of public transport between 1996 and
quickening pace of life has increased the 2006 increased by only 18 per cent in
importance of public transport service reliability Adelaide, dwarfed by increases of 35 per cent
and on-time performance. This is of potential and 22 per cent in Melbourne and Brisbane
concern for bus services as buses share road respectively (Australian Beaurau of Statistics,
space with a growing number of other vehicles. 2009).
In Adelaide, the capital city of South Australia,
the public transport system has been plagued by According to the Adelaide Metro website
concerns of unreliable services (Kelton, 2012a). (Adelaide Metro, 2012), the quality of South
Australian public transport needs minor
The South Australian community is encouraged, improvement. DPTI monitors the performance
by the government, to use public transport of the bus contractors to make sure that the
especially for regular trips such as the daily service quality (on-time running and reliability)
commute. However, the South Australian meets community needs and demands. DPTI
public sector has found that many commuters defines service as ‘on-time’ and ‘reliable’ if the
are avoiding public bus services, reducing the vehicle departs no more than 59 seconds before
total number of commuters using public and no more than 4:59 minutes (i.e., 4 minutes
transport (Kelton, 2012b). South Australia’s 59 seconds) after the time published in the
initial boardings for metropolitan public timetable (Adelaide Metro, 2012). It must be
transport rose each year incrementally between noted that not all stops appear on the timetables;
2000 and 2009, reaching 52.4 million in the at these locations, estimated times are provided
2009–2010 financial year (DPTI, 2011). to the travelling public. Even with 6 minutes’
However, DPTI’s Annual Report for 2010– flexibility, a large proportion of services are
2011 (Department of Transport Energy and failing to meet targets. This lack of reliability for
Infrastructure, 2011) states that in 2010–2011, public transport services is a significant concern
initial boardings reduced by 2.2 per cent to 51.25 for the community.
million. One reason for this reduction is the In the past, several attempts have been made to
perceived unreliability of services.(Nankervis, improve the reliability of bus services in
2016) Often, buses do not meet the advertised Adelaide, including: fining the contractors
service times, with many services running a operating the bus services when they fail to meet
quarter or even half an hour late—or, in some targets (Bray & Wallis, 2008); continuously
cases, not arriving at all (Kelton, 2012a). changing and reviewing timetables to suit
changing road conditions; fitting buses with
10Global Positioning System (GPS) devices; and
auditing buses to determine which bus routes
require attention. Automated Vehicle Location
(AVL) systems are helping public transport
agencies all over the world to improve their
performance. However, there is a difference
between the performance at the vehicle level
and what the passenger experiences, often at the
stop level (Chen et al., 2009) so it is important to
collect and interpret the data accordingly. This
study seeks to investigate travel time reliability
as seen by the passenger using data collected
automatically.
11Assessing bus arrival time reliability away from Adelaide and impossible to ascertain
arrival time at terminals. A more detailed study to
address these concerns could be undertaken with
Using boarding data to assess travel time has the AVL data.
advantage that these records directly relate to
passenger experiences. Furthermore in Adelaide
boarding data is recorded at the stop locations,
as are the timetables, eliminating the need to
process and compare the datasets
geographically. Bus services were separated
from other route services offered by Adelaide
Metro for analysis primarily because they form
the bulk of the network and are most affected
by travel time variability. In the Adelaide
network, the bus driver is also the ticket
salesman and therefore must wait until he/she
is satisfied no further passengers need to buy a
ticket before departing the stop. Compare this
to the rail services where fare payment is
collected by an onboard vending machine; a
passenger could conceivably buy a ticket in
transit and validate it as the vehicle is about to
reach the next stop. Time spent selling tickets
has been previously attributed exclusively to
dwell time (time spent stationary at a stop)
(Dorbritz et al., 2009), this helped shape the
approach for the investigation, giving
confidence that the last boarding would reflect
bus departure time. As expected similarity was
observed when the estimations of departure
time from boarding data were compared to those
obtained from Automatic Vehicle location
records. These records were obtained
previously covering a small selection of routes.
There are however some limitations of this
method. Primarily, we only have data on a bus’s
location when a person, passenger or staff, boards
and validates a ticket. This makes it difficult to
track a bus’s progress in the afternoon heading
12Processing data for reliability The raw data as shown in Table2 has three
distinct sections of information. Firstly there’s
The busses true departure time was estimated the identifying information specific to each
from the last validation at a particular stop. This record in the form of an ID and a timestamp.
is deemed valid for assessing the lateness for bus Next there’s the geographical information
services as there is only one boarding door at the identifying the boarding location, and finally,
front of the bus and the driver’s presence helps there’s the service information relating to the
enforce fare payment. For example, the records vehicle’s operation.
in Table 2 below are those showing the progress
of bus 1125 along route 503. Those records
highlighted in the darkest grey will be retained
for further processing.
Table 2: Initial boarding data structure
134). Statistically, the routes on Wednesday and
Thursday have an almost standard distribution of
Analysis of bus arrival time reliability
lateness with mean and median values within 20
seconds. Their average lateness was within 21
The data was first aggregated by route, and while seconds through the variance as measured by
there was some inconsistency in average lateness standard deviation was almost 40 seconds higher
observed across the three days individually, there on Thursday. As might be expected bus services
is a clear trend observed towards consistency showed less variability on Saturday with average
across days. On a scatter plot all the routes and lateness of 55 seconds and a standard deviation
their average likenesses were plotted for each day of fewer than two minutes (Table 3). The figure
separately. Each route was treated equally spaced depicts this difference between route lateness
one unit apart along the X-axis. Regardless of the distributions on a weekday vs a weekend. Because
order of the routes presented the trend lines for there were no routes in every time category a moving
the two days are in high agreement both showing average (Mov.Avg.) has been used to smooth the
distribution curve.
little to no variance across bus services (Figure
Figure 4: Comparison of weekday and weekend route lateness frequency distribution.
14Table 3 : Descriptive statistics of route groupings
Wed Thurs Sat
(Time: hh:mm:ss) (Time: hh:mm:ss) (Time: hh:mm:ss)
Average 0:01:40 0:01:22 0:00:55
St dev 0:02:27 0:03:05 0:01:53
Median 0:01:21 0:01:10 0:00:30
The average observed lateness was calculated as far south in a clockwise loop. Interestingly the 745
well as the percentage of boarding locations route which follows the same streets but in an
where the service exceeded the five-minute anticlockwise direction showed much more
tolerance for lateness. The bus route 747 stood variability with average lateness approaching 12
out here as being on average between 7.5 and minutes on Wednesday and only 3.5 minutes on
9.25 minutes late across both days. Furthermore, Thursday. Perhaps this is due to a
buses at 17% of boarding locations were reported disproportionate number of un-signalised right
as late by the Adelaide metro standard of arrival turns required across traffic for the 745 services.
5 minutes or more after the published time. When considering the whole dataset of
passenger observations shown in Figure rather
The 747 route is a feeder service linking the
than route groups, further differences were
Seaford and Noarlunga interchanges in Adelaide’s
observed.
Figure 5 The distribution of lateness at boarding stops
15Table 4 Statistics for passenger observation data became. This indicates that the sale of tickets
inside the bus, is at most a minor cause of travel
time unreliability. The presence of extra time
AVERAGE
0:00:36 0:02:13 taken by paper/magnetic ticket purchase having
HR:MIN:SEC
no effect on reliability indicates that the
(Thursday Saturda
) y
distribution of such events either spatially or
MEDIAN
temporarily is captured in the timetable. This
HR:MIN:SEC
0:01:03 0:01:12 implies that there are travel time savings if not
ST DEV
reliability improvements to be gained through
HR:MIN:SEC
0:13:03 0:08:26 off-board ticket sales or prepaid only services
such as those used in Sydney (Byatt, Oscuro &
% ONTIME 56.332% 75.451% Rookes, 2008).
Of the weekdays the services on Thursday
performed considerably poorer with a standard
deviation of 13 minutes. This higher spread
means the buses were within the acceptable
limits of +1 and -5 minutes for only 56% of
observations compared with 75.5% of those on
Saturday. Where there were multiple boardings
of bus service at the same stop the time between
boardings could be found. A smartcard, boarding
took place on average 12 seconds after the
previous boarding, whereas boarding with a
magnetic ticket (tickets sold inside the bus) took
twice as long as 24 seconds. It was also found that
these magnetic ticket boardings were over-
represented in the database of final boardings at
each stop. Across a typical week, single trip
tickets make up 8% of all boardings while these
same tickets are the final boarding at a stop 17%
of the time. This does confirm that the sales and
validation process is prolonging the time that
buses stand at some stops. When the effect was
investigated at a network level, it was found that
there is no relationship between the percentage
of departures where the last recorded boarding
was with a paper ticket and how late the buses
16Conclusions algorithm, and sensitivity analysis could also be
carried out for various assumptions. Adelaide’s
The public transport OD matrix is a useful bus services show less variability of lateness on
prerequisite for planners to optimise public the weekends although there is a lower
transport systems. The reliability of the system percentage of prepaid tickets used. Ticket sales
is an important criterion to encourage people to inside the bus are increasing the travel time of
leave their vehicles at home and take public Adelaide’s public transport bus services.
transport instead. This research presented an However, they are not contributing to travel
overview of ridership patterns using one- time unreliability. Removing the cash ticket
month MetroCard data in Adelaide. An sales from Adelaide’s bus network will not
accurate estimation of public transport OD will improve reliability. however, travel time
be a significant help to public agencies involved savings could be achieved
in route rationalisation, which will lead to higher
public transport patronage. In further studies,
census data could be used to validate this
17The Advertiser. Available from: References
You can also read