Argus: End-to-End Service Anomaly Detection and Localization From an ISP's Point of View
←
→
Page content transcription
If your browser does not render page correctly, please read the page content below
Argus: End-to-End Service Anomaly Detection and
     Localization From an ISP’s Point of View
                             He Yan1 Ashley Flavel1 Zihui Ge1 Alexandre Gerber1
                        Dan Massey2 Christos Papadopoulos2 Hiren Shah1 Jennifer Yates1
                                  1 AT&T  Labs - Research     2 Colorado State University

                                 {yanhe,af360w,gezihui,gerber,hiren}@research.att.com
                                           {massey,christos}@cs.colostate.edu

   Abstract—Recent trends in the networked services industry          end-users, which further depends how frequently they access
(e.g., CDN, VPN, VoIP, IPTV) see Internet Service Providers           the services. For example, if an end-user only accesses the
(ISPs) leveraging their existing network connectivity to provide      service a few times in a day, systems based on passive
an end-to-end solution. Consequently, new opportunities are
available to monitor and improve the end-to-end service quality       monitoring at end-user side may not have sufficient samples
by leveraging the information from inside the network. We             to detect service events.
propose a new approach to detect and localize end-to-end                 Although networked services are becoming a part of daily
service quality issues in such ISP-managed networked services by      life, existing approaches are still quite limited in monitoring
utilizing traffic data passively monitored at the ISP side, the ISP   end-to-end service quality. Recent trends in the networked
network topology, routing tables and geographic information.
This paper presents the design of a generic service quality           services industry see Internet Service Providers (ISPs) lever-
monitoring system “Argus”. Argus has been successfully deployed       aging their existing network connectivity to provide end-to-
in a tier-1 ISP to monitor millions of users of its CDN service       end service. Consequently, new opportunities are available to
and assist operators to detect and localize end-to-end service        monitor and improve end-to-end service quality by leveraging
quality issues.This operational experience demonstrates that          the information from inside the network. We argue that the
Argus is effective in accurate, quick detection and localization of
important service quality issues.                                     most effective way to manage end-to-end service quality in
                                                                      these ISP-managed services is to passively monitor the traffic
                       I. I NTRODUCTION                               to/from end-users from the ISP’s point of view.
                                                                         In this paper, we design a system called “Argus” to de-
   The Internet has become the mainstay of many networked             tect and localize end-to-end service anomaly events in ISP-
services (e.g., content distribution network (CDN), VoIP, VPN,        managed networked services in a proactive manner. In contrast
IPTV). End-to-end service quality is the most important metric        to existing systems based on active probing or passive monitor-
in evaluating these networked services and largely decides            ing at end-user side, our approach monitors end-to-end service
the reputation and revenue for the service providers. Existing        quality from an ISPs point of view in a centralized manner
end-to-end service quality management system can be largely           utilizing traffic data passively monitored at the ISP side [7],
divided into two branches: active probing and passive monitor-        the network topology, routing information and geographic
ing. Active probing based systems (e.g., Keynote [2], Gomez           information. Although our approach is directly applied to ISPs,
[1]) that periodically probe the service from agents at different     it can be extended to other general service providers (e.g.
network locations to detect end-to-end performance issues             Google, Akamai) with proper network topology and routing
have several limitations. First, without active probes from a         information.
vast number of network locations throughout the Internet, the            The organization of the rest of the paper is as follows.
monitoring coverage is limited and some end-to-end service            Section 2 presents the system design and detailed description
quality issues may not be detected. Secondly, probe packets           of Argus. We describe how to apply Argus in an ISP-managed
also place additional overhead on the network and may be              CDN service in Section 3. Section 4 evaluates the accuracy of
treated differently than normal packets.                              service events detected in the CDN service by Argus using
   In passive monitoring based systems (e.g., [5]), first each        a list of labeled events from the CDN service team and
end-user detects the end-to-end service quality issues individ-       Keynote [2] agents. In Section 5, we present the overall results
ually based on performance metrics extracted from passively           for all detected service events and two representative case
monitored traffic and service quality issues detected by in-          examples from our operational experience with Argus in the
dividual end-users are correlated spatially and temporally to         CDN service. Finally we present the related work in Section
determine the scope of the problem. Although it overcomes the         6 and conclude the paper in Section 7.
limitations in active probing based systems, passive monitoring
at end-user side has it own limitations. First these systems                          II. T HE D ESIGN OF “A RGUS ”
require end-users to install monitoring software, which may
cause a deployment issue as there is no incentive for end-users          In this section, we describe the design of “Argus”, a
to help service providers manage their services. Moreover, the        generic detection and localization system for end-to-end ser-
effectiveness of these systems is limited by the sparsity of          vice anomaly events. “Argus” turns the end-to-end perfor-
passive end-to-end performance measurements for individual            mance measurements for individual end-users into actionable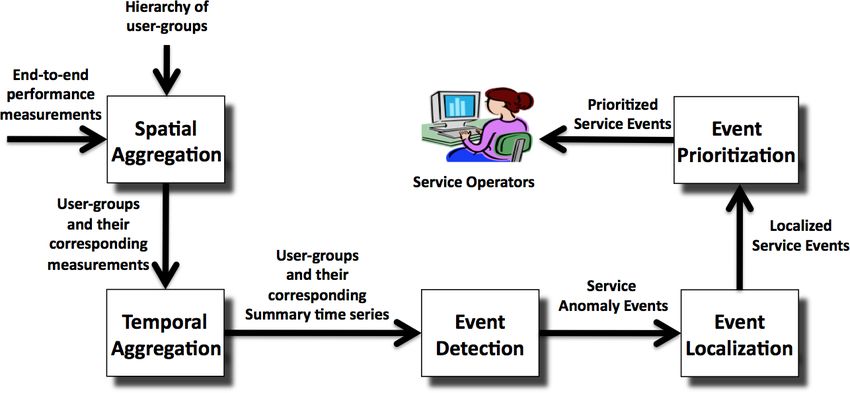
be actionable from service provider’s perspective compared to
the service events detected on individual end-users.
In this step, for each user-group (obtained in the pervious
step), we temporally aggregate its end-to-end performance
measurements into time-bins. Once time-bins are formed, a
summary statistic is selected from all the end-to-end perfor-
mance measurements in each time-bin to form a summary
time series. Several summary statistics can be used here
– minimum, maximum, average, median or other percentile
values. Different statistics may provide an advantage for
Fig. 1. The architecture of Argus
tracking certain type of issues. For example, if the end-to-
end performance measurement is round trip time (RTT), the
minimum may well capture baseline RTT due to network
propagation delay while being oblivious to varying queuing
delay that may be due to network congestion while average
can well capture the service event due to network congestion.
Since our main goal is to detect service events that impact a
relatively large collection of users in each user-group, “Argus”
uses the median as the summary statistic for each time-bin by
default. We find the median quite effective in tracking service
side or network side issues while being robust to variability
in performances of individual end-users due to their local
processing or local queuing delays.
Fig. 2. An example of spatial aggregation in Argus
C. Event Detection
Once we transform the end-to-end performance measure-
service anomaly events in real-time. Specifically we adopt a ments into summary time series of each user-group, we
five-stage approach for “Argus” as shown in Figure 1. can apply time series analysis techniques to extract service
anomaly events from them. There are a wide range of time
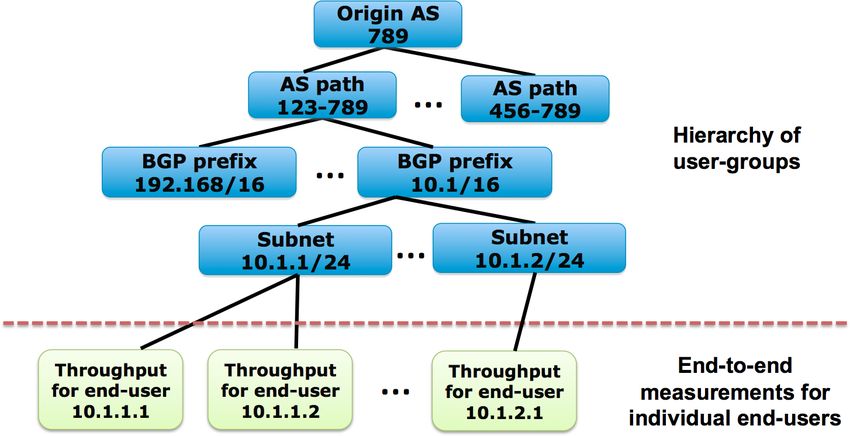
A. Spatial Aggreagtion series anomaly detection algorithm in the literature, ranging
from Box-Jenkins linear time-series forecasting techniques,
In order to avoid keeping track of the end-to-end service
to frequency domain Fourier analysis or Wavelet analysis
quality associated with millions of individual end-users and
based approaches, to structural analysis such as principal
address the sparsity issue in the end-to-end performance
component analysis. Due to the scale of our application, it
measurements for individual end-users, “Argus” first spatially
is desirable to have online anomaly detection with minimal
aggregates end-to-end performance measurements associated
runtime complexity and memory requirement. We base our
individual end-users into user-groups. Each user-group is set
approach on the classic additive Holt-Winters (HW) algorithm
of end-users that share some common attributes. As shown in
[3], a widely used one-pass online time series forecasting
Figure 2, all end-users from a “BGP prefix” can form a “BGP
method. One of the key strengths of HW is that it involves very
prefix” user-group and the users from the same origin AS can
light-weight computation and has very few states to maintain.
form a AS user-group. The attributes on individual end-users
At a high level, HW runs three exponential smoothing
can be obtained from different data sources such as network
processes on three components of the summary time series:
topology, routing information and geographic locations. In
the baseline, the linear trend, and the seasonal effect to dy-
practice, how to aggregate the end-to-end performance mea-
namically formulate forecast values based on historical values.
surements spatially reflects where operators want to detect and
Specifically, the forecast value yˆt at time t is formulated as
localize service events.
follows:
B. Temporal Aggregation yˆt = at−1 + bt−1 + ct−n
After the step of spatial aggregation, each user-group has a where at is the baseline at time t − 1, bt is the linear trend
set of end-to-end performance measurements from individual at time t − 1 and ct−n is the seasonal effect at time t − n.
end-users associated with it. The next important question to Note n is the number of cycles in one season (e.g., 24 cycles
answer is that how to detect service anomaly events for each in one day to model hourly seasonality) and t − n means the
user-group. The challenge here is that the end-to-end perfor- same cycle in the previous season (e.g., the seasonal effect for
mance measurements belonging to each user-group could be 1pm in the previous day is needed to formulate the forecast
quite noisy as they are collected from different end-users. Our value for 1pm today). Given a new value yt , at , bt and ct are
solution is to focus on the summary statistics (e.g., 50th per- updated exponentially with parametersα, β, γ respectively.
centile, 95th percentile, min, max) of the distribution instead In order to determine if a new value yt in the summary time
of based on individual end-to-end performance measurements. series is abnormal or not, we compare the current residual
Obviously, we lose some details regarding individual end-users error (e.g., absolute difference between the actual value yt
by focusing on the summary statistics. But it is acceptable as and the forecast value yˆt ) with the historical residual errors
the goal is to detect service events that impact the user-groups. from the same cycle in previous seasons. In this way, seasonal
The service events detected on user-groups are more likely to variability in residual errors can be captured. The update
21000
900 our approach has a more stable forecast line and thus more
800
700
robust in detecting anomalies.
600
rtt(ms)
500 900 900
400 800 800
300 700 700
200 600 600
100 500 500
rtt(ms)
rtt(ms)
actual values
0 400 400
0 200 400 600 800 1000 1200 1400
time interval index 300 300
200 200
actual values actual values
Fig. 3. Anomalies in a summary time series that consists of the average 100
forecast values
detected anomalies
100
forecast values
detected anomalies
0 0
RTTs, one for each 5 minutes 460 480 500 520 540 460 480 500 520 540
time interval index time interval index
(a) Classic HW (b) Our Approach
formula for dt is similar to that of ct and uses the same Fig. 4. Forecast values and detected anomalies for classic HW and our
parameter γ: approach using the same set of parameters. Au is set to 4 in our approach.
dt = γ × |yt − yˆt | + (1 − γ) × dt−n 2) Fast Adapt to Permanent Service Performance Changes:
Network and service upgrades can often introduce a perma-
Specifically, for each yt , we calculate its descretized abnormal nent level-shift on the end-to-end service performance. Once
level A as follows: A = 0, 1, 2, 3, 4, 5 when |yt − yˆt | is “Argus” is confident that a permanent change has taken place,
in [0, 0.5 × dt−n ), [0.5 × dt−n , 1 × dt−n ), [1 × dt−n , 1.5 × it is ideal to “forget” about the extended long historical data
dt−n ), [1.5 × dt−n , 2 × dt−n ), [2 × dt−n , 2.5 × dt−n ) and and adapt the model to capture the recent performance only.
[2.5 × dt−n , ∞) respectively. Although it is configurable, To achieve so, a shadow set of baseline ast , linear trend bst ,
we typically consider A of 4 or above as anomalous as seasonal effect cst and residual error dst is updated in parallel
suggested in [4]. This is a relatively aggressive setting (i.e., using its own αs , βs and γs . Compared with the working set of
more anomalies). However, it is an appropriate setting as our baseline at , linear trend bt , seasonal effect ct and residual error
event localization and prioritization (next two stages) is robust dt , the shadow set is updated differently in two aspects. First,
to false positives. We further combine consecutive anomalous the shadow set gives more weights to the recent observations
values in the summary time series into a single anomaly event via using relative large αs , βs and γs while the working set
and keep track of all on-going anomaly events, with the begin gives more weight to the history compared to the recent
time of the event being the begin time of the first anomalous observations by using relative small α, β and γ. Secondly,
value. anomalies are used to update the shadow set while they are
Although the classic HW has been proven effective in ignored when updating the working set as we mentioned in
many different application settings, when dealing with the real II-C1. In this way, the shadow set can quickly adapt to the
service performance measurements, we have uncovered several permanent level-shift.
serious deficiencies with HW and proposed corresponding A moving window of size L is used to keep track the
enhancements. recent values. Once the percent of abnormal values in the
1) Robust Forecast against Dirty Data and Service Dis- moving window exceeds a threshold P (suggesting that a
ruptions: “Dirty data” is unfortunately unavoidable in real permanent level-shift has occured), the working set is replaced
service performance measurements – problems in various with the shadow set as the shadow set should have adapted
software/hardware components of data collectors and ingestion to the permanent level-shift. The configuration of L and P
servers can occur, rendering the performance data nonsensical. determines the trade-off between the timeliness in adapting
Furthermore, there are many situations in which network prob- to permanent changes and the risk of wrongly adapting to
lems can cause service disruptions, driving the performance temporary abnormal changes.
data out of the norm. For example, in Figure 3, the huge dip 3) Leverage Temporal Continuity in Residual Errors: In
(the average RTT is decreased significantly due to missing the classic HW, the exponential smoothing is applied on the
measurements) is caused by a bug in the data collector and residual errors dt on a per cycle basis. For example, if there
the spike is caused by a link congestion. It is highly desirable are 24 hourly cycles in one season, the exponential smoothing
that forecast and anomaly detection can be robust against the only applies to the residual errors of the same hour in different
“dirty data” and service disruptions in our context. In our days. In order to leverage temporal continuity in residual errors
approach, at , bt and ct are not updated if the abnormal level perform in neighboring cycles (e.g., the neighboring hours
A of the current value yt is above a configurable threshold in a day), weighted moving average is used for smoothing
Au , which depends on the nature of the summary time series. the residual errors dt among neighboring cycles. Specifically,
For a stable time series, Au should be configured tightly so given a new value yt , the residual errors for current cycle and
that most anomalies are excluded in formulating the forecast its neighboring cycles t − w, · · · , t, · · · , t + w are updated as
values. For a noisy time series, less tight Au is desirable to follows:
avoid excessive number of anomalies.
As a head-to-head comparison, we take a close look at the |i| |i|
dip in Figure 3 and plot the different behaviors for classic dt+i = γw ×(1− )×|yt − yˆt |+(1−γw ×(1− ))×dt+i−n
HW and our approach in Figure 4. One deficiency in classic w+1 w+1
HW is that the forecast values can be easily contaminated by where w is the smoothing window size, i is offset compared
nonsensical performance data as shown here. On the contrast, with the current cycle ranging from −w to w and γw is derived
3from γ given the window size w. Similar to the working set, E. Event Prioritization
the residual errors in the shadow set are also smoothed among After event localization stage, “Argus” employes a ranking
neighboring cycles in this way. function to prioritize the localized service anomaly events.
Leveraging temporal continuity is critical in particular when Since each anomaly event may contain multiple anomalous
the the number of cycles in one season is large (e.g., 288 5- time-bins, we first estimate the severity score of each time-
min intervals in a day). Smoothing the residual errors over bin and then use the aggregate score of all time-bins as the
neighboring cycles restores the continuity and makes anomaly severity score of the service event. The ranking function used
detection more robust. to estimate the severity score of each anomalous time-bin
4) Fine-Grained Detection with Coarse-Grained Model: incorporates two factors – the significance of the relative size
In the classic HW, the detection interval has to be aligned of the anomaly and the breadth of its impact scope. The
with the cycles in a season. For example, if the classic HW significance of the anomaly can be measured by the deviation
models a time series with 24 hourly cycles in one season, score |d| from the EHW algorithm. The impact scope can be
the anomaly detection interval has to be hourly. In order to measured by the the number of distinct end-users observed in
trigger anomaly detection more frequently (e.g., once per 5 the time-bin, which we denote as c. We choose distinct end-
minutes), the classic HW has to model the time series with users since it is robust against anomalies dominated by a few
more cycles (e.g., 288 5-minutes cycles in one season). The outlier end-users.
memory consumption in HW is proportional to the number of Specifically, for anomaly event e, its baseline ranking score
cycles as one ct and one dt need to be maintained per cycle. re is defined as:
Thus increase from 24 hourly cycles to 288 5-minutes cycles X
in one reason can considerably increase memory consumption re = Ab × C b
by 12 times. Considering the millions of time-series need to b∈ bins of e
be monitored in a service, fine-grained model might not be where Ab and Cb is the abnormal level and the number of
affordable. distinct end-user for bin b. In this way, long lasting events are
In our approach, we enable the fine-grained detection with a likely given higher priority than short events.
coarse-grained model by linear interpolation of the parameters
from two consecutive cycles in the model. If the anomaly III. O PERATIONAL R ESULTS
detection interval is T (e.g., 20 minutes), one hourly bin (e.g., In this section, we summarize the results of running the
11:20 - 12:20) may span over two consecutive hourly cycles “Argus” system monitoring a CDN hosted in a tier-1 ISP.
(e.g., 11:00 -12:00 and 12:00 - 13:00) in the model. The c0t This ISP is referred to as “local ISP” in the remainder of
for the hourly bin (11:20 - 12:20) are derived by the sum of this section.
two third of ct for cycle (11:00 -12:00) and one third of ct
for cycle (12:00 -13:00). d0t is calculated similarly. A. Overall Results
To convey a basic understanding of how “Argus” works,
D. Event Localization we focus on the anomaly events detected by “Argus” from
20th July 2010 to 20th August 2010. Note that these anomaly
As each end-to-end performance measurement contributes events were detected by running “Argus” in fixed-length bin
to the summary time series of multiple user-groups (as shown mode with bin size as 3,600 seconds (1 hour) based on the
in Figure 2), a single underlying network failure such as a RTT measurements passively collected at the North-East CDN
link failure may manifest itself at multiple user-groups in the node.
spatial aggregation . For example, if an underlying network During this one-month period, “Argus” detected 2,909
event has caused an increase of RTT for most of end-users anomaly events across all user-groups in the hierarchy (Figure
associated with the same “BGP prefix A”, “Argus” by design 2). Table I shows the anomaly event distribution across all
should detect the RTT service anomaly event for the user- user-groups. In general, the lower level user-groups are re-
group “BGP prefix A”. Due to the nature of BGP routing, these sponsible for more anomaly events as they are much more than
end-users should share the same origin AS and AS path, and if the higher level user-groups. In addition, for each type of user-
these end-users from “BGP prefix A” dominate other end-users group, only a small fraction (bad user-groups) are responsible
associated the same origin AS or AS path, “Argus” would for the anomaly events and generally there is no heavy hitter
also detect RTT service anomaly events for the corresponding among the bad user-groups. According to Table I, the CDN
user-groups of origin AS and the AS path. In this case, it is nodes are extremely stable across the month, with no anoma-
desirable for “Argus” to localize the issue to the “BGP prefix lies detected at their user-groups. Anomaly events localized
A” and report a single service anomaly event. For another to “Origin AS”, “City”, “BGP prefix” and “City+BGP prefix”
example, if a router failure has caused a throughput service are most likely attributable to events outside the local ISP. In
anomaly event for all the end-users that are reached by the contrast, the anomalous events localized to “Egress Router”,
service provider via “AS path A”, all the children user-groups “Nexthop AS”, “AS path” are more likely to be attributable
of “AS path A” at the lower level in the hierarchy (as shown in to events within the local ISP (although they could still have
Figure 2) such as the BGP prefix user-groups would experience been caused within other ISPs).
the throughput service anomaly event as well. In this case, it is We now we focus on the time durations of the 2,909
desirable for “Argus” to localize the anomaly to the AS path. anomaly events. Our results clearly show that the majority
Due to space limitations, we present the formulation of event of the anomalies are very short in duration, whilst long-
localization problem, its complexity analysis and a heuristic lasting events are rare. Specifically, the events with duration
to solve the problem in our technique report [9] . 3,600 seconds are the most common and represent 90% of all
4# Total User- # Bad User-
User-group Type groups # Events groups [6] detects path outage among hosts using ping and localizes
CDN Node 1 0 0 the observed path outage using traceroute. PlanetSeer [11]
Egress Router 185 66 36 relies on active probes to diagnose the root cause of Internet
Nexthop AS 125 54 25
Origin AS 820 172 97 path failures that are detected by passive monitoring the end-
AS path 1055 213 119 users of a CDN service deployed on PlanetLab. Commercial
City 1758 593 289 systems such as Keynote [2] and Gomez [1] are also available
BGP prefix 4646 600 425
City+BGP prefix 8784 1211 851 to detect issues from the end-user’s perspective by active
probing. All these work employ active probing while “Argus”
TABLE I purely depends on passive monitoring.
A NOMALY EVENTS BREAKDOWN BY U SER - GROUP T YPE Passive approach purely depends the existing traffic. There
are two sub-categories: passive monitoring at end-user side
and passive monitoring at service provide side. A recent work
[5] based on passive monitoring at end-user side proposed
anomaly events. In addition, this statement holds true for every to push passive monitoring to the end systems themselves and
user-group type in the hierarchy (due to space limitations, we implemented such a prototype system based on BitTorrent. The
don’t discuss the details of per user-group type distribution effectiveness in [5] actually depends the sparsity of passive
here). measurements for individual end systems. An end system
As the final step towards understanding the overall results, with very few measurements would be able to detect event
we look into the details of the top 100 events, as defined using effectively. The deployment is another issue as there is no
the ranking function described in Section II-E. We spatially strong incentive for end systems to corporate. Different from
and temporally correlate the detected service events with the [5], “Argus” is based on passive monitoring at service provide
underlying network events from within the local ISP in a bid to side. It collects the end-to-end performance measurements
identify the root cause by using a system called G-RCA [10] . corresponding to individual end-users at service provider side.
Table II shows the root causes of the top 100 anomaly events, Unlike [5], the benefit with our approach is that it is easy to
as identified using our correlation analysis. 13 of the service deploy and see data from a wide range of users.
events are identified as caused by either events that happened
within the local ISP (e.g., link failures, link congestion and V. C ONCLUSION
CDN assignment change) or from events that are visible within Detecting and localizing user-perceived service events is
the local ISP (such as BGP routing changes announced by critical for service providers. We argue that the most effective
other ISPs). For the rest (majority) of them, we couldn’t find way to do that in an ISP managed service is to passively moni-
any evidence from inside the local ISP, which suggests that tor the end-to-end performance associated with end-users from
the service anomalies may be caused within other ISPs. inside the ISP network. In this paper, we presented the design
of “Argus”, a generic user-perceived service event detection
User-group Type Root Cause # events and localization system. We demonstrate the effectiveness of
CDN assignment change 1 “Argus” by applying it in a CDN service managed by a tier-1
Link Congestion 1
Egress Router ISP. Our experience with applying “Argus” in the CDN service
Link Failure 1
Outside the local ISP 2 has been very positive.
CDN assignment change 1
Nexthop AS
BGP routing change 1 R EFERENCES
Link Failure 1
[1] Gomez, inc. website. http://www.gomez.com/.
Outside the local ISP 1
[2] Keynote systems, inc. website. http://www.keynote.com/.
CDN assignment change 1 [3] P. Brockwell and R. Davis. Time series: theory and methods. Springer
Origin AS BGP routing change 2 Verlag, 2009.
Outside the local ISP 8 [4] J. Brutag. Aberrant behavior detection and control in time series for
BGP routing change 2 network monitoring. In Proceedings of the 14th Systems Administration
AS path
Outside the local ISP 13 Conference (LISA 2000).
City Outside the local ISP 21 [5] D. Choffnes, F. Bustamante, and Z. Ge. Crowdsourcing service-level
BGP routing change 2 network event monitoring. ACM SIGCOMM Computer Communication
BGP Prefix
Outside the local ISP 22 Review, 40(4):387–398, 2010.
City+BGP prefix Outside the local ISP 20 [6] N. Feamster, D. Andersen, H. Balakrishnan, and M. Kaashoek. Measur-
ing the effects of internet path faults on reactive routing. In Proceedings
TABLE II of the 2003 ACM SIGMETRICS, page 137. ACM, 2003.
T OP 100 ANOMALY EVENTS AND THEIR ROOT CAUSES BREAKDOWN BY [7] A. Gerber, J. Pang, O. Spatscheck, and S. Venkataraman. Speed testing
USER - GROUP TYPE without speed tests: estimating achievable download speed from passive
measurements. In Proceedings of the 10th annual conference on Internet
measurement, pages 424–430. ACM, 2010.
[8] V. Paxson. End-to-end routing behavior in the Internet. ACM SIGCOMM
Computer Communication Review, 36(5):56, 2006.
IV. R ELATED W ORK [9] H. Yan. Passively Monitoring Crowds to Detect and Isolate End-to-End
Performance Issues in Wide-Area Services. Technical Report 10-102,
There has been extensive prior work detecting and localizing Colorado State Univeristy, 2010.
[10] H. Yan, L. Breslau, Z. Ge, D. Massey, D. Pei, and J. Yates. G-rca: a
the end-to-end performance issues. Broadly speaking, they are generic root cause analysis platform for service quality management in
classified into two categories: active and passive. large ip networks. In Proceedings of the 6th International COnference,
Active approaches require the injection of probe packets into page 5. ACM, 2010.
[11] M. Zhang, C. Zhang, V. Pai, L. Peterson, and R. Wang. PlanetSeer: In-
the network. The pioneering active approach [8] traceroutes ternet path failure monitoring and characterization in wide-area services.
between 37 participating sites are collected and analyzed to In Proc. USENIX OSDI, 2004.
characterize the end-to-end performance issues. Similar to [8],
5You can also read