PTV VISUM 18 NEW FEATURES AT A GLANCE - PTV Group
←
→
Page content transcription
If your browser does not render page correctly, please read the page content below
PTV VISUM 18 NEW FEATURES AT A GLANCE
Copyright:
         © 2018 PTV AG, Karlsruhe
         PTV Visum® is a trademark of PTV AG
         All brand or product names in this documentation are trademarks or registered trademarks
         of the corresponding companies or organizations. All rights reserved.
         Disclaimer:

         The information contained in this document is subject to change without notice and should
         not be construed as a commitment on the part of the vendor.
         This document may not be used for any other purpose than the personal use of the
         purchaser.
         No part of this handbook may be reproduced, stored in a retrieval system, or transmitted, in
         any form, or by any means, electronic, mechanical, photocopying, recording, or otherwise,
         edited or translated, except as permitted under the terms of the copyright, without the prior
         written permission of PTV AG.
         Impressum:
         PTV AG
         Traffic Software
         Haid-und-Neu-Straße 15
         D - 76131 Karlsruhe
         Germany
         Phone. +49 721 9651-300
         Fax +49 721 9651-562
         E-Mail: info@vision.ptvgroup.com
         www.ptvgroup.com
         vision-traffic.ptvgroup.com

         © 2018 PTV AG, Karlsruhe

PTV Visum 18 - New features at a glance © PTV AG                                                     2
Contents

         1 Procedures & procedure sequence                         4
            1.1   Dynamic OD matrix estimation (DODME)             4
            1.2   Subnetwork generator for dynamic applications    5
            1.3   Daily signal plans in SBA                        5
            1.4   Headway offset optimization                      6
            1.5   Speed up of private transport assignments        7
            1.6   Variables in scenario management                 8
            1.7   Coupling across demand strata in EVA             9

         2 Graphics and handling                                   12
            2.1   Attribute selection                              12
            2.2   List of all attributes                           13
            2.3   Labeling objects in the network window           13
            2.4   Extended filter options                          14
            2.5   Extensions for formulas                          15
            2.6   Editing of line routes and time profiles         16
            2.7   Better options for customized network graphics   16

         3 Special evaluations                                     18
            3.1   Risk of delay                                    18
            3.2   Dynamic flow bundle for public transport         20

         4 Add-Ins, interfaces and COM-API                         23
            4.1   GTFS-Importer                                    23
            4.2   Python code completion                           23

         5 Technical changes                                       24
            5.1   Web-based online help                            24
            5.2   Python environment                               24
            5.3   Support for DirectX in 3D views                  25
            5.4   Language for text-based and database exports     25

PTV Visum 18 - New features at a glance © PTV AG                   3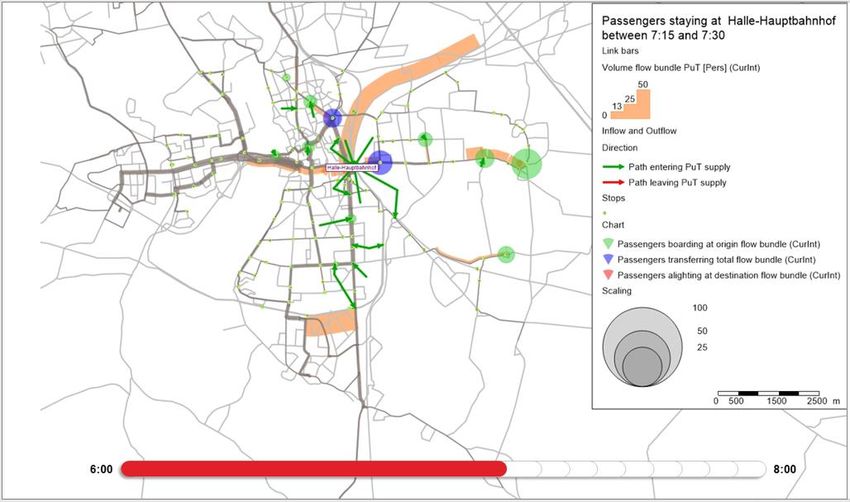
Procedures & procedure sequence

1        Procedures & procedure sequence

1.1      Dynamic OD matrix estimation (DODME)

         Medium-large scale dynamic assignments are becoming more popular, particularly following
         the release of the Simulation-Based Dynamic Assignment (SBA), and for such approaches
         it is useful to have a more realistic profiling of demand over time.
         The dynamic matrix estimation enables adjustment of a demand profile using counts. This
         can be the adjustment of an initial ‘flat’ profile (linearly distributed over time), or to update an
         existing profile using more recent counts.
         As well as count data, other time-interval-based input data can be used such as screenlines,
         and origin and destination traffic by zone. The relative accuracy of this data can be expressed
         using weights which are considered within the estimation procedure.
         The dynamic matrix estimation has been implemented as a variant of the ‘Least Squares’
         approach:

         Counts can be defined and selected for use in the procedure as a user-defined attribute with
         the subdimension ‘analysis time interval’.
         A standard time series of type ‘matrix time series’ is required as the demand input. The
         results of the estimation procedure can be written either to the matrix time series allocated
         to the demand segment, or a new ‘matrix time series’ can be used.

         The dynamic matrix estimation procedure can be used in combination with the simulation-
         based dynamic assignment (SBA). The assignment of the initial demand matrix is used as
         an input to the calculation of the flow matrix which too includes time dimensions based on

PTV Visum 18 - New features at a glance © PTV AG                                                           4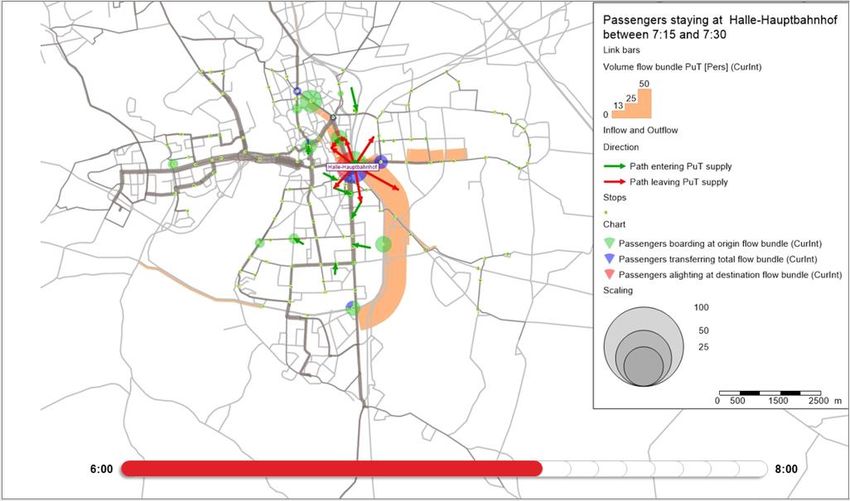
Procedures & procedure sequence

         the temporal definition of counts and the matrix time series. After matrix estimation, the
         demand is assigned again, and volumes are compared to the counts. If necessary, an
         iterative approach consisting of dynamic matrix estimation, SBA and a feedback loop based
         on a deviation criterion can be defined.

1.2      Subnetwork generator for dynamic applications

         The generation of subnetworks is an important step when investigating parts of the network
         in detail and exporting the network to Vissim. In models with dynamic assignments the
         generation of the subnetwork must consider when traffic enters and exits the subnetwork
         area.

         If the model includes results from dynamic assignment like SBA, the allocation of demand to
         time intervals is based on the entry time in the subnetwork and exit time, respectively, for
         demand that relates to arrival times.
         The use of ‘matrix time series’ is a pre-condition for the extraction of a temporal distribution
         of demand during the dynamic subnetwork generation procedure.

1.3      Daily signal plans in SBA

         Within the simulation-based dynamic assignment daily plans containing several signal
         programs can be taken into account. This is important in applications that span several hours
         of a day. Because of fluctuations and directional imbalances in demand over time signal

PTV Visum 18 - New features at a glance © PTV AG                                                       5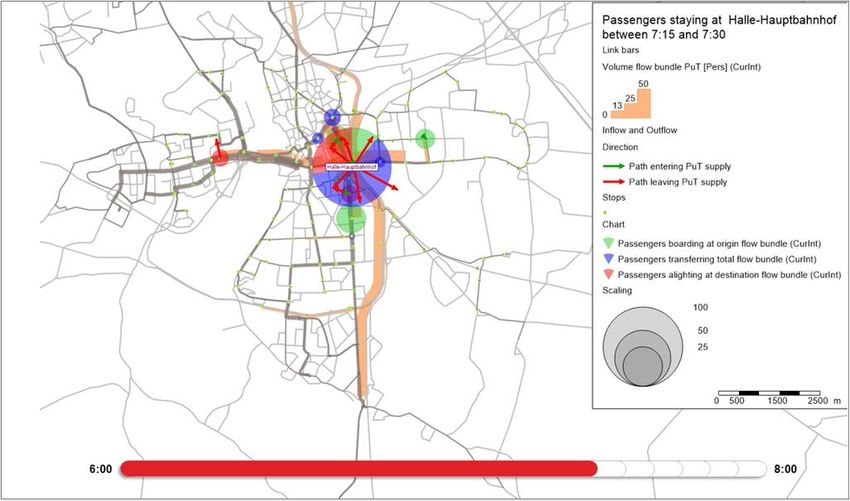
Procedures & procedure sequence

         programs change to better serve movements with higher flows. The signal programs must
         be defined in a Vissig file (.sig). For signalized nodes with an external Vissig control, the daily
         plans can be selected in the junction editor or in the list of signal controllers.

1.4      Headway offset optimization

         In planning processes, the PT supply is usually defined by the route course and the headway.
         To create a timetable and analyse connections, the departure time for each route has to be
         defined. The new ‘headway offset optimization’ procedure shifts the departure of journeys of
         one or more lines so that the transfer waiting time of passengers is globally minimized or
         approaches the optimal time per passenger. This procedure thus optimizes the public
         transport supply, more precisely the timetable, which was previously a task for the user to
         define.
         The headway offset optimization can be performed on a specific line or triggered as a
         procedure for multiple lines. The method distinguishes between ‘variable’ lines, i.e. whose
         vehicle journeys can be shifted, ‘relevant’ lines whose transfers are to be considered, and
         lines that are not considered in the procedure. The journeys of a ‘variable’ line are bulk shifted
         at the level of the line and direction.
         The objective function optimizes the product of transfer waiting time and passengers. This
         means that high demand connections will become even more attractive after optimization.
         The introduction of stop weights allows users to steer the optimization to less loaded transfer
         stops if required.
         To solve the optimization problem with a larger number of variable lines, a genetic algorithm
         is used that returns the best solutions. The result is a time shift of the journeys. These can
         be applied directly to the timetable or saved as a transfer file. If there are several equally
         good solutions, they can be saved in parallel.

PTV Visum 18 - New features at a glance © PTV AG                                                          6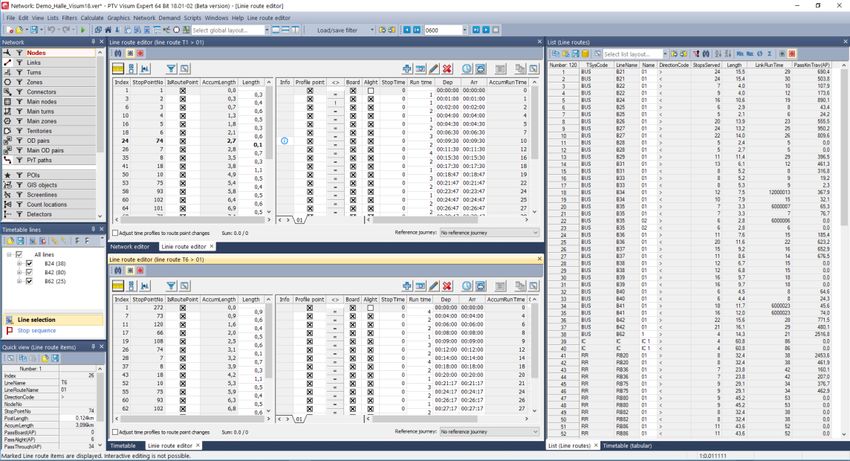
Procedures & procedure sequence

1.5      Speed up of private transport assignments

         Measures to speed up the most popular assignment methods have been undertaken based
         on the usage tracking data. In particular, the evaluation of volume-delay functions within the
         assignment has been accelerated. This is beneficial for the classical equilibrium assignment
         and Bi-conjugate Frank-Wolfe (BFW). Furthermore, in the classical equilibrium the shortest
         path search has been multithreaded. Overall run time savings can vary depending on the
         network. For BFW a 10-30% speedup can be expected, and more than 50% can be achieved
         for the classical equilibrium. The following graph is based on 20 iterations using the classical
         equilibrium.

PTV Visum 18 - New features at a glance © PTV AG                                                       7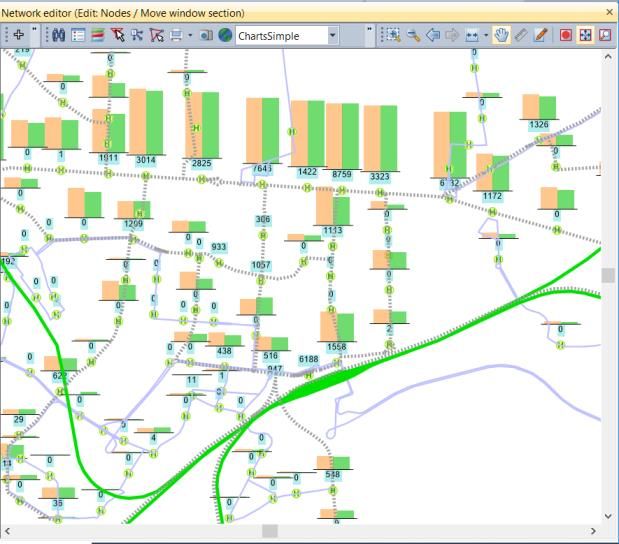
Procedures & procedure sequence

1.6      Variables in scenario management

         Variables have been introduced as part of the procedure parameters. They allow parameter
         values to be set outside the procedure sequence, and in particular also within scenario
         management where variations of parameter values are a frequent use case.
         This is particularly useful for varying parameters over a value range, and for procedures such
         as SBA that use random seeds which creates the need to run them multiple times using
         different seeds to produce statistically sound results.
         As well as typical properties such as attribute or data type the definition of variables also
         includes the option to reference a procedure whose parameter the variable represents. In
         the following example the variable refers to the coefficient of the perceived journey times of
         the impedance definition in the Public Transport assignment. This coefficient for example
         expresses the value of time of a demand segment.

         If future scenarios are calculated within a scenario management project and the VoT is
         subject to uncertainty, then there is now support within the interface to duplicate scenarios
         with the value of the variable varied. The values can be edited later in the scenario grid.
         When calculating scenarios, the coefficient of the perceived journey time is replaced by the
         value of the variable. The ‘result’ version files contain this variable and the corresponding
         value too.

PTV Visum 18 - New features at a glance © PTV AG                                                     8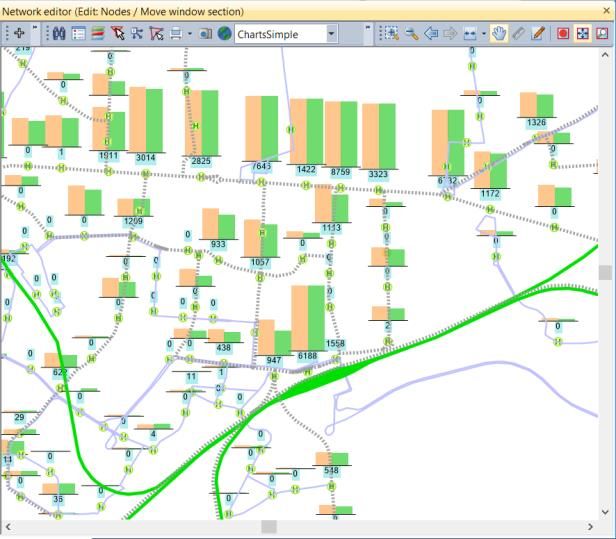
Procedures & procedure sequence

         Variables can also be used as formulas. To do so, two new functions have been added which
         can be used to access the numerical value or the string of the variable.

1.7      Coupling across demand strata in EVA

         Until now, EVA demand models carry out origin- and destination-bound binding (hard origin
         and destination constraints) for each demand strata separately. Now, the binding can be
         coupled among all demand strata of an activity pair.
         This could be interesting, if demand strata sharing the same activity pair have different mode
         shares. Imagine two Home-Work demand strata „HW-wC“ (employees with car availability)
         and „HW-nC“ (employees without car availability). Destinations which are well accessible by

PTV Visum 18 - New features at a glance © PTV AG                                                     9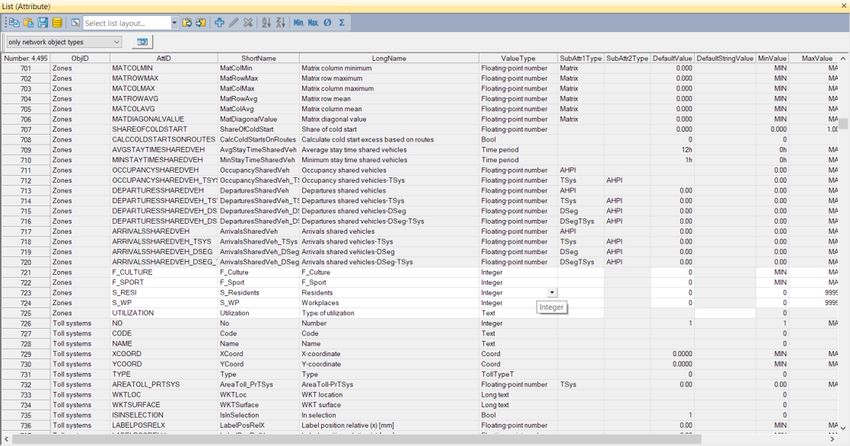
Procedures & procedure sequence

         public transport („Work A“) are mainly approached by members of „HW-nC“, while
         destinations which are well accessible by car („Work B“) are mainly approached by members
         of „HW-wC“.

         This behaviour changes when hard constraints (origin- and destination-bound binding) are
         used. Using the conventional approach (coupling for each demand strata separately) means
         that all destinations are approached equally by all demand strata, what seems to be
         unrealistic.

         Here, coupling across demand strata leads to much better results: the constraints are relaxed so
         that the reference values (e.g. destination counts) must be matched for each activity pair rather
         than for each demand strata. For the following figure, the destination-bound binding (hard
         destination constraints) has been coupled across the two demand strata. As a result, the
         destinations are approached accordingly to their public transport accessibility while destination
         counts are met.

PTV Visum 18 - New features at a glance © PTV AG                                                       10
Procedures & procedure sequence
The coupling option can be activated within the demand dialogue on the tab “Activity pairs”.
PTV Visum 18 - New features at a glance © PTV AG 11Graphics and handling
2 Graphics and handling
2.1 Attribute selection
The attribute selection dialogs were revised to make the selection easier and faster. Instead
of working top-down the workflow is now left to right. The attribute is selected to the left,
added and its layout settings for the format of the table column can be set comfortable to the
right. To make the dialog even simpler the layout grid can be collapsed.
In addition, it is now possible to search the attribute selection tree. Every direct attribute and
relation which contains the entered string is displayed. Further the marked attribute is
described in the lower left window. As before one can navigate through the attribute tree by
using arrow keys, select the displayed analysis time intervals and change the type of order.
New user defined attributes can be created directly from this dialog if necessary.
The selection of single attributes in other dialogs (e.g. graphic parameters dialog) have been
revised and extended by the search functionalities as well.
PTV Visum 18 - New features at a glance © PTV AG 12Graphics and handling
2.2 List of all attributes
A new special list documents all attributes and their properties such as data type or
description which are available in the data model of the current version file. The list view can
be restricted to network object attributes or user-defined attributes only. User-defined
attributes can be added, cloned and deleted directly from the list and their properties can be
edited there. Thereby, the list replaces the former dialog used for managing user-defined
attributes.
2.3 Labeling objects in the network window
The functionality and user-interfaces for labelling objects in the network window have been
reworked. Object labels are configured using the display of tables in the network window.
These tables can consist of an arbitrary number of rows displaying static texts or attribute
values. The arrangement and styling are configured through a new user interface.
PTV Visum 18 - New features at a glance © PTV AG 13Graphics and handling
The labelling tables can be freely positioned in the network window by dragging them with
the mouse.
2.4 Extended filter options
Easier access to filters
The existing functionality for loading and saving filter files has been extended by the
possibility to load and save filters directly from the filter dialogs of the individual network
object types.
The filters loaded or saved through these dialogs refer to the respective network object type
only. Filter settings of other network objects are neither altered nor saved in the filter file.
Column Filters
List items can be limited by global filters or in some lists due to special local filters. Now,
additionally column filters restrict the displayed elements of a list. Conditions for column filters
can be defined for one or more attributes. The filtering follows an AND operation of all column
filters and local filters, as well as optionally via the global filters (set active elements).
The column filters are accessed by clicking on the right side of the column header. The
selection of the operation and condition follows the format of the corresponding attribute.
Filtered columns are indicated by a corresponding icon and a function in the list toolbar
initializes all column filters.
PTV Visum 18 - New features at a glance © PTV AG 14Graphics and handling
2.5 Extensions for formulas
Formulas are a powerful instrument to extent evaluations available in Visum and adjust them
according to requirements of your project. New functionality includes relations with condition
and matrix scalars.
Conditional relationships can be applied in formulas of objects that point to multiple objects
of another network object. The evaluation of such formula can be restricted by an additional
condition without explicitly using a filter. For example, you can calculate the volume of all
straight movements at nodes. There are many new options in path lists, in which you can
display attributes containing the shares of different transport systems of each path. The
following screenshot shows a PuT path list, which show the shares in ride distance of bus
and tram, respectively, and the index of the path leg, where Tram has been used for the first
time with the corresponding departure time.
For calculating matrix scalars, a new button is available in the formula editor, offering various
functions such as average, sum, minimum, maximum of a matrix, matrix row sums or matrix
column sums. The result can optionally be restricted to active relations. For example, it allows
an average travel distance or travel time to be calculated from demand matrices and the
corresponding skim matrices. The single value of the matrix scalar can be stored as variable
or network attribute.
PTV Visum 18 - New features at a glance © PTV AG 15Graphics and handling
2.6 Editing of line routes and time profiles
The dialog for editing line routes and time profiles has been replaced by a non-modal view.
Multiple of these windows can be opened alongside, facilitating comparison and adjustment
of data among different line routes.
2.7 Better options for customized network graphics
Some new options allow a more precise control of the information displayed in the network
view. This helps to highlight the most relevant spots in model outputs.
PTV Visum 18 - New features at a glance © PTV AG 16Graphics and handling
The first of these options controls the priority in which objects and corresponding items like
charts are drawn when then the option ‘Avoid overlapping’ is selected. Without the new
option, objects were drawn in the order of their key values, sometimes causing the most
important objects not to be drawn at all due to overlaps. Now the drawing order can be
controlled by an arbitrary attribute, ensuring relevant objects are actually shown on the map.
Default drawing order Drawing order by number of transfers
A second new option allows to control the absolute number of objects of a type being drawn
within the network window view. This allows to easily highlight data such as ‘the 10 stops
with the highest number of transfers’.
PTV Visum 18 - New features at a glance © PTV AG 17Special evaluations
3 Special evaluations
3.1 Risk of delay
Using the risk of delay analysis for public transport, it is possible to investigate effects on
passenger travel times and the share of passengers reaching their destination with a relevant
delay. This feature is the first to make it possible to put the passenger at the heart of the
evaluation of a public transport supply.
To run the analysis, ‘on time probabilities’ for investigated parts of vehicle journeys and ‘time
distributions of delays’ are needed. In addition, maximal wait times from connecting vehicle
journeys or probabilities of reaching a connection can be considered in the analysis. This
additional feature allows to involve dependencies between vehicle journies and makes it
possible to code a more realistic picture.
The required input data can be obtained from an ITC system or from a simulation (e.g. PTV
Vissim or rail operation simulation tools). Whether to use historical data or simulated data
depends on the use case (e.g. whether or not the public transport supply already exists).
The following screenshot shows the parameter dialog for the timetable-based assignment
where the most important input parameters for the ‘risk of delay’ analysis can be set. These
include the ‘probability of punctuality’ and ‘distribution of delayed vehicle journey items’.
PTV Visum 18 - New features at a glance © PTV AG 18Special evaluations
The attribute values for the user-defined attribute ‘OnTimeProbability’ can be handled directly
through the corresponding list of vehicle journey items.
PTV Visum 18 - New features at a glance © PTV AG 19Special evaluations
In addition, it is possible to insert planned connections to model that one connecting vehicle
journey is waiting for a previous one.
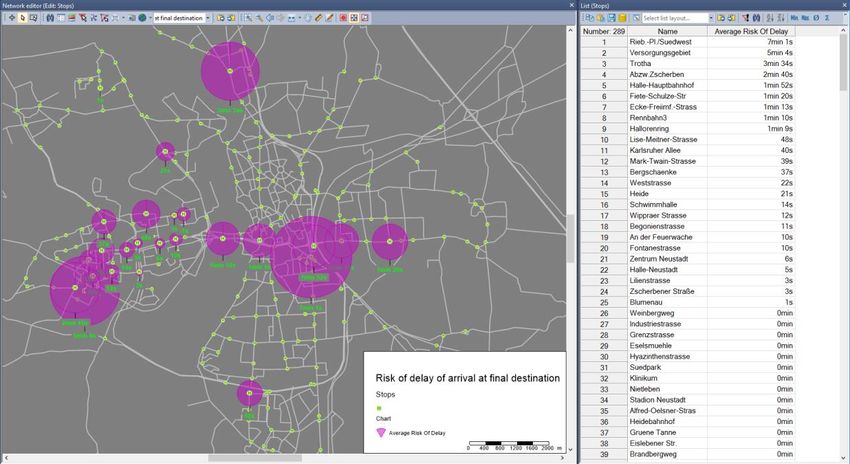
It is then possible to create visualisations, e.g. display the stops with the highest risk of delay
at the destination in average over all trips.
3.2 Dynamic flow bundle for public transport
The additional feature ‘dynamic flow bundle for public transport’ enables the user to analyse
the behaviour of passengers who travel through a specified network object in a set time
PTV Visum 18 - New features at a glance © PTV AG 20Special evaluations
interval and to analyse the flow bundle through every defined analysis interval. This feature
makes it possible to follow travel movements of all passengers who travel at the same time
interval i.e. through a stop.
The example below analyses the stop Halle Central station which is the stop with the largest
number of passengers transferring. The dynamic flow bundle helps to analyse the peak time
period from 7:15 to 7:30. During this time the station is most crowded. The following pictures
of the network represent snapshots of some analysis time intervals which are available for
five-minute intervals of the morning peak.
PTV Visum 18 - New features at a glance © PTV AG 21Special evaluations PTV Visum 18 - New features at a glance © PTV AG 22
Add-Ins, interfaces and COM-API

4        Add-Ins, interfaces and COM-API

4.1      GTFS-Importer

         The Add-in for importing Public Transport networks from the General Transit Feed (GTFS)
         format has been replaced by an ‘integrated’ import functionality. Besides being faster, this
         new functionality also processes the geographic line courses which may be provided in the
         optional shape.txt files. This information allows a more precise mapping of the public
         transport lines to a road network and generates more realistic length information. The line
         courses are processed into link-node-sequences. As the courses are often provided in very
         high geographic detail, dispensable nodes can optionally be dropped during the import. Time
         profiles and line routes are automatically aggregated from the individual vehicle journeys in
         the source data.

4.2      Python code completion

         The Python Console Add-In has been improved to provide extensive code completion. Now
         all PTV Visum com objects with their methods and properties are contained in the code
         completion drop-downs, and even the available attributes are listed when functions like
         AttValue are used.

PTV Visum 18 - New features at a glance © PTV AG                                                   23
Technical changes
5 Technical changes
5.1 Web-based online help
The online help is now provided as a web-based help system instead of the locally installed
CHM files. Help pages accessed from dialogs etc. by pressing F1 are opened in the default
web browser. This allows to use bookmarks etc. to refer to help topics and to make use of
more modern layouts and search functionalities. For using this help, an internet connection
is required. The PDF manuals are still installed locally and are thus available for offline
reference.
5.2 Python environment
The Python engine installed with PTV Visum has been updated to the latest release Python
2.7.15 of the 2.x series. This now allows to use the PiP management tool for installing
additional python libraries without additional steps.
As this update replaces the Python 2.7.3 engine used by previous versions of PTV Visum,
the Python-related functionalities of these releases are affected by this change. If you are
using PTV Visum 15, 16 or 17, please update to the latest service pack which solve these
issues. For older versions of PTV Visum, please manually delete the files
python27.dll
pythoncom27.dll
pythoncomloader27.dll
pywintypes27.dll
from the PTV Visum installation folder (e.g. C:\Programs Files\PTV Vision\PTV Visum
14\exe).
PTV Visum 18 - New features at a glance © PTV AG 24Technical changes
5.3 Support for DirectX in 3D views
It is now possible to use DirectX as an alternative graphics engine for 3D views. This may
also help to use 3D views in Remote desktop environments. Furthermore, the anti-aliasing
is now available for 3D views in order to produce smother graphics.
5.4 Language for text-based and database exports
Starting with PTV Visum 18, all text-based file exports and exports to databases, e.g. *.net-
file export, attribute files, model transfer files etc. will by default contain English table- and
column names. So far, these files where produced according to the language setting of the
user interface if the language was German, French, Italian or Polish. If required, the old
behavior can be restored in the user preferences.
PTV Visum 18 - New features at a glance © PTV AG 25PTV AG Haid-und-Neu-Straße 15 76131 Karlsruhe Germany Phone +49 (0) 721 9651-300 Fax +49 (0) 721 9651-562 E-Mail: info@vision.ptvgroup.com www.ptvgroup.com vision-traffic.ptvgroup.com
You can also read