Early Prediction of a Game Outcome in StarCraft 2
←
→
Page content transcription
If your browser does not render page correctly, please read the page content below
Early Prediction of a Game Outcome in StarCraft 2

                          David Leblanc and Sushil Louis
                   Department of Computer Science and Engineering
                             University of Nevada Reno
                                  Reno, NV 89557

                       Abstract                              anced, and provides a very high skill complexity limit
      The goal of this paper is to predict the outcome       for players. Players are continually trying to find flaws
of a StarCraft 2 game based on information contained         in their play to improve their overall skill.
in a replay. We explore the problem of early game out-
come prediction and the reasons for the determination.
Understanding these factors may not only improves
player performance, but also help game designers bal-
ance the game. Features are extracted from replays of
previously played games, and are used to train a sys-
tem that determines a winner. Each feature represents
a snapshot of game at a specific time and encodes in-
formation about the state of the game at a particular
time. Results show that it is very challenging to pre-
dict a winner early on, but it is possible to find tipping
points in a game. The tipping points determine which
player is ahead in particular segments of a game and
give additional insight on the actions that produced
the outcome.
                                                             Figure 1: Starcraft 2. Two players in a battle in a 1v1,
                                                             Terran versus Protoss match
1    Introduction

     Starcraft 2 is a real-strategy game or RTS, which             Because of the complexity of the game, the rea-
allows players to choose from three types of races: Ter-     sons why a player wins a game is often misunderstood
ran, Protoss, and Zerg. Each race has different char-        by spectators and casual players. In many cases, the
acteristics, strengths, and weaknesses that make the         outcome of a game can be predicted earlier than what
game highly dynamic and non-linear. The objective of         most players realize. If it is possible to determine the
the game is to gather resources, build structures, train     winner of a game early on, then there are many poten-
armies, and attempt to destroy the opponent. Each            tial applications that may benefit from this knowledge.
race have different structures and unit types which          Game balance designers are responsible for assuring
have varying purposes. For example, the Protoss favor        that the game remains challenging and highly depen-
stronger, slower, and more expensive units while Zergs       dent on a player’s skill. Understanding the flow of a
produces faster, weaker, and large quantities of armies.     game, and the reasons for the outcome of a game could
Terrans are a balance between Zergs and Protoss.             be valuable information for game balance designers.
     Generally, in tournaments, players face one an-         For a game to be interesting and challenging, there
other in a “one versus one” (1v1) format. Over the           should be many possible ways to reach an outcome.
years, professional tournaments have attracted large         Early prediction of a winner also helps players improve
crowds of players and spectators. What started the           their overall play. By knowing when the outcome of
excitement for Starcraft 2 was the successful franchise      a game was predicted, the player could then look at
Starcraft Brood War. Now, some of the best players in        that specific time and determine what at that time in-
the world have become professional and attend tour-          fluenced the outcome. From that, a player can then
naments regularly. The reasons for the success of this       adjust their play to learn from mistakes, and qualify
game are mainly because it is well designed and bal-         good play.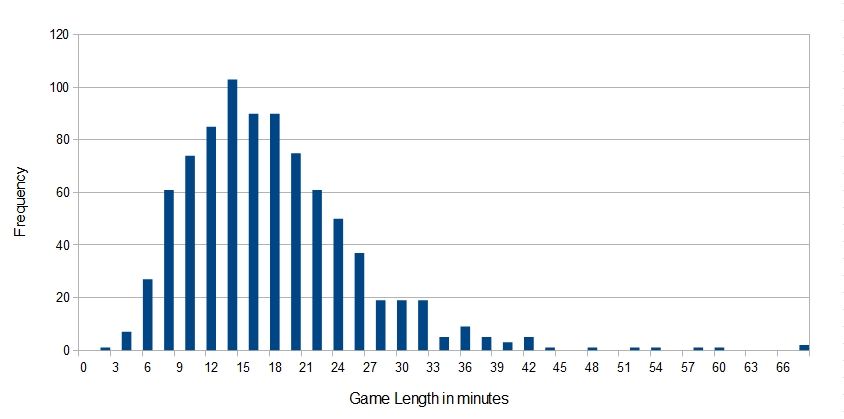
1.1   The problem                                          and genetic programming. They use features from the
                                                           football teams themselves such as ranks and scores. In
      The main goal of this paper is ultimately to pre-    a similar work, [4] used time-series history with Multi-
dict the winner of a game as early and accurately          Layer Perceptron learning to predict the winner of a
as possible, and understand what causes a player to        tennis match.
win or lose a game. Identifying tipping points in                Much of the work presented has been done on the
games would help grow the overall understanding of         first StarCraft franchise, but little work has been done
the game. Games can vary widely from one to an-            on the latest edition of StarCraft. The main reason is
other, but they generally have tipping points where        because StarCraft 2 is a relatively recent game (since
one player either takes to lead or falls behind. These     2010). The work presented in this paper is an initial
tipping points can give an indication of what a spe-       exploration of the game and its strategies.
cific player did right, or did wrong. Tipping points can
range from subtle to obvious. Obvious tipping points       1.3    Approach
are easily identified and explained by most players. On
the other hand, subtle tipping points can be very dif-          Replays of previously played professional tourna-
ficult to identify by an average casual player. They       ments are collected and features are extracted which
often happen earlier in a game and usually play a role     are then used to trained a system that predicts the
in the final outcome of the game.                          outcomes of games. The system learn what produces
      A secondary goal is to identify these minor and      a given outcome, and provides a qualitative measure
major tipping points, and characterize them to under-      of which player is ahead or behind. In section 2, the
stand the factors that contributed to the outcome of       overall methodology for answering these questions is
a game. To characterize a tipping point, a probability     presented. Section 2.1 describes the data and fea-
measure of outcome must be calculated for any point        ture extraction further. Features used are unit counts,
in a game. The probability can be measured by train-       buildings, player actions, and other. This information
ing a system to predict the outcome of a game based        is then represented as a feature vector of histograms
on a snapshot of the game at some time in the game.        for any time t in a game. Each feature vector then
The snapshots are a set of features that have been ex-     represents a snapshot of the game at a specific time.
tracted from the game (such as structure count, unit       Section 2.2 explains in detail how the features are ex-
count, actions, etc) and represent the overall state of    tracted and represented.
the game at that point.
                                                                Based on the features, the system is trained to
                                                           determine the outcome and to evaluate the probability
1.2   Previous work                                        of outcome. This is discussed in depth in section 2.4.
                                                                Section 3 presents the results based on the
     There has been much previous work done on Star-
                                                           methodology and the experiments conducted which
craft related application. Most of the focus in RTS
                                                           are described in 3.1. Examples of game outcomes are
game research is on the study of artificial intelligence
                                                           shown in this section and a discussion of the results is
to design opponents. An example of this is [8] where
                                                           proposed in 3.2.
the focus of the work tried to design an agent able to
                                                                Finally, section 4 summarizes the paper and offers
respond to unforeseen events and developed a reactive
                                                           solutions for further work.
goal-driver autonomous agent.
     Another StarCraft related work, [6] explores the
concept of map creation and design. They use evolu-
tionary search to generate maps which maximize the         2     Problem Data and Methodology
entertainment factor based on player feedback. The
application of this work is mainly to assist map de-            Starcraft 2 replays are gathered from professional
signers in the map creation process.                       tournaments which have been played in the last two
     In an interesting approach, [5] used a Bayesian       years. Replays were taken from replay packs of tourna-
model to predict the opening strategy for a player.        ments such as MLG (Major League Gaming), IEM (In-
The predictions are done specifically for the opening      tel Extreme Master’s), Dreamhack, and other sources.
of the game and are learned using replays labeled with     The replays provided by those sources are a good
a specific opening strategy type.                          source of data because the level of play is at the high-
     For specifically predicting the outcome of games,     est level of competition. Professional players have a
there has been some work in the area of professional       deep understanding of the game and are much more
sports. [7] present a method to predict the outcome of     consistent in their level of play then casual players.
football games based on fuzzy rules, neural networks       Therefore, the data collected can be assumed to be
slightly less noisy and optimized for outcome predic- EventType: The type of event or action the player
tion. performed (ie: Train, or Build, Research, etc...)
2.1 Data Set EventDetails: The details associated with that type
of actions, such as the unit type, target location,
The data set collected from the tournaments in- assignment, etc...
cludes over 9000 replays, which contain all possible The Frame is converted to seconds to have a more
match-ups. Since there are three races, there are six meaningful representation of time. Player determines
possible match-ups: which player performed the action, allowing the events
• Zerg versus Terran (ZvT) to be separated for each individual player. The Event-
Type determines the action taken by the player. For
• Zerg versus Protoss (ZvP) the purpose of this application, the replay files are
parsed and the events are split into five event cate-
• Terran vs Protoss (TvP) gory types:
• Zerg versus Zerg (ZvZ) 1. Build Event: Player builds a structure (ie: Bar-
racks, Factory, etc...)
• Protoss versus Protoss (PvP)
2. Train Event: Player trains a new unit (ie: Marine,
• Terran versus Terran (TvT)
SCV, etc...)
For this paper, we focused out method mainly on TvT
3. Research Event: Player researches an upgrade (ie:
match-ups. There are a few main reasons why we fo-
Stim, Combat Shield, etc...)
cused on TvT. First of all, Terran build mechanics are
the simplest of all races. When a unit begins con- 4. Ability Event: Player uses an ability (ie: Cloak,
struction, it is completed a fixed amount of time later. Call Down MULE, etc...)
Generally speaking, buildings can only produce units
one at a time. All these facts ensure that features are 5. General Actions: Contains all mouse-click, hot-
more easily and accurately extracted from replays for key, control groups, camera movements, and other
terrans. Finally, since TvT is a mirror match-up, fea- events.
tures extracted are the same for both players and can Finally, the EventDetails contains extra specific infor-
be directly compared side-by-side. mation associated with the event, which is currently
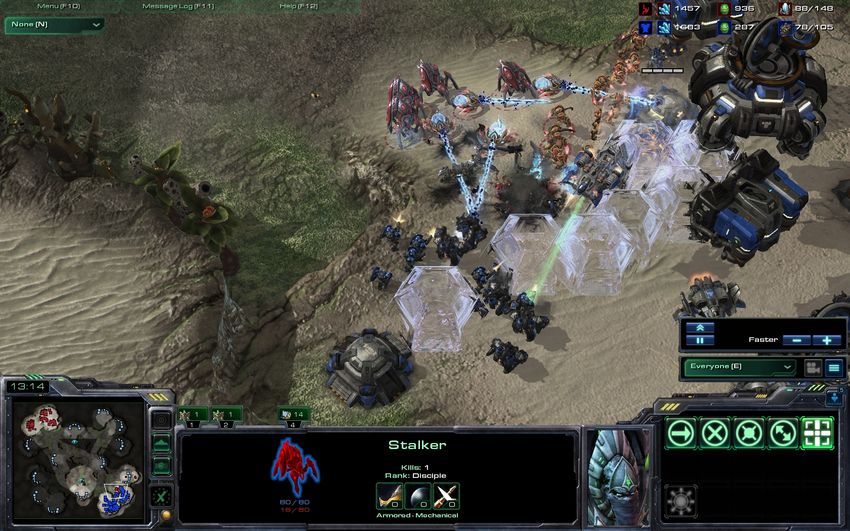
There is a total of 853 TvT replays in the data set ignored for the most part. The sequences of events
constructed. Figure 2 shows the game time distribu- parsed from the file and kept separate for each play-
tion of TvT games in the data set. Most games range ers.
10 to 20 minutes but certain games can be as short as Once parsed, the events are sorted by time and
4 minutes, and as long as 70 minutes. It also includes organized in a table, called a build order table (BOT).
a large variety of different strategies. In the past two BOTs are built for each player by sequentially insert-
years, the overall game strategies have evolved as play- ing build, train, and research events, and keeping track
ers optimized the way to play the game. There have of time to complete the events. When an event is pro-
also been many balance changes in the game itself, cessed, it is first added to the table, the production
which has impacted the strategy of the game. count for that event is incremented, then the BOT
is updated. The update process goes down the ta-
2.2 Feature Extraction ble, looking at production and time, and calculates
the amount of time passed since production started.
Replay files contain information of the game If the amount of time passed is greater or equal than
played and the list of events performed by each player. the time required to build that specific unit, then the
The information can be exported to a text file using unit count is incremented for that type, meaning a
the SC2Gears software [1]. The output text file format unit has completed production. The update process is
for an event is as follows: done for each unit type at each event. After all events
Frame Player EventType EventDetails have been registered and processed, the BOT for each
Frame: The timestamps associated with the event. player contain the unit, building count, and research
It can be converted into seconds. progress for each unit type, at any point in the game.
Features can then be extracted from the BOTs
Player: The name of the player performing the ac- at any time t in a game. These features will essen-
tion. tially be a snapshot of the unit count at that time t.Figure 2: Time distribution of Terran versus Terran games in the constructed data set.
The features also contain the count of ability events, both players can be represented as a single vector of
and general player actions per minute (APM) measure. 75 attributes using either the difference between each
APM is the number of actions performed by the player attribute.
over time. The APM measure is split into two main For any feature extracted at time t, two vectors
types: micro and macro. Micro APM counts the abili- can be produced. For option 1, two single single player
ties and mouse-click events, while macro events consist vectors are recovered at each t. For option 2, the two
of building, training, and researching events. vectors can either be {player1, player2} or the inverse
Finally, the winner of a game can be identified by {player2, player1}. Similarly, for the Difference be-
determining which player leaves the game first. A win tween the players, it can either be {player1 - player2}
is encoded with a 1, and a loss is encoded with a 0. or {player2 - player1}. Beyond the representation, it
can be further split into two types of snapshots used
2.3 Feature Representation for classification: Basic and Temporal.
Once all the features have been extracted from Basic Features
the replay, they are represented as a vector of at-
tributes. Each vector is a snapshot of the game at Basic features are simply the vectors described above
time t for a player. For a single Terran player, 75 taken at specific snapshots at time t of the game. The
different attributes can be extracted from the events. length of the vectors for a single player is 75, as men-
For Protoss and Zerg, the unit, building, and research tioned above.
count are different, therefore would result in a vector
of different length. The distribution of the attributes Temporal Features
is displayed in table 1.
Temporal features contain the basic features, the mean
The vectors encode all the available information
and variance of the previous snapshots. A window of
available for a single player at time t. The are three
time is taken from time t and k snapshots are extracted
main options for representing features extracted:
from that window. The mean and variance of each
1. Single Player attributes over time are calculated and added to the
feature vector. This essentially adds two features per
2. Both Players attribute, resulting in a feature vector with a length
3. Difference of Players. of 225 (75+75+75) for Terrans. This representation
increases the amount of information encoded about
The first option accounts only for features from a single change over time in the attributes.
player and results in a vector of 75 attributes (for Ter-
ran). The second option concatenates the vectors of 2.4 Feature Evaluation
the first option for both players, which results in a vec-
tor of length 150. Because we are dealing with a mir- The outcome of the game is determined by which
ror match-up (TvT), attributes are the same for both ever player is the first to concede. An important as-
players, and can be compared side-by-side. Therefore, sumption is made which is that the outcome of theUnit Histogram Building Histogram Research Histogram APM Total Outcome
13 unit types 17 building types 37 upgrade types 8 types 75 Win (1), Lose (0)
Table 1: Feature vector representation and distribution of attributes. APM 8 attributes: Abilities, Actions, Build,
Train, Research, Micro, Macro, and Overall APM.
game determines the outcome for all features extracted for training, and the remaining 30% is reserved for
during the game. This is a strong assumption because testing. The overall accuracy of predictions of various
it could be incorrect. Because of the nature of Star- classifiers (using WEKA) are presented in table 2.
craft 2, a player could be at a disadvantage at some Since the goal of the project is to determine when
time t, but overcome his opponent later in the game. the outcome of the game can be accurately determined.
Players can make brilliant decisions that lead to vic- Table 3 presents the results of the outcome prediction.
tory later on, or make disastrous mistakes which lead The columns represent the percentage of correct pre-
to defeat. There is no guarantee that the outcome of diction of snapshot beyond a time t. The numbers
a given feature vector accurately represents that fea- inside the table represent at which percentage of the
ture. Despite this fact, our assumption is that the game the prediction accuracy of the snapshots was
trained classifier can learn from these scenarios, and reached. The last row is the number of games that
learn whether a given snapshot is likely to result in a were successfully predicted with the given certainty.
win or a loss.
3.2 Discussion
2.5 Outcome Prediction
From the results presented in table 2 and table
The features and their associated outcomes are 3, We can clearly see that StarCraft 2 outcome pre-
used to trained a system which predicts the outcome diction is a challenging problem. In table 3, we can
of a give snapshot. Because the outcomes are either see that for 86.0% of the games in the test set, we
a win, or a loss, the prediction can be done using a could on average predict over 50% of the snapshots af-
classifier. A multitude of classifiers have been used to ter the first 8.9% of a game. Another interesting result
predict the outcomes. We used the WEKA toolkit [3] from the table is that the earliest we were able to pre-
to evaluate the prediction accuracy of multiple differ- dict 100% of snapshots was after 66.7% of a particular
ent systems. The results are shown in section 3. game. In order words, the winning player dominated
As mentioned in 2.3, since there are two play- the last third of the game. On average, we are only
ers, two sets of features can be extracted at any time able to predict with 100% accuracy the final 4.9% of a
t. Because one player must win, and the other lose, game. This is a clear indication that in many cases it
this should hold true for the prediction as well. This is difficult to accurately predict the winner of a game
constraint can be used to further improve the over- early on due to the variations in strategies.
all accuracy of the system. By comparing the out- Although the accuracy appears low for the clas-
come predicted by one player versus the outcome of sification, the outcome predicted in many cases is cor-
the other, we can determine a confidence measure for rect. It appears that in many cases, there are moments
the prediction. where winning player falls behind. Example prediction
For determining the confidence measure, we used graphs are show in Figure 3. This Figure shows how
Gradient Boosted Trees [2]. This classifier can do both dynamic games can be and there are multiple stages
classification and regression which allows the predicted of transition in most games.
outcome to have a confidence associated with it.
4 Conclusions and Future Work
3 Results
Prediction of outcome of a Starcraft 2 game is
3.1 Experimental Setup very challenging, as it should be. The replay data set
used was taken from professional level tournaments,
Feature snapshots are extracted from all the re- therefore the quality of players and strategies are opti-
plays at 30 second increments. The first three min- mized, resulting in closer games and less flawed overall
utes of all games is ignored since generally very little performance. At that level of play, one would expect
happens in the first three minutes of a game. Of the accurate prediction of outcome a difficult task.
853 TvT replays, 70% of features extracted are used The information extracted from the replay dataBasic Features Temporal Features
Classifiers
Single Both Diff Single Both Diff
Random Forest 51.9% 58.1% 57.6% 54.0% 58.7% 61.5%
AdaBoost (Stumps) 52.1% 54.2% 59.0% 53.9% 56.4% 62.2%
AdaBoost (Random Trees) 50.6% 54.0% 56.4% 52.7% 56.1% 55.5%
Naive Bayes 51.4% 53.1% 59.9% 52.6% 55.7% 63.6%
Table 2: Results of overall outcome prediction of different classifiers in WEKA, and different feature representation
method
Time Percentage 50% 60% 70% 80% 90% 100%
Mean 8.9% 13.7% 20.0% 26.4% 34.5% 95.1%
Median 0% 0% 0% 16.0% 33.6% 96.0%
Stdev 20.3% 24.1% 26.8% 29.7% 30.4% 3.6%
Earliest 0% 0% 0% 0% 0% 66.7%
Latest 97.1% 97.1% 97.1% 97.1% 97.1% 99.0%
Games Predicted 86.0% 85.3% 82.2% 79.8% 79.1% 78.3%
Table 3: Prediction Time table.
set is incomplete, lacking units lost and income in- Update; SIGKDD Explorations, Volume 11, Issue
formation. It is also impossible to flawlessly extract 1.
the accurate count of units and buildings due to many
factors which are handled by the game engine itself. [4] A. Somboonphokkaphan, S. Phimoltares, and C.
Despite this lack, valuable results have been extracted Lursinsap, Tennis Winner Prediction based on
from this data, proving that the game is very well bal- Time-Series History with Neural Modeling.
anced and designed. [5] G. Synnaeve and P. Bessiere, A Bayesian Model
Future work for this project would be to improve for Opening Prediction in RTS Games, with Ap-
feature representation to maximize classification ac- plication to StarCraft, Computational Intelligence
curacy while minimizing over-fitting. Also, this pa- and Games, 2011
per focused mainly on TvT, other match-ups could be
considered, and similar methods applied to them with [6] J. Togelius, M. Preuss, N. Beume, S. Wessing, J.
success. The main short-coming of the method was the Hagelback, G. N. Yannakakis, Multiobjective Ex-
data extraction from replays. This short-coming could ploration of the StarCraft Map Space, IEEE Con-
be avoided by extracting features from a live game, in ference on Computational Intelligence and Games,
real-time, and possibly extract the missing informa- 2010
tion such as units lost, income, and other pertinent
[7] A. Tsakonas, G. Dounias, S. Shtovba, and V.
statistical values.
Vivdyuk, Soft Computing-Based Result Prediction
of Football Games.
References [8] B. G. Weber, M. Mateas and A. Jhala, Applying
Goal-Driven Autonomy to StarCraft, Association
for the Advancement of Artificial Intelligence, 2010
[1] A. Belicza, SC2Gears
(https://sites.google.com/site/sc2gears/), 2010-
2012
[2] J. H. Friedman, Greedy Function Approximation:
A Gradient Boosting Machine, Technical Discus-
sion: Foundation of TreeNet(tm), 1999
[3] Mark Hall, Eibe Frank, Geoffrey Holmes, Bern-
hard Pfahringer, Peter Reutemann, Ian H. Witten
(2009); The WEKA Data Mining Software: An(1) (2) (3) Figure 3: Example Games of prediction probability as time passes in a game. In (1), the winning player opted to go for a more defensive and technology focused play, while his opponent favored an aggressive and economic opening. The aggression was stopped and the winning player counter attacked with higher technology and wins the game. In (2), the winning player opens with a very risky and aggressive type of play. Since it is risky, his probability of winning starts out lower. His aggressive play is successful this time and does enough damage to allow him to go on and win the game. Fi- nally, (3) presents a failure in prediction. The game is completely unorthodox; both players play aggressive and destroy each other. The prediction probability shown in (3) is incorrect for this particular game
You can also read