Modeling the Trend of Credit Card Usage Behavior for Different Age Groups Based on Singular Spectrum Analysis
←
→
Page content transcription
If your browser does not render page correctly, please read the page content below
algorithms
Article
Modeling the Trend of Credit Card Usage Behavior
for Different Age Groups Based on Singular
Spectrum Analysis
Wei Nai 1 , Lu Liu 2, *, Shaoyin Wang 1 and Decun Dong 3
 1   Department of Electronic and Information Engineering, Tongji Zhejiang College, Jiaxing 314051, China;
     alexni@tongji.edu.cn (W.N.); 82730@tongji.edu.cn (S.W.)
 2   Whitman School of Management, Syracuse University, Syracuse, NY 13244, USA
 3   Key Laboratory of Road and Traffic Engineering, Ministry of Education, Tongji University,
     Shanghai 201804, China; ddc@tongji.edu.cn
 *   Correspondence: lliu123@syr.edu; Tel.: +1-(315)-420-0628

 Received: 12 December 2017; Accepted: 26 January 2018; Published: 29 January 2018

 Abstract: Credit card holders from different age groups have different usage behaviors, so deeply
 investigating the credit card usage condition and properly modeling the usage trend of all customers
 in different age groups from time series data is meaningful for financial institutions as well as banks.
 Until now, related research in trend analysis of credit card usage has mostly been focused on specific
 group of people, such as the behavioral tendencies of the elderly or college students, or certain
 behaviors, such as the increasing number of cards owned and the rise in personal card debt or
 bankruptcy, in which the only analysis methods employed are simply enumerating or classifying raw
 data; thus, there is a lack of support in specific mathematical models based on usage behavioral time
 series data. Considering that few systematic modeling methods have been introduced, in this paper,
 a novel usage trend analysis method for credit card holders in different age groups based on singular
 spectrum analysis (SSA) has been proposed, using the time series data from the Survey of Consumer
 Payment Choice (SCPC). The decomposition and reconstruction process in the method is proposed.
 The results show that the credit card usage frequency falls down from the age of 26 to the lowest
 point at around the age of 58 and then begins to increase again. At last, future work is discussed.

 Keywords: statistics of credit card usage; singular spectrum analysis (SSA); time series; behavior
 analysis; trend modeling

1. Introduction
     In modern society, credit cards have become a fact of everyday life for most consumers. A survey
about credit card usage has shown evidence of their pervasiveness [1]. As of 2011, seventy-seven
percent of U.S. adults owned at least one credit card, with a total of 1.4 billion cards in circulation.
The average cardholder owns 7.7 cards and uses a credit card 119 times a year, charging an average of
88 U.S. dollars per transaction or 10,500 U.S. dollars annually [2]. The ease of access of credit cards has
given consumers increased opportunities for making purchases. However, while many consumers are
able to use credit cards wisely, others seem to be unable to control their consuming behavior [3]. Over
the past two decades, the use of credit cards has become an area of economic and social concern [4].
     In order to master the credit card usage situation and all of the other economic behaviors that
happened around the country of the U.S., and to provide a publicly available time series dataset
to support research on consumer payments, the Survey of Consumer Payment Choice (SCPC) was
carried out by Federal Reserve Bank of Boston [5]. There are three broad categories of SCPC variables.
Of them, the first set of variables comprises My Household Questionnaire (MHQ) variables. MHQ

Algorithms 2018, 11, 15; doi:10.3390/a11020015                               www.mdpi.com/journal/algorithms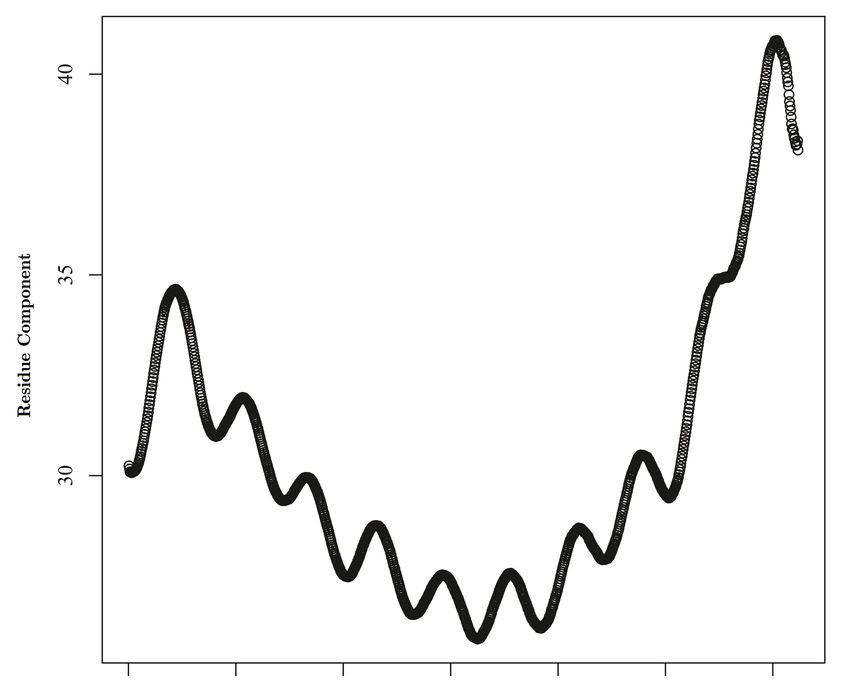
Algorithms 2018, 11, 15                                                                              2 of 11

is used to gather demographic data about each respondent, including age, gender, and household
income. The second set of variables comprises survey variables, which are the actual results from the
SCPC survey questions. The third set of variables comprises created variables, which are created to
help people understand this survey better.
     In this paper, we make the first effort to analyze the trend of credit card usage as age grows with
the aid of Singular Spectrum Analysis (SSA) based on SCPC time series data. This paper is organized
as follows: in Section 2, we make a comprehensive literature review from three aspects: analysis based
on SCPC data, developments and applications of SSA, and the trend studies of credit card usage.
In Section 3, we present the SSA methodology we use and how we model the credit card usage with
SSA. In Section 4, we describe the SCPC survey and the credit card usage data we obtained from the
survey. Section 5 is our case study, involving how we applied SSA to our credit card usage data. Last
but not least, in Section 6, we make our summary, conclusions, and comments upon future work.

2. Literature Review

2.1. On Analysis Based on SCPC Data
     As has been discussed above, the SCPC has been carried out so as to let government officials,
researchers, and the public to obtain an easier approach to consumer payments behavior, and to obtain
a better understanding of the usage situation of credit cards. Until now, various research efforts has
been made by employing the data in this survey. By statistical analysis, Foster et al. [5] have pointed
out that the average consumer held 5.1 of the nine common payment instruments and used 4.2 of them
during a typical month in the U.S. of the year 2008. Stavins et al. [6] have tried to discover whether U.S.
merchants are using their recently granted freedom to offer price discounts and other incentives to
steer customers to pay with methods that are less costly to merchants, and have found that only a very
small fraction of transactions received a cash or debit card discount, and even fewer were subjected to
a credit card surcharge. Koulayev et al. [7] developed and estimated a structural model of adoption
and use of payment instruments by U.S. consumers. After that, they utilized a cross-section from the
Survey of Consumer Payment Choice. Finally, they evaluated substitution and income effects.

2.2. On Developments and Applications of Singular Spectrum Analysis
      Singular Spectrum Analysis was put forward by Broomhead and King [8,9]. At first, it was widely
used because of its effectiveness in reducing residuals. Later, Vautard et al. [10,11] applied this new SSA
method in dealing with time series data and showed good results, especially for short, noisy, chaotic
signals. At the same time, Ghil and Vautard [12] used SSA to analyze the time series of global surface
air temperatures for the past 135 years. They found out that SSA can generate a secular warming
trend and a small number of oscillatory modes; after the residual is separated, the original pattern
of the series can be better explained. In 2002, Ghil et al. [13] reviewed different SSA methods used in
the area of climate variables prediction. The various steps, advantages, and disadvantages were all
discussed. In 2007, Golyandina and Osipov [14] analyzed the problem of applying SSA to time series
with missing data. Their proposed algorithms result in the extraction of additive components of time
series with simultaneous filling in of the missing data. SSA has also been applied to the area of finance
and economics. Hassani and Thomakos [15] reviewed recent developments in the theoretical and
methodological aspects of SSA in the area of economic and financial time series, and also present some
new results. Again, Hassani et al. [16] applied univariate and multivariate singular spectrum analysis
for predicting the value of changes in the daily pound/dollar exchange rate. A comparison to other
models was presented, and the results showed that SSA is superior to other benchmarking models.
Also, Hassani et al. [17] developed the multivariate SSA (MSSA) technique and demonstrated that
MSSA can be a powerful method for time series analysis and forecasting. UK Industrial Production
series were used to illustrate the main findings, and the result showed better accuracy compared with
the autoregressive integrated moving average (ARIMA) and vector autoregressive (VAR) models.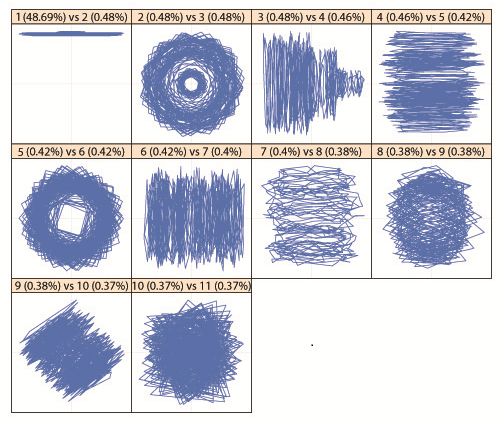
Algorithms 2018, 11, 15                                                                             3 of 11

During recent years, the SSA algorithm has been widely used in various industries, and Safari et al. [18]
even upgraded it as multi-scaled SSA (MSSSA) in making short-term forecasts for certain objects,
such as wind power, which may have many chaotic components.

2.3. On Trend Studies of Credit Card Usage
      Until now, a bunch of efforts has been made in the usage trend analysis of credit cards. Some of
the related research has focused on the usage trend of a specific group of people. Dellutri et al. [19]
studied the rising trend of senior citizen credit card debt, and pointed out that increased health care
costs, gambling, lower interest rates on investment, the loss of jobs before planned retirement, and low
retirement income are the main causes by a thorough statistics. Adams and Moore [20] analyzed the
risky behavior of college students, for they are of more convenience for researchers to acquire card
usage sample data on; while some of the related research has focused on the usage trend of specific
behavior, such as for the misuse of a credit card, by simply investigating statistics data. Manning [21]
and Ladka [22] pointed out that the popularization of credit cards had increased the trend of personal
bankruptcy, and by a statistical analysis, the American Bankruptcy Institute [23] showed the result
that about 1 personal bankruptcy happens in every 175 adults, and by frequent itemset mining, Seeja
and Zareapoor [24] developed a credit card fraud detection model to identify misbehaving tendencies.
As for the number of cards owned and the total amount of items to be repaid, Wang and Xiao [25]
showed the result of a mean of 2 cards with a range of 1 to 18 cards owned by each holder, and that the
total amount of items to be repaid has risen from around $250 to almost $1500 in the past 30 years.
When it comes to the comprehensive analysis of credit card usage trends, Yang et al. [26] pointed
out that trend analysis is important for credit card issuers as emerging consumer psychology and
consumer-behavior-related subjects; however, the only work that comprehensively analyzed the trend
of credit card usage, done by Mansfield et al. [27], focused more on the research of a usage trend by
reviewing 537 research reports in the past 40 years than on the trend of the credit card usage itself.
It can be seen that while analyzing credit card usage by simply enumerating or classifying raw data is
a common practice in related research, there is an obvious lack of support in specific mathematical
models on this issue.

3. Singular Spectrum Analysis
     The Singular Spectrum Analysis (SSA) method was developed since 1970s. SSA is a model-free
approach because SSA decomposes an original time series into a trend, seasonal and semi-seasonal
components, and residuals based on singular value decomposition (SVD) [28]. The new decomposed
series can help us to understand the trend of the original time series and to extract seasonal or
monthly components and residuals. The basic concept of SSA consists of four steps: embedding,
singular value decomposition (SVD), grouping, and diagonal averaging. The basic SSA algorithm
decomposes an initial time series into a new time series which consists of the trend, the seasonal and
semi-seasonal components, and residuals. The basic SSA algorithm has two stages: decomposition
and reconstruction.

3.1. Decomposition
     The first step in the basic SSA algorithm is embedding. In this step, the original time series
is converted into a trajectory matrix. For an original time series (X = x1 , . . . , xN ) of length N with
no missing value, a window of length L is chosen (2 < L < N/2) to embed the original time series.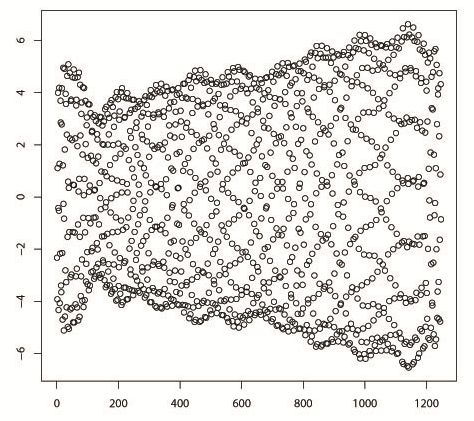
Algorithms 2018, 11, 15 4 of 11
Then, the original time series X is mapped into L lagged vectors, Xi = xi , . . . , xi+L−1 for i = 1, . . . , K,
where K = N − L + 1. Thus, TX is written as:
x1 x2 ... xL
x x3 . . . x L +1
Ti,j = 2 .
... ... ...
x K x K +1 . . . x N
After the embedding step, SVD is applied to the trajectory matrix TX and the decomposed
trajectory matrices Ti are obtained. Ui for 1 < i < L is a Ki × L orthonormal matrix, Di for 1 < i < L is a
diagonal matrix order of L, and Vi for 1 < i < L is an L × L square orthonormal matrix. In this step, TX
has L many singular values, which are:
q
TX = sumid=1 Ui λi ViT . (1)
Then, we can calculate the ratio of each eigenvalue. The ratio of each eigenvalue is the contribution
of the matrix Ti to TX .
3.2. Reconstruction
The grouping step of the reconstruction stage is to decompose the L × K matrix Ti into subgroups
according to the trend, the seasonal and semi-seasonal components, and residuals. The grouping
step of the reconstruction stage is a partition of the set of indices 1, . . . , d into the collection of m
disjoined subsets of I = I1 , . . . , Im . Thus, Ti corresponds to the group I = {I1 , . . . , Im }. TIi is a sum of Tj ,
where j ∈ Ii . So, TX can be expanded as
TX = T1 + . . . + TL = TI1 + . . . + TIm . (2)
Assume that there are two groups of eigentriples of the trajectory matrix TX : TL and TR . The whole
set will be I = {1, . . . , d}, R ∪ L = I. However, R is not a subset of L. TI is
∑ λi Ui ViT
p
TI = (3)
i∈ I
and we can calculate TL = TI − TR under the assumption of weak separability. Thus, TL can be written as
∑ λi Ui ViT .
p
TL = (4)
i∈ L
The final step is diagonal averaging. In the basic SSA algorithm, the diagonal averaging step is to
→ (i )
transform the grouped matrices TIi into a new time series of length N. We obtain the time series T
from an averaging of the corresponding diagonals of the matrix TIi .
s −1
1
s −1 ∑ x j,s− j 2≤s≤L
j =1
L
→
1
T i,j = L ∑ x j,s− j L+1 ≤ s ≤ K+1 . (5)
j =1
N − s +2
1
∑
N − s +2 x j,s− j K+2 ≤ s ≤ N+1
j=s−K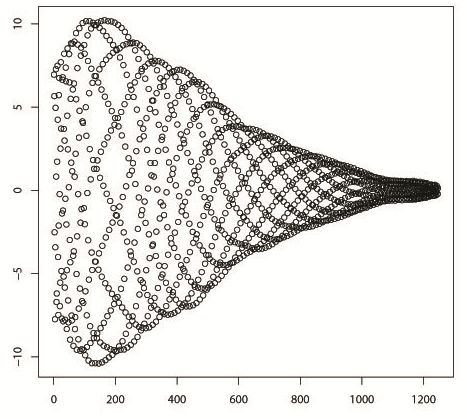
Algorithms 2018, 11, 15 5 of 11
4. Data Description
Algorithms 2018, 10, x 5 of 11
4.1. The Survey of Consumer Payment Choice
4. Data Description
The Survey of Consumer Payment Choice (SCPC) was produced by the Consumer Payments
4.1. The
Research Survey
Center of Consumer
(CPRC) in thePayment
researchChoice
department at the Federal Reserve Bank of Boston. One of the
major goals of the Survey of Consumer
The Survey of Consumer Payment Payment Choice was
Choice (SCPC) (SCPC) was tobyprovide
produced a publicly
the Consumer available,
Payments
consumer-level longitudinal
Research Center (CPRC) indataset to support
the research research
department at the on consumer
Federal Reservepayments and to
Bank of Boston. One provide
of
the major
aggregate data ongoals of the
trends in Survey of Consumer
U.S. consumer Payment Choice (SCPC) was to provide a publicly
payments.
available,
There are consumer-level
2065 respondents longitudinal
in the 2012dataset to support
SCPC, research 49
and it contains on tables
consumer
withpayments
detailedand to
estimates
provide aggregate data on trends in U.S. consumer payments.
of the number of consumer payments, rate of adoption, and share of consumers using nine common
There are 2065 respondents in the 2012 SCPC, and it contains 49 tables with detailed estimates
payment instruments, which are cash, checks, money orders, travelers checks, debit cards, credit
of the number of consumer payments, rate of adoption, and share of consumers using nine common
cards,payment
prepaidinstruments,
cards, online banking bill payments (OBBP), and bank account number payments
which are cash, checks, money orders, travelers checks, debit cards, credit
(BANP)cards, prepaid cards, online directly
plus payments made banking from consumers’
bill payments income
(OBBP), source.
and bank The number
account report also contains
payments
estimates of consumer activity related to banking, cash management, and other
(BANP) plus payments made directly from consumers’ income source. The report also contains payment practices;
consumer assessments
estimates of consumer ofactivity
payment characteristics;
related to banking, cashand a rich setand
management, of other
consumer
paymentand household
practices;
demographic
consumercharacteristics.
assessments of payment characteristics; and a rich set of consumer and household
demographic
The analysis characteristics.
focuses on the generations aged 18 through 94 and how they made payments,
includingThe the analysis
medianfocuses
dollar on the generations
value of payments, agedthe
18 frequency
through 94 of
andthehow they made
payment payments,used,
instrument
including the median dollar value of payments, the frequency of the payment instrument used, the
the device used to pay (including mobile, computer, or mail order) and the top five merchant categories
device used to pay (including mobile, computer, or mail order) and the top five merchant categories
where the majority of transactions were made.
where the majority of transactions were made.
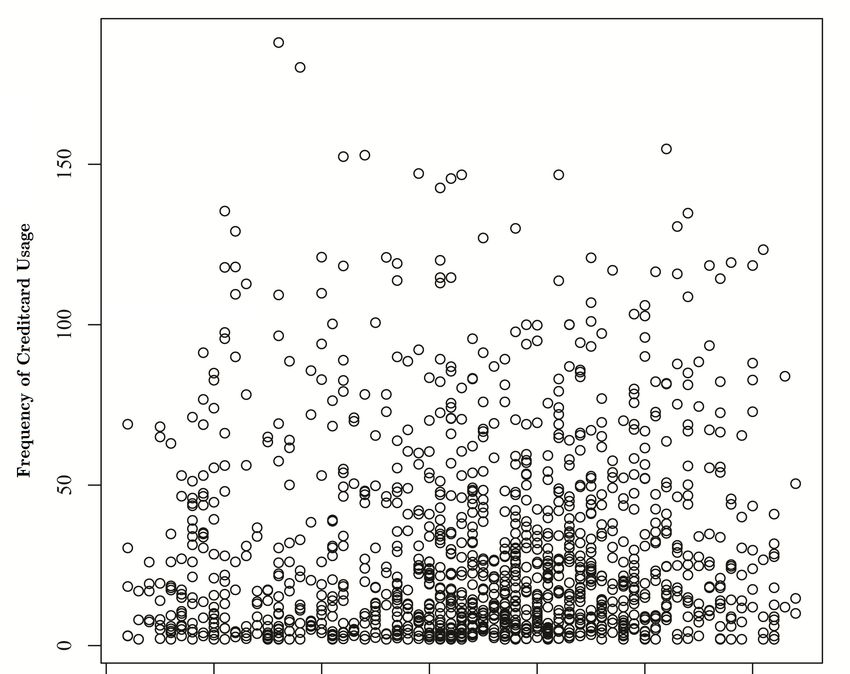
4.2. Credit Card Usage
4.2. Credit Card Usage
Of theOfmany tables
the many in SCPC
tables 2012,
in SCPC we picked
2012, we pickedup upthethe
table containing
table containing information
informationabout
aboutcredit
credit card
usage.card
Theusage.
survey asked
The surveyquestions about the
asked questions timethe
about of time
usage ofof a credit
usage of a card
creditincard
the in
last
themonth. The data
last month.
was first
The filtered,
data wasexcluding those
first filtered, that were
excluding invalid
those data.invalid
that were After that,
data. we
Afterhad 1248
that, wedata
hadpoints
1248 datain total.
The scatter
points plot is provided
in total. The scatter below,
plot isasprovided
is shown in Figure
below, 1. As we
as is shown can see
in Figure 1. from
As wethecanfigure, it isthe
see from pretty
figure, it is pretty messy and it seems that there is no particular pattern in the series
messy and it seems that there is no particular pattern in the series of data. The plot of the original of data. The plot
creditofcard
the original creditiscard
usage series usageinseries
shown is shown
Figure 2. in Figure 2.
Figure 1. Scatter plot of credit card usage per month with age.
Figure 1. Scatter plot of credit card usage per month with age.
Algorithms 2018, 11, 15                                                                                                6 of 11
       Algorithms 2018, 10, x                                                                                     6 of 11

                                                                Age

                                   Figure
                                Figure    2. Plot
                                       2. Plot ofofcredit
                                                     creditcard
                                                            cardusage
                                                                usage per
                                                                      per month
                                                                          monthwith
                                                                                withage.
                                                                                      age.

       5. Model Results
5. Model Results
             SSA is a subspace-based method which works in four steps. First, we select a maximum lag L (1
     SSA
       < L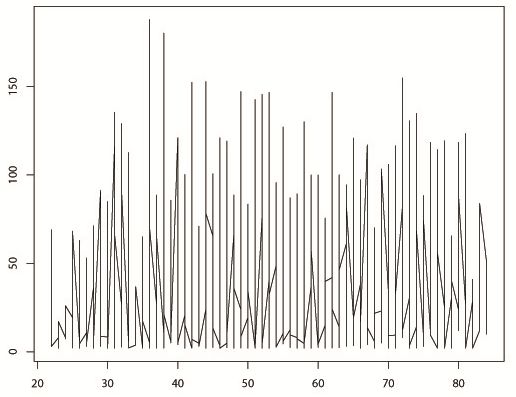
Algorithms 2018, 11, 15 7 of 11
Algorithms 2018, 10, x 7 of 11
Figure 3. Ten pairs of eigenvectors decomposed from the original credit card usage series.
Figure 3. Ten pairs of eigenvectors decomposed from the original credit card usage series.
5.2. Reconstruction
5.2. Reconstruction
The
The stage
stage of of reconstruction
reconstruction can can bebe viewed
viewed as as the
the formation
formation of of anan elementary
elementary series
series andand then
then
taking a sum of some of them depending on the grouping chosen.
taking a sum of some of them depending on the grouping chosen. What we do first is eigentriple What we do first is eigentriple
grouping.
grouping. This This process
process of of grouping
grouping corresponds
corresponds to to splitting
splitting the the original matrices X
original matrices Xii into
into several
several
groups and then summing the matrices within each group. If I =
groups and then summing the matrices within each group. If I = 1i1, …, ipp is one such group, theni , . . . , i is one such group, then thethe
matrix
matrix X XII corresponding
corresponding to to the group II is
the group is defined
defined as: as: XXII ==XXi1i1+ +…. .+. X +ipX ip . For
. For m such
m such groups,
groups, X will
X will be
be given as: X = X + . . . + X . The contribution of component
given as: X = XI1 + … + XIm. The contribution of component XI is measured by the share of the
I1 Im X I is measured by the share of the
corresponding
corresponding eigenvalues.
eigenvalues.
The
The choice of
choice of leading
leading eigentriples corresponds to
eigentriples corresponds to the
the approximation
approximation of of the
the time
time series
series inin view
view
of the optimality property of the SVD. Then, we perform the
of the optimality property of the SVD. Then, we perform the step of diagonal averaging. At this step of diagonal averaging. Atstep,
this
step,
we transform each matrix of the grouped decomposition into a new series. In the stage of
we transform each matrix of the grouped decomposition into a new series. In the stage of
reconstruction, we can see the components of the original series as
reconstruction, we can see the components of the original series as is shown by the following figures is shown by the following figures
from
from Figures
Figures 4–6.4–6.
In our case,
In our case, thetheproblem
problemofoffinding findinga areconstructed
reconstructed structure
structure of ofthethe original
original series
series by SSA
by SSA is theis
the same as the identification of the eigentriples of the SVD from
same as the identification of the eigentriples of the SVD from the trajectory matrix of this series, the trajectory matrix of this series,
which correspond to
which correspond to the
thetrend,
trend,the theseasonal
seasonalcomponent,
component,the the semi-seasonal
semi-seasonal component,
component, andand noise.
noise. In
In practice, the means we used for noise extraction was the grouping
practice, the means we used for noise extraction was the grouping of the eigentriples, which of the eigentriples, which excludes
the elements
excludes of trend, seasonal
the elements of trend, component, and semi-seasonal
seasonal component, component.
and semi-seasonal component.
After
After we eliminate the seasonal, semi-seasonal, and residual components
we eliminate the seasonal, semi-seasonal, and residual components of of the
the original
original credit
credit
card usage series, we can finally get the trend of the series,
card usage series, we can finally get the trend of the series, as is shown by Figure 7. as is shown by Figure 7.
From
From the thefigure,
figure,we wecan cansee that
see following
that following thethe
steps of SSA,
steps of SSA,the originally
the originally messymessycreditcredit
card usage
card
series
usage showed an obvious
series showed an obvioustrend. First,
trend.itFirst,
increases as age grows
it increases as age and grows reaches its first peak
and reaches its firstat around
peak at
the age 42,
around thethen
age 42,forthen
somefor unknown
some unknown reasons reasons
it falls down
it fallstodown
its lowestto itspoint
lowest atpoint
around the age 58,
at around the and
age
then it begins to increase for the second time monotonely to the end.
58, and then it begins to increase for the second time monotonely to the end. Finally, there is another Finally, there is another growing
growing trend, but we believe this irregular pattern is due to the lack of data points when the age
reaches 80. The trend of the credit card usage series is shown by Figure 7.Algorithms 2018, 11, 15 8 of 11
trend, but we believe this irregular pattern is due to the lack of data points when the age reaches 80.
Algorithms 2018,
trend of2018,
TheAlgorithms 10, xx
the 10,
credit card usage series is shown by Figure 7. 88 of
of 11
11
Figure
Figure
Figure 4. Seasonal
4. 4. Seasonal
Seasonal componentofof
component
component ofthe
theoriginal
the originalcredit
original credit card
credit card usage
usage series.
usage series.
series.
Figure
Figure 5. Semi-seasonal
5. 5.
Figure Semi-seasonal
Semi-seasonal componentof
component
component ofthe
of theoriginal
the originalcredit
original credit card
credit card usage
card series.
usageseries.
series.Algorithms 2018, 11, 15 9 of 11
Algorithms 2018, 10, x 9 of 11
Algorithms 2018, 10, x 9 of 11
Figure 6. Residue component of the original credit card usage series.
Figure 6. Residue component of the original credit card usage series.
Figure 6. Residue component of the original credit card usage series.
Figure 7. Trend of the original credit card usage series.
Figure 7. Trend
Figure7. Trend of
of the
the original creditcard
original credit cardusage
usageseries.
series.Algorithms 2018, 11, 15 10 of 11
6. Summary, Conclusions, and Future Work
In this paper, for the first time we applied Singular Spectrum Analysis (SSA) to credit card
usage data to analyze the trend of credit card usage as age grows. Following the four steps of SSA,
after eliminating the seasonal, semi-seasonal, and residual components of the original time series,
we obtain our trend of credit card usage. The result showed that, at first, the credit card usage increases
as age grows, and reaches its first peak at around the age 26, then for some unknown reasons it falls
down to its lowest point at around the age 58, and then it begins to increase for the second time
monotonely to the end. At last, there is another growing trend, but we believe this irregular pattern is
due to the lack of data points when the age reaches 80.
To the best of our knowledge, this is the first time that SSA has been applied to analyze the trend
of credit card usage over age. Previous studies concerning credit card usage have mainly focused
on credit card debt trends, the risky credit card usage behavior of college students, or the relation
between credit card usage and personal bankruptcy. The result we generated is novel and important
considering the field of credit card usage.
In the future, we will do research about how to explain this trend: why does the credit card
usage reach its peak at around the age of 26? Will the position of this peak be changed? In addition,
why does it fall down afterward and why does it grow up again? We will try to analyze this interesting
and counter-intuitive phenomenon by the demographic data collected by the American Life Panel
(ALP) survey.
Acknowledgments: This work is supported by National Key Research and Development Program of the 13th
Five-year Plan in China under Grant No. 2016YFB1200401, the Fund of Shanghai Cooperative Center for Maglev
and Rail Transit, and the Fund of Shanghai Fei Tu You Science and Technology Company Limited under Grant
No. 0217013.
Author Contributions: Wei Nai and Lu Liu proposed the idea of employing the SSA algorithm into the credit
card usage behavioral analysis; Lu Liu conceived and designed the experiments; Wei Nai set up and performed
the experiments; Lu Liu collected the data; Shaoyin Wang and Decun Dong analyzed the data; Wei Nai and Lu Liu
wrote the paper; and Xinxian Lei (not in the author list) and Decun Dong gave many helpful insights into the
paper’s organization.
Conflicts of Interest: The authors declare that there is no conflict of interest regarding the publication of this paper.
References
1. G.19 Report. 2012. Available online: http://www.federalreserve.gov/releases/g19/Current (accessed on 9
December 2014).
2. Credit Stats. Available online: http://ficoforums.myfico.com/t5/Credit (accessed on 9 December 2014).
3. Trai, C.Y.; Wang, J.C.; Chen, C.J. Mining usage behavior change for credit card users. WSEAS Trans. Inf.
Sci. Appl. 2007, 4, 529–536.
4. Awanis, S.; Cui, C.C. Consumer susceptibility to credit card misuse and indebtedness. Asia Pac. J. Mark. Logist.
2014, 26, 408–429. [CrossRef]
5. Foster, K.; Meijer, D.; Schuh, S.; Zabek, M.A. The 2008 Survey of Consumer Payment Choice; FRB of Boston
Public Policy Discussion Paper No. 09-10; Elsevier: Amsterdam, The Netherlands, 2010. [CrossRef]
6. Stavins, J.; Shy, O. Merchant steering of consumer payment choice: Evidence from a 2012 diary survey.
J. Behav. Exp. Econ. 2015, 155, 1–9. [CrossRef]
7. Koulayev, S.; Rysman, M.; Schuh, S.; Stavins, J. Explaining adoption and use of payment instruments by US
consumers. RAND J. Econ. 2016, 47, 293–325. [CrossRef]
8. Broomhead, D.S.; King, G.P. Extracting qualitative dynamics from experimental data. Phys. D Nonlinear
Phenom. 1986, 20, 217–236. [CrossRef]
9. Sarkar, S. Nonlinear Phenomena and Chaos; Hilger: Bristol, UK, 1986; pp. 113–144, ISBN 0852744943.
10. Vautard, R.; Ghil, M. Singular spectrum analysis in nonlinear dynamics, with applications to paleoclimatic
time series. Phys. D Nonlinear Phenom. 1989, 35, 395–424. [CrossRef]
11. Vautard, R.; Yiou, P.; Ghil, M. Singular-spectrum analysis: A toolkit for short, noisy chaotic signals. Phys. D
Nonlinear Phenom. 1992, 52, 95–126. [CrossRef]Algorithms 2018, 11, 15 11 of 11
12. Ghil, M.; Vautard, R. Interdecadal oscillations and the warming trend in global temperature time series.
Nature 1991, 350, 324–327. [CrossRef]
13. Ghil, M.; Allen, R.M.; Dettinger, M.D.; Ide, K.; Dondrashov, D.; Mann, M.E.; Robertson, A.W.; Saunders, A.;
Tian, Y.; Varadi, F.; et al. Advanced spectral methods for climatic time series. Rev. Geophys. 2002, 40, 1003.
[CrossRef]
14. Golyandina, N.; Osipov, E. The caterpillar-SSA method for analysis of time series with missing values. J. Stat.
Plan. Inference 2007, 137, 2642–2653. [CrossRef]
15. Hassani, H.; Thomakos, D. A review on singular spectrum analysis for economic and financial time series.
Stat. Its Interface 2010, 3, 377–397. [CrossRef]
16. Hassani, H.; Soofi, A.; Zhigljavsky, A. Predicting daily exchange rate with singular spectrum analysis.
Nonlinear Anal. Real World Appl. 2011, 11, 2023–2034. [CrossRef]
17. Hassani, H.; Heravi, S.; Zhigljavsky, A. Forecasting UK industrial production with multivariate singular
spectrum analysis. J. Forecast. 2013, 32, 395–408. [CrossRef]
18. Safari, N.; Chung, C.Y.; Price, G.C.D. Novel multi-step short-term wind power prediction framework based
on Chaotic Time Series Analysis and Singular Spectrum Analysis. IEEE Trans. Power Syst. 2018, 33, 590–601.
[CrossRef]
19. Credit Card Horrors for Senior Citizens. Available online: http://www.bankruptcylawnetwork.com/2010/
12/29/credit-card-horrors-for-senior-citizens (accessed on 9 December 2014).
20. Adams, T.; Moore, M. High-risk health and credit behavior among 18-to-25-year-old college students. J. Am.
Coll. Health 2007, 56, 101–108. [CrossRef] [PubMed]
21. Manning, R.D. Credit card nation: The consequences of America’s addiction to credit. Contemp. Sociol. 2003,
32, 464–465.
22. Personal Bankruptcies Rose 8 Percent in 2010. Available online: http://www.creditcards.com/credit-card-
news/bankruptcy-statistics-2010-q4.php (accessed on 9 December 2014).
23. Total Bankruptcy Fillings Up 11% through First Nine Months of 2010 While Business Filling
Decrease. Available online: http://www.abiworld.org/AM/Tenplate.cfm?Section-Home&TEMPLATE=
/CM/contentDisplay.cfm&CONTENTID=62410 (accessed on 9 December 2014).
24. Seeja, K.R.; Zareapoor, M. FraudMiner: A novel credit card fraud detection model based on frequent itemset
mining. Sci. World J. 2014, 2014, 252797. [CrossRef] [PubMed]
25. Wang, J.; Xiao, J.J. Buying behavior, social support and credit card indebtedness of college students. Int. J.
Consum. Stud. 2009, 33, 2–10. [CrossRef]
26. Yang, B.; Spinella, M.; Lester, D. Credit card use and prefrontal cortex dysfunction: A study in
NeuroEconomics. Psychol. Rep. 2004, 94, 1267–1268. [CrossRef] [PubMed]
27. Mansfield, P.M.; Pinto, M.B.; Robb, C.A. Consumers and credit cards: A review of the empirical literature.
J. Manag. Mark. Res. 2013, 12, 1–26.
28. Myung, N.K. Singular Spectrum Analysis. Master’s Thesis, University of California, Los Angeles, CA, USA, 2009.
© 2018 by the authors. Licensee MDPI, Basel, Switzerland. This article is an open access
article distributed under the terms and conditions of the Creative Commons Attribution
(CC BY) license (http://creativecommons.org/licenses/by/4.0/).You can also read