Identification of Deregulated Transcription Factors Involved in Specific Bladder Cancer Subtypes
←
→
Page content transcription
If your browser does not render page correctly, please read the page content below
Identification of Deregulated Transcription Factors
                                                       Involved in Specific Bladder Cancer Subtypes
                                                 Magali Champion1 , Julien Chiquet2 , Pierre Neuvial3 , Mohamed Elati4 ,
                                                              Franois Radvanyi5 , and Etienne Birmel1
arXiv:2004.08312v1 [q-bio.MN] 17 Apr 2020

                                                        1
                                                            Laboratoire MAP5, UMR8145 CNRS, Universit Paris Descartes, Paris, France
                                                                                magali.champion@parisdescartes.fr
                                                         2
                                                            UMR MIA-Paris, AgroParisTech, INRA, Universit Paris-Saclay, Paris, France
                                                3
                                                     Institut de Mathmatiques de Toulouse, UMR 5219, Universit de Toulouse, CNRS, France
                                                           4
                                                              Universit de Lille, INSERM U908, Cell Plasticity and Cancer, Lille, France
                                                             5
                                                               Institut Curie, PSL Research University, CNRS, UMR144, Paris, France

                                                                                              Abstract
                                                        Comparison between tumoral and healthy cells may reveal abnormal regulation behav-
                                                    iors between a transcription factor and the genes it regulates, without exhibiting differential
                                                    expression of the former genes. We propose a methodology for the identification of tran-
                                                    scription factors involved in the deregulation of genes in tumoral cells. This strategy is
                                                    based on the inference of a reference gene regulatory network that connects transcription
                                                    factors to their downstream targets using gene expression data. Gene expression levels in
                                                    tumor samples are then carefully compared to this reference network to detect deregulated
                                                    target genes. A linear model is finally used to measure the ability of each transcription
                                                    factor to explain these deregulations. We assess the performance of our method by nu-
                                                    merical experiments on a public bladder cancer data set derived from the Cancer Genome
                                                    Atlas project. We identify genes known for their implication in the development of specific
                                                    bladder cancer subtypes as well as new potential biomarkers.

                                            1    Introduction
                                            Today, after decades of intensive research, cancer is still one of the most deadly diseases world-
                                            wide, killing millions of people every year. Cancer is mainly caused by somatic mutations that
                                            affect critical genes and pathways. These mutations are mostly triggered by environmental
                                            factors (e.g. obesity, smoking, alcohol, lifestyle,...) often promoted by certain genetic configu-
                                            rations. In the last two decades, large-scale projects, such as the Cancer Genome Atlas project
                                            (TCGA), which has produced massive amounts of multi-omics data, have launched to improve
                                            our understanding of cancers [32]. In this context, developing statistical algorithms able to
                                            interpret these large data sets and to identify genes that are the origin of diseases and their
                                            causal pathways still remains an important challenge.
                                                Genes are commonly affected by genomic changes in the pathogenesis of human cancer.
                                            Cancer is moreover a heterogeneous disease, with affected gene sets that may be highly different
                                            depending on subtypes, and thus requires different treatments of patients. Specific analyses of
                                            subtypes have for example revealed significant differences between breast cancer subgroups [13]
                                            but also pancancer similarities between breast and bladder cancer subgroups [16].
                                                Using transcriptional data allows to look beyond DNA, that is to study abnormalities in
                                            terms of gene expression. As a common approach, differential expression analysis, for which
                                            statistical procedures have been intensively explored, can be performed and altered genes are
                                            then differentially expressed genes [12]. This points to relevant genes but does not take into
                                            account the regulations (activation and inhibition) between genes.
Identification of Deregulated TFs in Bladder Cancer Champion, Chiquet, Neuvial, Elati, Radvanyi, Birmel
The approach we consider consists in taking into account the regulation structure between
genes. We particularly focus on transcription factors (TFs), for their major role played in the
regulation of gene expression, which make them an attractive target for cancer therapy [29, 36].
Regulation processes between TFs and their targets are usually represented by Gene Regulatory
Networks (GRNs). In the last few years, many different methods have been proposed to infer
GRNs from collections of gene expression data. In a discrete framework, gene expression can
be discretized depending on their status (under/over-expressed or normal) and truth tables
provide the regulation structure [9]. In the continuous case, regression methods, including the
popular Lasso [33] and its derivatives, have provided powerful results [18, 25].
A deregulated gene then corresponds to a gene whose expression does not correspond to
the expression level expected from its regulators expression. It is different from the notion of
differential expression since a loss of regulation between a target gene and one of its regulat-
ing TFs implies a loss of correlation between them but not necessarily differential expression.
Conversely, a TF can be differentially expressed and one of its targets not, precisely because it
is deregulated.
To discover deregulated genes, a first possibility is to infer one network per condition and
to compare them. Statistical difficulties due to the noisy nature of transcriptomic data and the
large number of features compared to the sample size can be taken into account by inferring the
networks jointly and penalizing the differences between them [4]. A second possible approach is
to assess the adequacy of gene expression in tumoral cells to a reference GRN, in order to exhibit
the most striking discrepancies, i.e. the regulations which are not fulfilled by the data [21, 23].
Such methods however focus on checking the validity of the network rather than highlighting
genes with an abnormal behavior. Finally, analyses may be conducted at the pathway level
rather than the gene level [11, 14]. They are then not network-wide in the sense that each gene
has a deregulation score by pathway it belongs to and pathways are treated independently.
Moreover, as the pathways are extracted from curated databases, the regulations taken into
account are not tissue-specific.
Here, we propose a statistical deregulation model that uses gene expression data to identify
deregulated TFs involved in specific subtypes of cancer. This paper is organized as follows: in
Section 1, we present the 3-steps method we developed and our validation procedure. In Section
2, we illustrate its interest on the TCGA bladder cancer data set. We show that it can be used
complementary to differential expression analysis to point to potential biomarkers of cancers.
2 Methods
2.1 Overview of the Procedure
Our approach for the identification of deregulated transcription factors (TFs) involved in cancers
is based on a 3-steps strategy that (i) creates a reference gene regulatory network (GRN),
which represents regulations between groups of co-expressed TFs and target genes using a
reference data set (Step 1), (ii) computes a deregulation score for each target gene in each
tumor sample by comparing their behavior with the reference GRN (Step 2), (iii) identifies
the most significant TFs involved in the deregulation of the target genes in each sample from
specific cancer subtypes (Step 3). These steps are presented in Figure 1 and described in detail
in the next sections.
2Identification of Deregulated TFs in Bladder Cancer Champion, Chiquet, Neuvial, Elati, Radvanyi, Birmel
Step 1
Step 2
GRN
inference Step 3
Target genes
Subtypes
Deregulation score
Tumor samples
TFs
Deregulated TFs
Figure 1: Workflow of the proposed 3-steps algorithm for identifying TFs involved in specific
cancer subtypes.
2.2 Step 1: Inferring a Gene Regulatory Network
Step 1 of the algorithm consists in inferring a GRN that connects TFs to their downstream
targets. Among the large number of existing methods, we choose hLICORN, available in the
CoRegNet R-package [30]. This algorithm is based on a hybrid version of the LICORN model
[17], in which groups of co-regulated TFs act together to regulate the expression of their targets
(Figure 2). More precisely, LICORN uses heuristic techniques to identify co-activator and co-
inhibitor sets from discretized gene expression matrices and locally associates each target gene
to pairs of co-activators and co-inhibitors that significantly explain its discretized expression.
The hybrid variation of LICORN then ranks the local candidate networks according to how
well they predict the target gene expression, through a linear regression, and selects the GRN
that minimizes the prediction error. This selection step limits the effects of overfitting, induced
by the model complexity, especially the large number of features (genes) as compared to the
sample size [3]. In this work, we slightly enrich the LICORN model by creating a copy of each
TF in the target layer to allow regulations between TFs.
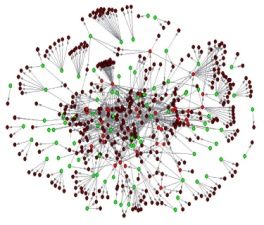
TF1 TF2 TF3 TF4 TF5 TF6 TF7 TFs
Co-regulators
Target genes
g1 g2
Figure 2: Example of LICORN graph involving 7 TFs and 2 target genes. TFs are gathered into
groups of co-expressed genes that co-regulate (square for co-activators, circle for co-inhibitors)
each target gene.
To construct a specific GRN, note that one may prefer using another inference method [5]
3Identification of Deregulated TFs in Bladder Cancer Champion, Chiquet, Neuvial, Elati, Radvanyi, Birmel
or a pre-existing regulatory network, which can be loaded from the RegNetwork database [26].
Here, we focus on hLICORN since the induced model is particularly suitable for the rest of
our analysis. In addition, it was shown to provide powerful results for cooperative regulation
detection, especially on cancer data set [17, 30].
2.3 Step 2: Computing a Deregulation Score
Step 2 of the algorithm aims at identifying deregulated target genes by carefully comparing
their expression across all tumor samples with the reference GRN inferred in Step 1. For this
purpose, we use the method described in [19], which assumes that all genes from a hLICORN
model are allowed to be deregulated, i.e. not to respond to their regulators as expected.
More precisely, according to the hLICORN model, each gene g is connected with a set of co-
regulated TFs split into a group of co-activators A and co-inhibitors I. A binary deregulation
variable Dg , assumed to be non-zero with probability Y , is then introduced to compare the true
status Sg (under/over-expressed or normal) of each target gene in each tumor sample with its
expected value Sg∗ , resulting from a truth Table (see Figure 3 (b)) and the inferred GRN. To
avoid discretization of the data, the status of all genes are considered as hidden variables. The
model is described in Figure 3 (a).
Co-activator set A Co-inhibitor set I
Collective
SA SI
status Activator
Inhibitor collective status
Expected status Sg∗ collective status - 0 +
Deregulation variable
- e0e + +
Dg 0 - 0 +
Sg
+ - - -
True status
(b) Truth table.
Xg expression of gene g
(a) Deregulation model.
Figure 3: (a) The deregulation model [19] used to compute a deregulation score for each target
gene in each sample: each gene g is associated to a hidden status Sg (under, over-expressed
or normal). Target genes are allowed to be deregulated, i.e. not follow their co-regulator rules
(Truth table (b)). The binary variable Dg indicates whether the corresponding target gene g
is deregulated (Dg = 1) or not (Dg = 0). The deregulation score Y of gene g in sample j
is then the probability, given the observation, that Dg = 1 in sample j. (b) LICORN truth
table, which gives the expected status of a target gene according to the collective status of its
co-activators and co-inhibitors. Collective status are set by default to 0 except if and only if all
of its elements share the same status. This table is derived from biological experiments [17].
As the number of hidden variables grows exponentially with the number of genes, the like-
4Identification of Deregulated TFs in Bladder Cancer Champion, Chiquet, Neuvial, Elati, Radvanyi, Birmel
lihood of the model rapidly becomes intractable. The unknown parameters, including the
deregulation score Y , are thus estimated using a dedicated EM-algorithm (see [19] for more
details). Note that the deregulation score Y does not capture information about differentially
expressed genes but genes whose expression does not correspond to the level expected from its
regulator expression.
2.4 Step 3: Identifying Deregulated TFs
Step 3 consists in identifying TFs that cause deregulations of target genes. Our approach is
based on linear regression models, in which we try to explain the deregulation score of all target
genes in one sample (Step 2) using their co-regulator TFs as explanatory variables (Step 1).
Assume that we have q TFs and p target genes. Denote by Yij the deregulation score of target
gene i (1 ≤ i ≤ p) in sample j (1 ≤ j ≤ n) and G := (Gi` )1≤i≤p,1≤`≤q the GRN adjacency
matrix, whose non-zero elements encode the structure (edges) of the graph. We then cast our
model as follows:
∀j ∈ J1, nK, ∀i ∈ J1, pK, Yij = Gi` · B`j + εij , (1)
or, in a matrix form, Y = G · B + ε, where each element B`j of matrix B, to estimate, measures
the deregulation importance of TF ` in sample j and ε stands for the presence of noise.
Solving the B-estimation problem (1) can be viewed as a classical multi-task linear learning
problem, in which the number of observations is the number of target genes p, the number
of linear tasks is n and the number of variables q. To estimate B, we use a constrained least
squares estimation procedure. As we only expect to find TFs positively causing the deregulation
of their targets in each sample, we consider the induced constrained optimization problem:
∀j ∈ J1, nK, B̂·j := argminkY·j − Gβk22 , (2)
β∈Rq
s.t ∀` ∈ J1, qK, 0 ≤ β` ≤ 1
where k.k22 stands for the euclidian norm. The closer B̂`j is to 1, the more important the role
of TF ` in the deregulation of its targets in sample j. To solve Eq. (2), we use the limSolve
R-package.
2.5 Correcting Expression Data
Gene expression is commonly affected by copy number alterations (CNA) [1]. Step 2 of our
procedure is particularly sensitive to CNA, associating high deregulation scores to amplified
or deleted target genes [19]. Indeed, the number of copies of a gene can strongly influence
its expression, independently from its regulators expression, making some regulations wrongly
deregulated.
To remove CNA effects on gene expression and improve the rest of our analysis, we preprocess
target genes expression data beforehand as proposed in [15]. Gene expression is considered as
linearly modified by CNA through the linear regression model:
Xij = α0 + α1 CNAij + εij , (3)
where Xij is the expression of gene j in sample i and CNAij its associated copy number. Let
α̂0 and α̂1 be the estimated solutions of Eq. (3), the corrected expression is then given by:
X̃ij = Xij − α̂0 − α̂1 CNAij .
5Identification of Deregulated TFs in Bladder Cancer Champion, Chiquet, Neuvial, Elati, Radvanyi, Birmel
3 Results and Discussion
3.1 The Bladder Cancer Data Set
We apply our method on bladder cancer data, produced in the framework of the Cancer Genome
Atlas (TCGA) project and available at the Genomic Data Commons Data Portal (https:
//portal.gdc.cancer.gov/). These data include a set of 401 bladder cancer samples with
gene expression and copy number for a total number of 15,430 genes, split into 2,020 TFs and
13,410 targets. Gene expression data were produced using RNA-sequencing on bladder cancer
tissues. Preprocessing is done by log-transformation and quantile-normalization of the arrays.
Missing values are estimated using nearest neighbor averaging [35]. TCGA samples are analyzed
in batches and significant batch effects are observed based on a one-way analysis of variance in
most data modes. We apply Combat [22] to adjust for these effects. Genes are finally filtered
based on their variability: among them, we only keep the 75% most varying genes.
Based on RNA-seq data analysis from the TCGA data portal, samples are split into five
subtypes: basal-squamous (BaSq), luminal (Lum), luminal-infiltrated (LumI), luminal-papillary
(LumP) and neuronal (NE) with different characteristics [10] (Table 1).
Subtypes BaSq Lum LumI LumP NE
Samples 131 44 74 134 18
Table 1: Molecular subtypes distribution of the 401 bladder cancer samples [10] .
3.2 Description of the Procedure Results
GRN network. To validate our method, we have to provide a tissue-specific reference GRN
(Step 1), which is computed given a first set of reference samples. In many cancers, the pure
normal tissue of origin is not available. Here, we work with the five different subtypes of the
TCGA data set presented in Section 3.1. Using samples from one subtype as test cases and
the rest as reference, we infer five different GRNs. Each of them reflect averaged relationships
between genes for patients who are not part of one specific subtype. Due to the very-high
heterogeneity of cancers, especially of bladder cancers [24, 34], we think that our method will
still point to relevant deregulations of specific subtypes.
After calibrating the internal parameters of the hLICORN agorithm, the GRNs we infer
are made of an averaged total number of 28, 246 edges connecting 586 TFs to 3, 432 of their
targets. These networks are relatively sparse, each of the target genes being associated with an
averaged number of 8 TFs.
Deregulation scores. We then run five times the EM procedure (Step 2) on the five subsets
of the gene expression data matrix to compute a deregulation score of each target gene in each
sample of each subtype. From now on, all samples are treated individually, the results reflecting
how genes behaved in each sample of one subtype in comparison to reference samples from all
other subtypes.
To check the effect of the copy number correction we apply at the beginning of our procedure,
we compare the distribution of the deregulation scores across copy number states. To this aim,
we use the TCGA CNA thresholded data set, which associates to each gene-sample pair a
6Identification of Deregulated TFs in Bladder Cancer Champion, Chiquet, Neuvial, Elati, Radvanyi, Birmel
copy number state of “0” for the diploid state (two copies), “1” for a copy number gain, “-1”
for a copy number loss, “2” for an amplification and “-2” for a deletion. We then test for
significant differences between the diploid state and the altered states (-2,-1,1,2) using Student
tests. Results in terms of p-values, which are corrected for multiple hypothesis testing using the
FDR [2], are presented in Table 2. With corrected p-values ranging from 0.10 to 1, deregulation
scores are no longer associated with CNA.
Subtypes
BaSq Lum LumI LumP NE
-2 -1 1 2 -2 -1 1 2 -2 -1 1 2 -2 -1 1 2 -2 -1 1 2
1 0.81 0.28 1 1 1 1 1 1 0.25 0.10 0.60 1 1 1 1 1 1 1 1
Table 2: Corrected p-values for Student tests when comparing the distribution of the deregu-
lation scores between the diploid state (0) and each altered state (-2,-1,1,2) for each subtype.
Deregulated TFs. We finally apply Step 3 of our method to identify TFs involved in the
deregulation scores of the target genes, that is having a non-zero coefficient in B̂, as given in
Eq. (1). We then rank the TFs according to their number of non-zero coefficients across all
samples belonging to each specific subtype. Results are presented in Table 3.
Subtypes
BaSq Lum LumI LumP NE
TF %B̂ TF %B̂ TF %B̂ TF %B̂ TF %B̂
SPOCD1 92% ZNF268 91% TSHZ1 88% RARB 84% FAIM3 89%
ZNF382 86% HES2 80% ZNF354B 88% RFX5 84% SMARCA2 83%
RCOR2 86% TBX2 80% AR 85% CBFA2T3 83% RARB 78%
ATM 83% PRDM8 75% HES2 82% TBX18 81% ZNF235 78%
HABP4 83% TSHZ1 75% HTATIP2 81% TBX3 79% TBX2 72%
IRX3 82% ZNF354C 73% MAFG 80% PTRF 79% STAT3 72%
IFI16 79% RARB 70% ENO1 80% TBX2 70% HIF1A 72%
TEAD2 79% KLF13 70% TBX2 74% PPARG 76% THRA 72%
NOTCH4 79% SCML2 68% ZNF563 74% NCOR2 75% PIR 67%
SNAI2 79% SNAI3 68% IRX3 72% ZFP2 75% FOSL1 67%
Table 3: List of the 10 most important TFs for explaining the deregulation scores of their
targets and number of non-zero coefficients in B̂ (in %) across all samples from each subtype.
3.3 Discussion
Top TFs include biomarkers of bladder cancer. Among TFs of Table 3, we retrieve
characteristic genes of bladder cancer subtypes. For instance, SNAI2, which is deregulated
across 79% of the BaSq samples, is particularly well-known for its implication in EMT pathways
for cancer patients [7] and its capacity to discriminate between basal and luminal subgroups
[28]. The presence of NOTCH4 in BaSq samples is particularly interesting as it is part of
7Identification of Deregulated TFs in Bladder Cancer Champion, Chiquet, Neuvial, Elati, Radvanyi, Birmel
the NOTCH pathway, whose inactivation tends to promote bladder cancer progression [27].
Research works also focus on its implication on the basal subgroup [20]. Similarly, TBX2,
involved in all three luminal subtypes is an indicator of luminal cancers [8]. We can finally
emphasize the presence of PPARG in LumP, whose high level of expression is used to describe
luminal subtypes [6].
Deregulation is complementary to differential gene expression analysis Differen-
tial gene expression analysis consists in performing statistical analysis to discover quantitative
changes in terms of expression levels between groups. It is frequently used in cancer research to
identify genes with important changes between tumor and normal samples, called differentially
expressed genes (DEGs) [31].
We perform differential gene expression analysis using the R-package limma [31] on all sam-
ples from each subtype when comparing to samples from all other subtypes. We then verify
whether the identified DEGs are different from the deregulated TFs derived from our method
(Figure 4). To this aim, we use the following thresholds: a gene is called DEG for p-values
smaller than 0.01 whereas it is deregulated for a subtype as soon as it is deregulated (B̂ 6= 0)
for more than the 50% of the subtype samples. This threshold is purely arbitrary but is not
crucial, as the results remain almost the same with slight changes. As shown in Figure 4, except
for BaSq and LumP subtypes, more than the 70% of the identified deregulated TFs are not
differentially expressed, which means that our procedure does not only point to DEGs.
BaSq Lum LumI LumP NE
879 107 48 193 17 65 366 23 57 784 91 45 337 12 46
Figure 4: Venn Diagrams representing the number of DEGs (in pink), the number of deregulated
TFs identified by our method (in blue) and their intersection.
Conclusion
With the aim of understanding the deregulation processes in tumoral cells, we develop a 3-steps
strategy that measures the influence of TFs in the deregulation of genes in tumor samples. A list
of TFs characterizing given subtypes can then be established. Even if a biological experimental
validation should be done in future work, it seems that it can be used complementary to
differential gene expression analysis to point to potential biomarkers of cancers.
An open question, which has also to be tackled, is to determine in which extend the in-
formation carried by mutations can explain the deregulations. Mutation data are particularly
hard to explore in this context due to various reasons : first of all, mutations do not necessarily
affect gene expression. Secondly, in cancers, besides the most significant mutated genes, many
sequencing projects have shown that genes are mutated in less than 5% of the samples.
In this work, among the identified TFs of Table 3, we find ATM, which is highly deregulated
(83%) and mutated (15%) for BaSq samples. Mutations of ATM have been recently shown to be
associated with shorter survival in urothelial cancers [37]. As a preliminary result, we observe
that 95% of the mutated BaSq samples corresponds to non-zero B̂ coefficients (Table 4). This
8Identification of Deregulated TFs in Bladder Cancer Champion, Chiquet, Neuvial, Elati, Radvanyi, Birmel
table is unfortunately still too unbalanced to positively conclude for a significant association
but supplementary works need to be done to go further.
B̂ 6= 0 B̂ = 0
Non mutated 91 21
Mutated 18 1
Table 4: Confusion matrix indicating the association between mutation and deregulation status
B̂ for TF ATM across all 131 basal samples.
References
[1] P. Aldred, E. Hollox, and J. Armour. Copy number polymorphism and expression level variation
of the human alpha-defensin genes DEFA1 and DEFA3. Hum Mol Genet, 14(14):2045–2052, 2005.
[2] Y. Benjamini and Y. Hochberg. Controlling the false discovery rate: a practical and powerful
approach to multiple testing. J R Stat Soc Ser B Methodol, 57(1):289–300, 1995.
[3] I. Chebil, R. Nicolle, G. Santini, C. Rouveirol, and M. Elati. Hybrid method inference for the
construction of cooperative regulatory network in human. IEEE Trans Nanobioscience, 13(2):97–
103, 2014.
[4] J. Chiquet, Y. Grandvalet, and C. Ambroise. Inferring multiple graphical structures. Stat Comput,
21(4):537–553, 2011.
[5] J. Chiquet, Y. Grandvalet, and C. Charbonnier. Sparsity in sign-coherent groups of variables via
the cooperative-lasso. Ann Appl Stat, 6:795–830, 2012.
[6] W. Choi et al. Identification of basal and luminal subtypes of muscle-invasive bladder cancer with
different sensitivities to frontline chemotherapy. Cancer cell, 25(2):152–165, 2014.
[7] C. Cobaleda, M. Prez-Caro, C. Vicente-Dueas, and I. Snchez-Garcia. Function of the zinc-finger
transcription factor SNAI2 in cancer and development. Annu Rev Genet, 41:41–61, 2007.
[8] D. Dhawanet al. Comparative gene expression analyses identify luminal and basal subtypes of
canine invasive urothelial carcinoma that mimic patterns in human invasive bladder cancer. PLoS
One, 10(9):e0136688, 2015.
[9] M. Elati and C. Rouveirol. Unsepervised learning for Gene Regulation Network Inference from
Expression Data: a review. John Wiley and Sons, Inc., Hoboken, NJ, 2011.
[10] A. G. Robertson et al. Comprehensive molecular characterization of muscle-invasive bladder can-
cer. Cell, 171(3):540–556, 2017.
[11] A.L. Tarca et al. A novel signaling pathway impact analysis. Bioinformatics, 25(1):75–82, 2009.
[12] B. Kaczkowski et al. Transcriptome analysis of recurrently deregulated genes across multiple
cancers identifies new pan-cancer biomarkers. Cancer Research, 76(2):216–226, 2016.
[13] B.D. Lehman et al. Identification of human triple-negative breast cancer subtypes and preclinical
models for selection of targeted therapies. J Clin Invest, 121(7):2750–2767, 2011.
[14] C.J. Vaske et al. Inference of patient-specific pathway activities from multi-dimensional cancer
genomics data using paradigm. Bioinformatics, 26:i237–i245, 2010.
[15] E.I. Delatola et al. Segcorr: a statistical procedure for the detection of genomic regions of correlated
expression. BMC Bioinformatics, 18(1):333, 2017.
[16] J.S. Damrauer et al. Intrinsic subtypes of high-grade bladder cancer reflect the hallmarks of breast
cancer biology. Proc Natl Acad Sci USA, 111(8):3110–3115, 2014.
9Identification of Deregulated TFs in Bladder Cancer Champion, Chiquet, Neuvial, Elati, Radvanyi, Birmel
[17] M. Elati et al. Licorn: learning cooperative regulation networks from gene expression data. Bioin-
formatics, 23(18):2407–14, 2007.
[18] M. Vignes et al. Gene regulatory network reconstruction using bayesian networks, the dantzig
selector, the lasso and their meta-analysis. PloS one, 6(12):e29165, 2011.
[19] T. Picchetti et al. A model for gene deregulation detection using expression data. BMC Systems
Biology, 9:S6, 2015.
[20] A. Greife et al. Canonical notch signalling is inactive in urothelial carcinoma. BMC Cancer,
14:628, 2014.
[21] C. Guziolowski, A. Bourde, F. Moreews, and A. Siegel. Bioquali cytoscape plugin: analysing the
global consistency of regulatory networks. BMC Genomics, 10(1):244, 2009.
[22] W.E. Johnson, C. Li, and A. Rabinovic. Adjusting batch effects in microarray expression data
using empirical bayes methods. Biostatistics, 8:118–127, 2007.
[23] G. Karlebach and R. Shamir. Constructing logical models of gene regulatory networks by inte-
grating transcription factor-DNA interactions with expression data: An entropy-based approach.
J Comput. Biol, 19(1):30–41, 2012.
[24] M.A. Knowles and C.D. Hurst. Molecular biology of bladder cancer: new insights into pathogenesis
and clinical diversity. Nat Rev Cancer, 15:25–41, 2014.
[25] B. Liu, A. de la Fuente, and I. Hoeschele. Gene network inference via structural equation modeling
in genetical genomics experiments. Genetics, 178(3):1763–1776, 2008.
[26] Z. Liu, W. Canglin, H. Miao, and H. Wu. Regnetwork: an integrating database of transcriptional
and post-transcriptional regulatory networks in human and mouse. Database (Oxford), 2015, 2015.
[27] A. Maraver et al. Notch pathway inactivation promotes bladder cancer progression. J Clin Invest,
125(2):824–830, 2015.
[28] D.S. Mistry, Y. Chen, Y. Wang, and G.L. Sen. SNAI2 controls the undifferentiated state of human
epidermal progenitor cells. Stem Cells, 32(12):3209–3218, 2014.
[29] D.W. Nebert. Transcription factors and cancer: an overview. Toxicology, 181-182:131–141, 2002.
[30] R. Nicolle, F. Radvanyi, and M. Elati. Coregnet: reconstruction and integrated analysis of co-
regulatory networks. Bioinformatics, 31(18):3066–3068, 2015.
[31] M. E. Ritchie et al. limma powers differential expression analyses for RNA-sequencing and mi-
croarray studies. Nucleid Acids Res, 43(7):e47, 2015.
[32] The Cancer Genome Atlas. Comprehensive molecular characterization of urothelial bladder car-
cinoma. Nature, 507(7492):315–322, 2014.
[33] R. Tibshirani. Regression shrinkage and selection via the lasso. J R Statist Soc Ser B, 58(1):267–
288, 1996.
[34] F.S. Togneri et al. Genomic complexity of urothelial bladder cancer revealed in urinary cfDNA.
Eur J Human Genet, 24:1167–1174, 2016.
[35] O. Troyanskaya et al. Missing value estimation methods for DNA microarrays. Bioinformatics,
17(6):520–525, 2001.
[36] J.E. Yeh, P.A. Toniolo, and D.A. Frank. Targeting transcription factors: promising new strategies
for cancer therapy. Current Opinion in Oncology, 25(6):652–658, 2013.
[37] M. Yin et al. ATM/RB1 mutations predict shorter overall survival in urothelial cancer. Oncotarget,
9(24):16891–16898, 2018.
10You can also read