Analysis of Customers' Reactions to E-Commerce Companies Using Instagram Data
←
→
Page content transcription
If your browser does not render page correctly, please read the page content below
Proceedings

Analysis of Customers’ Reactions to E-Commerce Companies
Using Instagram Data †
Ekin Akkol

                                          Department of Management Information Systems, Izmir Bakircay University, Izmir 35665, Turkey;
                                          ekin.akkol@bakircay.edu.tr
                                          † Presented at the 7th International Management Information Systems Conference, Online,
                                             9–11 December 2020.

                                          Abstract: The aim of this study is to develop a web application that supports decision-making pro-
                                          cesses on subjects—such as customer relations management, marketing, and stock management—
                                          with data such as posts, comments, and likes from Instagram to four e-commerce companies. In this
                                          context, the data obtained from the Instagram accounts of e-commerce companies were recorded in
                                          a database after the pre-processing and classification stages. A web application has been developed
                                          that can support managers in their decision-making processes at operational, tactical, and strategic
                                          decision-making levels by visualizing the data recorded in the database.

                                          Keywords: social media analysis; web application; sentiment analysis; customer relationship man-
                                          agement; emoji

                                          1. Introduction
                                               Today, with the development of internet technologies, the use of platforms such as
                                          social media is increasing. Consumers stay in touch with other users and establish an in-
                                          teractive communication through social media platforms. Before or after purchasing a
                                          product or service, consumers who exchange ideas with other consumers and their con-
Citation: Akkol, E. Analysis of           tacts in online communities and social networks can be influenced by comments and posts
Customers’ Reactions to E-Commerce        to differentiate their purchasing decisions. There are many opportunities and threats for
Companies Using Instagram Data.           companies in the social media environment, where all kinds of positive and negative in-
Proceedings 2021, 74, 12.
                                          formation about them and their products can be disseminated rapidly, and most of them
https://doi.org/10.3390/
                                          are beyond the control of companies.
proceedings2021074012
                                                Everyday, consumers who are increasingly bringing the internet and social media
                                          into their daily routines produce useful data ready to be analyzed for companies, partic-
Published: 9 March 2021
                                          ularly on social media platforms. Social media helps companies to obtain data from an
Publisher’s Note: MDPI stays neu-
                                          audience that cannot be accessed by a conventional data collecting tool, a survey. The
tral with regard to jurisdictional        transformation of data into information will provide companies with a competitive ad-
claims in published maps and institu-     vantage; it will also help make decision-making processes simpler and more effective.
tional affiliations.                      Social media, which is a contact channel where people can express their thoughts and
                                          views; it offers companies the ability to learn about their goods and services quickly from
                                          current or future consumers’ opinions [1]. Customer-generated content provides a back-
                                          ground for people to evaluate products that affect their online purchasing decisions and
Copyright: © 2021 by the authors. Li-     shopping experiences [2].
censee MDPI, Basel, Switzerland.
                                                Companies, with the data obtained from social media, can seek answers to such ques-
This article is an open access article
                                          tions as "How can we understand that customer satisfaction has decreased?”, “How can
distributed under the terms and con-
                                          we find out what our customer says about our company?”, “How can we make sense of
ditions of the Creative Commons At-
                                          customers’ complaints?”, “How can we reach flexible and useful reports on brand image
tribution (CC BY) license (http://crea-
tivecommons.org/licenses/by/4.0/).
                                          and customer satisfaction?”. This study aims to develop a web application capable of ad-
                                          dressing all of these questions.

Proceedings 2021, 74, 12. https://doi.org/10.3390/proceedings2021074012                                        www.mdpi.com/journal/proceedings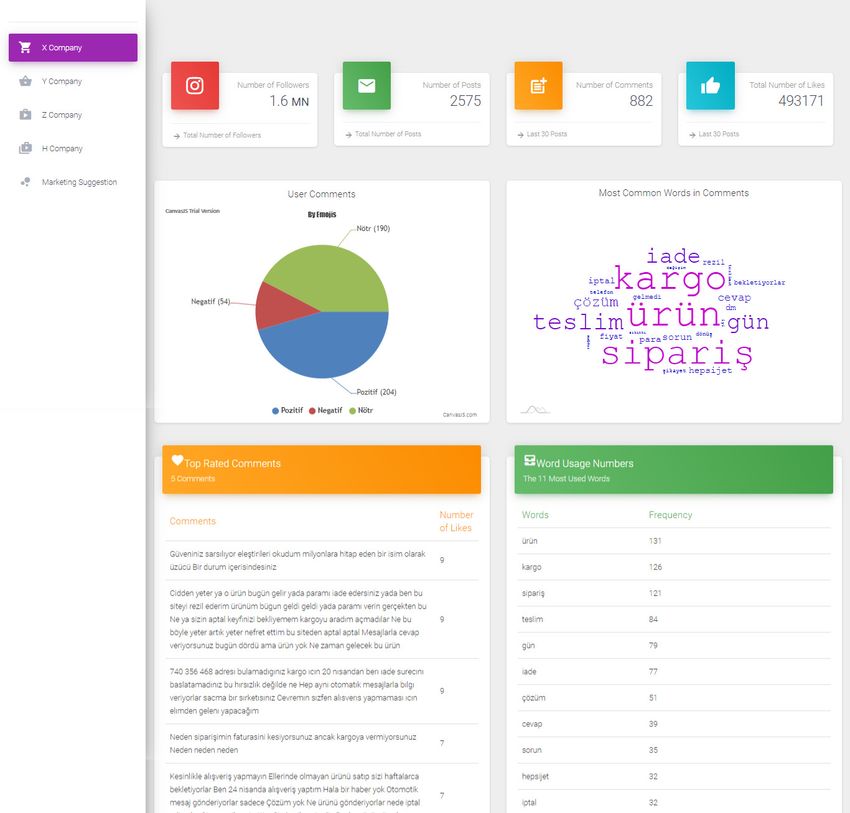
Proceedings 2021, 74, 12                                                                                         2 of 10

                                Information regarding current studies is given in the first section of this study, which
                           consists of three parts, and the differences and similarities of the method and analysis
                           with other studies are explained. In the second section, the methods used in the study are
                           explained in detail. The screenshots of the created web application were shared in the
                           third section, and details such as figures and tables were examined throughout the appli-
                           cation, and discussions were made about what benefits it could offer to companies. The
                           study results were discussed in the discussion section, and information was given about
                           what can be done in future studies.

                           2. Literature Review
                                 With the prevalence of social media, many studies are being carried out today to ex-
                           amine the users’ desires and feelings. Most of these studies are focused on users’ com-
                           ments and shares on social media; they are carried out using techniques such as text min-
                           ing and sentiment analysis.
                                 Tian et al. [3] claimed that, in addition to the texts, the emojis commonly used in
                           social media reflect the emotional state of the users and emojis should be analyzed sepa-
                           rately. In the study where Facebook was chosen as the social media platform, the com-
                           ments and reactions given to the posts under the posts of various media organizations
                           (BBC, CNN, Le Figaro, Die WELT, etc.) from four different countries (England, America,
                           France, and Germany) were analyzed by drawing them. In the study, 57 million reactions
                           and 8.4 million comments were used from a total of 21000 posts. When Facebook reactions
                           were analyzed, it was found that the “Like” reaction was used the most with 78.9%, fol-
                           lowed by “Love” (5.5%), “Angry” (5.4%) “Sad” (4.0%), “Haha” (3.7%), “Wow” (2.5%) re-
                           actions were given. When evaluating the emojis used, it was found that users in all coun-
                           tries used emojis that express positive emotions more often than emojis that express neg-
                           ative emotions. As a result, it turns out that there is a strong correlation between emojis
                           and reactions. The researchers concluded that this indicates that emojis can be used in
                           emotion analysis studies.
                                 Chen et al. [4] pointed out that textual sentiment analysis has been studied a lot in
                           the literature on platforms such as Twitter and Instagram, but the number of studies that
                           include emojis is very low. A model was built in this context in which emojis are also used
                           in the study of the emotion analysis. The sentences in which the emojis are used are cate-
                           gorized by the emotions they represent, and the machine was taught the emoji is used in
                           the sentences written with which emotion. In the study in which LTSM (long-term short
                           memory) neural network architecture was used, it was observed that two-way emotion
                           analysis using emojis performed better with higher success rates compared to other stud-
                           ies.
                                 In their research, Akın and Şimşek [5] aimed to gather the audience views of a tele-
                           vision channel on social media, to obtain useful information for the channel and to sup-
                           port decision-making processes. For this purpose, the Twitter messages sent about the
                           programs on the channel between November and June 2017 were obtained using the Twit-
                           ter API. The tweets collected were analyzed with the adaptive dictionary-based emotion
                           analysis algorithm by passing through the data pre-processing stage. The analyzed tweets
                           were examined together with the rating values of the channel and the relationship be-
                           tween them was tried to be determined. As a result, it has been observed that negative
                           tweets are associated with the decrease in rating values, while positive and neutral tweets
                           are associated with the increase in ratings. It has been mentioned within the scope of the
                           study that channels may also base their decisions on whether or not the programs will
                           continue to broadcast, based on social media messages. Furthermore, it was pointed out
                           that different results can be obtained in future studies by assessing the dominant elements
                           by analyzing the content of the messages not just in terms of emotion.
                                 In their research, He et al. [6] emphasized that companies need to track and evaluate
                           not only the customer-generated content on their own social networking platforms, but
                           also text information on their competitors’ social networking pages in order to improve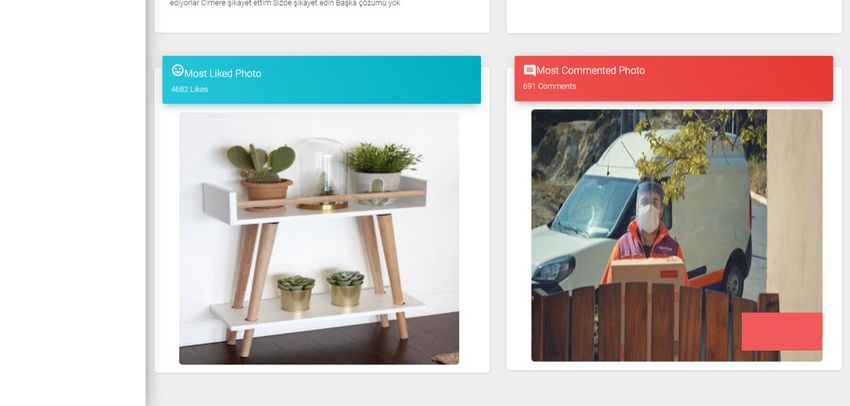
Proceedings 2021, 74, 12                                                                                         3 of 10

                           competitive advantage and accurately assess the competitive environment of businesses.
                           Three large pizza companies were chosen in this case, and messages sent to businesses via
                           Facebook and Twitter were collected and analyzed. Incoming messages are grouped as
                           positive, negative, and neutral and it is aimed to contribute to the decision-making pro-
                           cesses of companies. It has also been mentioned that reviewing each other’s data would
                           contribute to the benchmarking process for businesses. The analyzes within the scope of
                           the study were carried out using text mining methods, and the SPSS Clementine text min-
                           ing tool was used for analysis. Findings from this research suggest that social media plays
                           an important role in maintaining a positive customer relationship.
                                 In their study, Ghiassi et al. [7]—using n-grams and statistical analysis—introduced
                           an approach to supervised feature reduction to develop a specific Twitter lexicon for sen-
                           timent analysis. They created the Twitter specific dictionary with brand-specific terms for
                           tweets about the brand. The dictionary created consists of 187 features. In addition, the
                           researchers added negative and positive emojis to their studies in order to increase the
                           success rate and achieve better analysis results. The developed dynamic artificial neural
                           network model and support vector machines from traditional methods were compared
                           and it was determined that the developed brand-specific system gave better results. In
                           addition, unlike other studies, it has been observed that the use of emojis in emotion anal-
                           ysis increases the accuracy of the study.
                                 By analyzing symbols called emotion tokens, including emotion symbols (e.g., emot-
                           icons and emoji ideograms) in his research, Wolny [8] focused on Twitter messages. In the
                           study, it was mentioned that tweets are short and informal messages and the importance
                           of emojis in emotion analysis was emphasized. Study explained how to build a emotion
                           classification system architecture. As a result, It is thought that studies that include ex-
                           pressions such as emojis will yield better results.
                                 Xu et al. [9] aimed to examine customer satisfaction and dissatisfaction regarding the
                           features of hotel products and services based on online customer text reviews. In the
                           study, using text mining and latent semantic analysis (LSA), the main features that in-
                           crease customer satisfaction and dissatisfaction with hotel products and service features
                           were determined. In addition, the effects of travel goals, hotel types, star rating, and edi-
                           tor’s suggestions on customers’ perceptions of the properties of hotel products and ser-
                           vices were analyzed using regression analysis. As a result, four key features that increase
                           customer satisfaction (staff, room, location, and value) and five key features that affect
                           customer dissatisfaction were obtained (value, room, staff, facilities and facility, opera-
                           tional problems). In addition, the study found that among hotels with different star levels,
                           customer satisfaction, and dissatisfaction with product and service features differ signifi-
                           cantly.
                                 In the light of all these studies, it has been observed that texts and emojis obtained
                           from social media have very useful results in the scope of sentiment analysis and infor-
                           mation extraction. It is striking that the main purpose of the studies is to test the methods
                           and compare the success rates. Reporting the analysis to managers through dashboards,
                           however, can lead to the emergence of useful systems that can be used in real life. As
                           evidenced by the literature studies, the study developed in this direction was enriched
                           with a dashboard design and focused on emojis and user reactions on social media. As a
                           result, it is expected that the designed system will both support companies in their deci-
                           sion-making processes and add value to companies as a result of easily seen negative
                           comments on customer relationship management.

                           3. Materials and Methods
                                Within the scope of the study, Waterfall SDLC model steps, which are frequently
                           used in software development, were followed. Every phase comes after a phase is com-
                           pleted in this model, and tasks can be divided according to phases. The output of one
                           phase becomes input of the next phase so in the next step we have the option of revisiting
                           phases [10]. The model used in this study is shown in Figure 1.
Proceedings 2021, 74, 12 4 of 10
Figure 1. Waterfall model [11].
First of all, system requirements were determined. In line with the purpose of the
study, what kind of information would be required has been thoroughly analyzed. Later,
in the design process, it is technically designed how a software solution can meet these
needs. The designed application development process is shown in Figure 2.
Figure 2. Application development process.
The web application was developed step by step according to this application devel-
opment process. First, Instagram posts from the four leading e-commerce companies op-
erating in Turkey, comments from posts and likes, number of followers, data such as the
number of posts were taken in the csv extension using the programming language JavaS-
cript in the application development process. At the same time, all the images of the
brands selected in the categories of shoes, bags and watches and the number of likes re-
ceived for those photos were collected for the title of ‘marketing suggestion’.
The text data obtained using the Python programming language was subjected to
various data processing and classification stages in the second and third stages of the ap-
plication development process and recorded in the database. Emojis were categorized as
positive, negative, and neutral for the emoji analysis conducted within the scope of the
study at this stage, where the data is classified and also prepared for visualization (Figure 3).
The library “emoji” was used in order to recognize emojis in the Python programming
language. The emoji numbers obtained from the texts were ready to be recorded in the
database as a result of the classification process. The process of classifying the emojis and
counting positive, negative and neutral emojis in the database was also made for the posts
of four e-commerce companies.
Figure 3. The process of categorizing emojis.Proceedings 2021, 74, 12 5 of 10
Another process performed at this stage is word counting in order to create word
cloud and word frequency tables to be displayed on the application. Before the words
were counted and recorded in the database, text data was pre-processed. Both punctua-
tion marks and emoji were removed from the data as part of the preprocessing step and a
text-only file was obtained. Later, the frequency of passing words in this text file were
obtained with an algorithm written using the Python programming language and made
ready to be saved in the database.
At this point, in order to reveal analyzes according to the number of likes of the com-
ments posted, the comments and the number of likes collected from Instagram accounts
were filtered from the extracted data and recorded in the database. At the same time, the
data of the number of photos and likes for the title of “marketing suggestion” were rec-
orded in the database.
In the fourth stage of the application development process, PHP is used in the back-
end part of the web application developed to report the data recorded in the database to
the managers. In the front-end part, JavaScript, HTML, and CSS are preferred.
A system was introduced in the dashboard stage, which is the last step of the appli-
cation development process, to provide managers with various graphics, images, and in-
formation in a structure that can provide support for customer relationship management,
marketing, and decision making. The study was conducted by collecting and analyzing
user responses (comments and likes) that arrived on the Instagram pages of four e-com-
merce companies selected for the application. Additionally, a marketing recommendation
page was created from the Instagram accounts of selected major shoe, bag and watch man-
ufacturers with the posts and number of likes. During the design process of the applica-
tion, care was taken to develop a user-friendly interface as much as possible, using simple
graphics that direct the manager directly to the details instead of complex structures.
After the application development process is over, database relationships, whether
the code blocks work correctly, and whether the graphics are suitable for the purpose were
tested and the application was finalized.
4. Results
The number of comments and likes were collected from four e-commerce companies
operating in Turkey selected with this study on the Instagram accounts and different anal-
yses were made from this information. In addition to these, the study also included the
posts of major shoe, bag and watch companies as well as the number of likes of these
posts. Analyzes are shown on a dashboard with graphics and figures that are sufficiently
easy for managers to understand for successful reporting. The developed web application
is composed of five separate pages and two parts.
4.1. E-Commerce Companies
The study was carried out on real e-commerce companies’ Instagram data and the
company names were kept confidential (They were named as X Company, Y Company,
Z Company, H Company). In the first part of the application, which consists of four menu
titles, information about the total number of followers, the total number of posts, the total
number of comments in the last 30 posts, the total number of likes in the last 30 posts,
sentiment analysis of user comments according to emojis, the word cloud and list of the
most used words in the comments, the most liked comments and number of likes, the
most liked photo, and the most commented photo were included.
The total number of followers, the total number of posts, the total number of com-
ments in the last 30 posts, the total number of likes in the last 30 posts indicate how much
interaction companies on social media have received. Companies have the ability to see
the social media activities of both their own and competitor companies based on this in-
formation. There are a total of 38 million Instagram users in Turkey, according to Digital
2020 reports [12], and so the numbers here are very critical for companies. The highProceedings 2021, 74, 12 6 of 10
number of likes and followers can be proof that the company is on the right track. At the
same time, by analyzing the strategies of businesses with a high number of likes and fol-
lowers among other companies, the company can change its social media management
style.
At the sentiment analysis of user comments based on emojis and the word cloud of
the most used terms in comments graphics, a pie chart shows how many positive, nega-
tive, and neutral comments the companies get on their Instagram account. In this way,
companies will be able to measure customer satisfaction. In addition, by seeing the num-
ber of words used, the reasons for this satisfaction or dissatisfaction will be analyzed. With
these two graphics, it is aimed to make both sentiment analysis and hidden information
extraction. When looking at the graphics, users mostly comment with positive and neutral
feelings, although it varies according to the company, and the words such as “product”,
“order”, “cargo”, “return”, “did not come”, “solution”, “money”, “victim” has been used.
According to these words, companies have the chance to see what kind of issues custom-
ers are complaining about or satisfied with. For example, for X company, it is possible for
the managers to comment that there may be some problems with the delivery and return
of the products in general.
In the graph of the most liked comments and the number of likes, it is possible for
the company to see the most supported comments among users. In this way, different
policies can be developed by performing a satisfaction analysis according to the content
of these comments supported by many of the customers. In addition, comments on other
companies’ posts can be analyzed to see more clearly what might cause customers to react
or complain. One of the most important features of the system is that it allows comparison
and clearly reveals the data of competitors.
Managers were enabled to see the photos with the most reactions in the most liked
photo and the most commented photo section. Managers can organize various campaigns
for similar products by looking at the most liked photo, use them visually in advertise-
ments, or take similar actions. When analyzing the photos of the four e-commerce com-
panies that received the most likes and comments, it was seen that the customers reacted
more to the photos about national values, social responsibility projects and discounts. Ac-
cordingly, companies paying more attention to national days than they normally do will
be a factor that will increase brand value in the eyes of customers.
The part of the web application designed within the scope of the study for X Com-
pany is shown in Figure 4. All of the pages designed for companies have a standard struc-
ture and only the data changes.Proceedings 2021, 74, 12 7 of 10
Figure 4. Application interface for X Company.Proceedings 2021, 74, 12 8 of 10
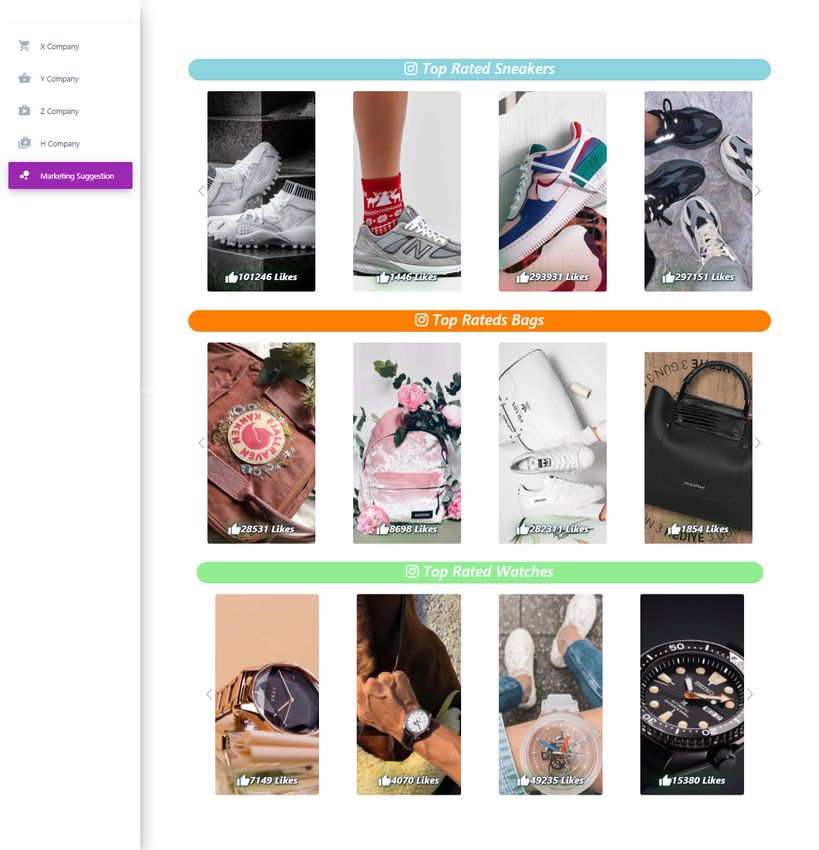
4.2. Marketing Suggestion
On the “Marketing Suggestion” page, the second section, the most liked sneakers,
bags and watches of five leading brands selected for each category were presented to the
manager. The marketing suggestion page has been developed to offer marketing sugges-
tions to e-commerce companies, unlike other pages. The main purpose of this page is to
reveal the most popular products of the identified big brands on Instagram and to enable
e-commerce companies to follow policies regarding those products and products with
similar designs. By analyzing these products, e-commerce companies can make various
campaigns, discounts, advertisements and reach more sales values by focusing on prod-
ucts similar to these products in determining the product range they will sell. This page
will be able to contribute not only to e-commerce companies, but also to stores affiliated
with these companies, and even companies that sell these products at retail or supply
products from abroad. Interface of the marketing suggestion page is shown in Figure 5.
Figure 5. Interface of marketing suggestion page.
5. Discussion
Today, the use of social media has become quite common and it has become inevita-
ble that social media analysis will be included in processes such as customer relations
management, especially for organizations that sell without a physical store such as e-com-
merce companies. It is thought that a web application developed with social media dataProceedings 2021, 74, 12 9 of 10
will benefit companies’ decision-making processes. In this context, Instagram data of four
major e-commerce companies selected within the scope of the study were obtained and a
web application was developed with analyzes that could be useful to companies. In addi-
tion, a section called ‘marketing suggestion’ has been added to this web application and
it is aimed to support companies in terms of marketing.
Many analyses were included in the web application, and the goal was to clearly state
the customers’ feelings and opinions, the agenda issues and their company expectations.
It was desired that the web application be able to report the customer’s expectations or
complaints to the manager in the most optimal way with data, figures, and tables. In ad-
dition to simplicity and comprehensibility, easy usability has also been prioritized in the
design of the application.
With the application, decision makers will have the opportunity to understand the
feelings and thoughts of the customers in a very short time and have the opportunity to
easily access hidden information that is normally impossible to see at first glance. Alt-
hough it is not possible for companies with millions of followers to pay attention, among
thousands of comments, to the problems or suggestions of all their customers, the most
used words and even the most supported messages can be shown thanks to this system.
While this will improve the efficiency of the management process for customer relation-
ships, it will also save time and ease of use.
The application contains the data of many companies. This can make a great contri-
bution to companies’ benchmarking process. Competitors in the same sector have the op-
portunity to generate a competitive advantage by analyzing the reactions and expecta-
tions of each other’s customers. The application, which also allows comparison with com-
petitors, aims to support decision-makers in this sense. Companies will be able to make
various comments from the visualized data on the application and also use social media
data to determine company policies.
In future studies, developing an application by extracting data not only from Insta-
gram, but also from other social media platforms, and developing an expert system that
provides not only visualized graphics but also advice to the manager with predictive anal-
ysis will make greater contributions to the decision-making process. In addition, by mak-
ing the same analysis with the data collected from other social media platforms, it can be
discussed whether customers give similar reactions on different social media platforms,
and which social media platform data will be used in the customer relationship manage-
ment process will provide maximum benefit. In addition to all of these, the scope of the
study can be extended by adding new companies to the existing system developed by
selecting four companies.
Funding: This research received no external funding.
Conflicts of Interest: The authors declare no conflict of interest.
References
1. Agrawal, D.; Bernstein, P.; Bertino, E.; Davidson, S.; Dayal, U.; Franklin, M.; Dayal, M.; Franklin, J.; Gehrke, L.; Jagadish, H.V.
Challenges and opportunities with big data. A community white paper developed by leading researchers across the United
States. Comput. Res. Assoc. 2012, 5, 34–43.
2. Lin, X.; Li, Y.; Wang, X. Social commerce research: Definition, research themes and the trends. Int. J. Inf. Manag. 2017, 37, 190–
201.
3. Tian, Y.; Galery, T.; Dulcinati, G.; Molimpakis, E.; Sun, C. Facebook sentiment: Reactions and emojis. In Proceedings of the Fifth
International Workshop on Natural Language Processing for Social Media, Valencia, Spain, 3 April 2017; pp. 11–16.
4. Chen, Y.; Yuan, J.; You, Q.; Luo, J. Twitter sentiment analysis via bi-sense emoji embedding and attention-based LSTM. In
Proceedings of the 26th ACM international conference on Multimedia, Seoul, Korea, 26 October 2018; pp. 117–125.
5. Akın, B.; Şimşek, U.T.G. Sosyal Medya Analitiği ile Değer Yaratma: Duygu Analizi ile Geleceğe Yönelim. Mehmet Akif Ersoy
Üniversitesi İktisadi Ve İdari Bilimler Fakültesi Derg. 2018, 5, 797–811.
6. He, W.; Zha, S.; Li, L. Social media competitive analysis and text mining: A case study in the pizza industry. Int. J. Inf. Manag.
2013, 33, 464–472.Proceedings 2021, 74, 12 10 of 10
7. Ghiassi, M.; Skinner, J.; Zimbra, D. Twitter brand sentiment analysis: A hybrid system using n-gram analysis and dynamic
artificial neural network. Expert Syst. Appl. 2013, 40, 6266–6282.
8. Wolny, W. Emotion analysis of twitter data that use emoticons and emoji ideograms. In Information Systems Development:
Complexity in Information Systems Development—Proceedings of the 25th International Conference on Information Systems
Development, Katowice, Poland, 24–26 August 2016.
9. Xu, X.; Wang, X.; Li, Y.; Haghighi, M. Business intelligence in online customer textual reviews: Understanding consumer per-
ceptions and influential factors. Int. J. Inf. Manag. 2017, 37, 673–683.
10. Trivedi, P.; Sharma, A. A comparative study between iterative waterfall and incremental software development life cycle model
for optimizing the resources using computer simulation. In Proceedings of the 2013 2nd International Conference on Infor-
mation Management in the Knowledge Economy, Chandigarh, India, 19–20 December 2013; pp. 188–194.
11. Bassil, Y. A simulation model for the waterfall software development life cycle. arXiv 2012, arXiv:1205.6904.
12. We Are Social. Available online: https://wearesocial.com/digital-2020 (accessed on 9 September 2020).You can also read