A Ketogenic Diet Increases Brain Insulin-Like Growth Factor Receptor and Glucose Transporter Gene Expression
←
→
Page content transcription
If your browser does not render page correctly, please read the page content below
0013-7227/03/$15.00/0 Endocrinology 144(6):2676 –2682
Printed in U.S.A. Copyright © 2003 by The Endocrine Society
doi: 10.1210/en.2002-0057
A Ketogenic Diet Increases Brain Insulin-Like Growth
Factor Receptor and Glucose Transporter
Gene Expression
CLARA M. CHENG, BRANDON KELLEY, JIE WANG, DAVID STRAUSS, DOUGLAS A. EAGLES, AND
CAROLYN A. BONDY
Developmental Endocrinology Branch (C.M.C., B.K., J.W., D.S., C.A.B.), National Institute of Child Health and Human
Development, National Institutes of Health, Bethesda, Maryland 20892; and Department of Biology (D.A.E.), Georgetown
University, Washington, DC 20057
A ketogenic diet suppresses seizure activity in children and in group. Brain IGF binding protein (IGFBP)-2 and -5 mRNA
juvenile rats. To investigate whether alteration in brain IGF levels were not altered by diet, but IGFBP-3 mRNA levels were
activity could be involved in the beneficial effects of the ke- markedly increased by the ketogenic diet while not altered by
togenic diet, we examined the effects of this diet on IGF system calorie restriction alone. Brain glucose transporter expres-
gene expression in the rat brain. Juvenile rats were fed one of sion was also investigated in this study. Glucose transporter
three different diets for 7 d: ad libitum standard rat chow (GLUT) 4 mRNA levels were quite low and not appreciably
(AL-Std), calorie-restricted standard chow (CR-Std), or a altered by the different diets. Parenchymal GLUT1 mRNA
calorie-restricted ketogenic diet (CR-Ket). The calorie- levels were increased by the CR-Ket diet, but endothelial
restricted diets contained 90% of the rats’ calculated energy GLUT1 mRNA levels were not affected. Neuronal GLUT3 ex-
requirements. The AL-Std diet group increased in weight, pression was decreased with the CR-Std diet and increased
whereas the two CR groups merely maintained their weight with the CR-Ket diet, in parallel with the IGF1R pattern.
during the 7-d diet. Glucose levels were significantly reduced These observations reveal divergent effects of dietary caloric
in both CR groups compared with the AL-Std group, but only content and macronutrient composition on brain IGF system
the CR-Ket group developed ketonemia. IGF1 mRNA levels and GLUT expression. In addition, the data may be consistent
were reduced by 30 –50% in most brain regions in both CR with a role for enhanced IGF1R and GLUT expression in ke-
groups. IGF1 receptor (IGF1R) mRNA levels were decreased togenic diet-induced seizure suppression. (Endocrinology 144:
in the CR-Std group but were increased in the CR-Ket diet 2676 –2682, 2003)
T HE KETOGENIC DIET is a high-fat, low-carbohydrate
diet that is used for treating refractory epilepsy in chil-
dren (1). Despite its long history of clinical use, it is still not
lator of glucose transport and utilization in the developing
murine brain (5) and therefore considered the possibility that
the ketogenic diet may enhance IGF1 activity, thereby im-
entirely clear how the ketogenic diet affects the brain and proving energy utilization and protection from seizures.
what mechanism(s) underlie its seizure-suppressive action. Supporting this possibility, expression of IGF system com-
Because both the ketogenic diet and fasting have beneficial ponents is regulated by nutritional factors in many different
effects on epilepsy, it has been assumed that they share a species and in many different tissues (6 – 8) including the
common mechanism in alleviating seizures. Because both the brain (9, 10). To investigate this hypothesis, we used an
ketogenic diet and fasting produce elevated blood levels of animal model to evaluate the effects of the ketogenic diet on
-hydroxybutyrate (-OHB) and acetoacetate, it has been brain IGF system expression. Bough et al. (11) demonstrated
speculated that ketosis may have a beneficial effect upon that rats fed a ketogenic diet had significant increases in
brain seizure resistance. In addition to ketosis, other changes levels of -OHB and seizure resistance compared with rats
associated with the ketogenic diet might affect seizure ac-
fed either a calorie-restricted normal diet or a normal diet, ad
tivity. For example, changes in energy metabolism, in lipid
libitum, with the greatest efficacy found in juvenile rats. The
composition of cell membranes, in the level of brain water
ketogenic diet was most effective when administered with a
content, and in brain pH have all been suggested to play a
modest (10%) calorie restriction.
role in seizure suppression (2, 3).
Reduction in brain energy supply, e.g. from systemic hy- Three different diets were used for our study: unrestricted
poglycemia or locally from reduced brain glucose trans- standard rat chow (Ad lib-Std), calorie-restricted standard
porter (GLUT) 1 expression (4), induces seizure activity by rat chow (CR-Std), and calorie-restricted ketogenic diet
impairing the ability of neurons to stabilize membrane po- (CR-Ket). The CR-Std group was included to account for
tential. We have previously shown that IGF1 is a key regu- any effects resulting from simply restricting calories. Ex-
pression of IGF1 system mRNAs, including IGF1, IGF
receptor, IGF binding protein (IGFBP)-2, -3, and -5, and
Abbreviations: Ad lib-Std, Unrestricted (ad libitum) standard rat chow
GLUTs 1, 3, and 4 were examined by in situ hybridization
diet; CR-Ket, calorie-restricted ketogenic diet; CR-Std, calorie-restricted
standard rat chow diet; GLUT, glucose transporter; IGFBP, IGF binding in brains of the three diet groups after 7 d on the experimental
protein; IGF1R, IGF1 receptor; -OHB, -hydroxybutyrate. diets. IGFBP-2, -3, and -5 (12–15) and GLUTs 1, 3, and 4
2676
The Endocrine Society. Downloaded from press.endocrine.org by [${individualUser.displayName}] on 08 July 2015. at 11:40 For personal use only. No other uses without permission. . All rights reserved.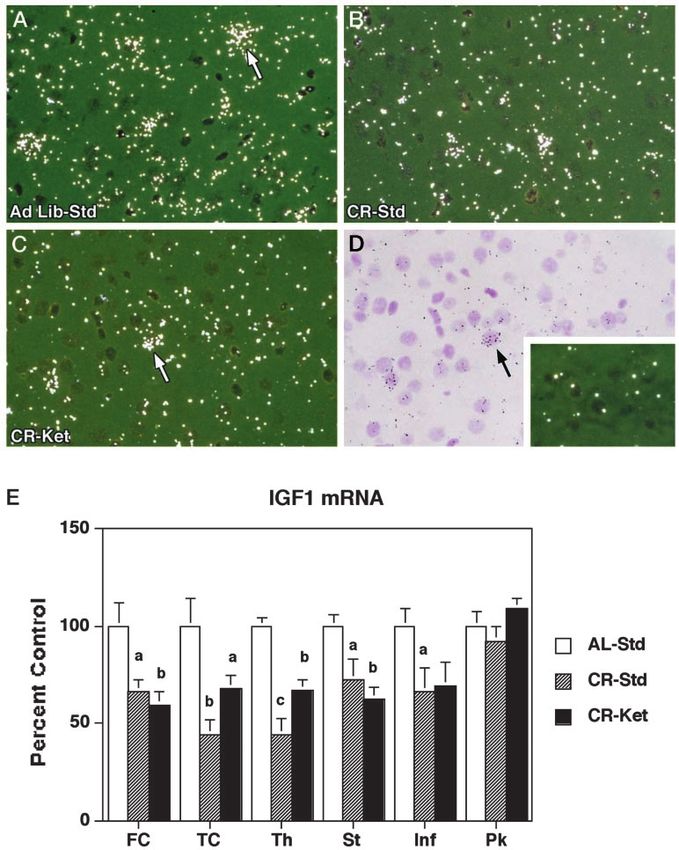
Cheng et al. • IGF Receptor, GLUT Gene Expression Endocrinology, June 2003, 144(6):2676 –2682 2677
(16 –18) were investigated because these are all relatively manually on individual cell under ⫻1000 magnification. Ten randomly
abundant in brain. selected Purkinje cells were analyzed on each section, and two sections
from each brain were analyzed.
Materials and Methods Statistics
Animals and diets
Differences between groups were compared by ANOVA followed by
The use of the rats in these experiments was approved by the George- Fisher’s least significant difference tests.
town University Animal Care and Use Committee. Eighteen male
Sprague Dawley rats at postnatal d 20 (P20) were randomly divided into Results
three groups of six each. Groups were weight-matched at the beginning
of the experiment. The control group received standard Purina 5001 rat
Diet effects on weight and systemic metabolism
chow (Purina Mills, St. Louis, MO) ad libitum (Ad lib-Std). Another group At the beginning of the experiment, all of the rats weighed
was also given standard Purina 5001 chow but was calorie restricted
(CR-Std), and the ketogenic group was also calorie restricted (CR-Ket).
approximately 40 g, and the groups average weights were
The CR-Std and CR-Ket diets were isocaloric. The calorie restriction was not different. Table 1 shows the effects of the diets on body
modest at 90% of calculated energy requirement. The CR-Ket diet (Bio- and brain weights. After the 7 d on their respective diets, the
Serv, Frenchtown, NJ; no. F3666) is composed of fat (78%), protein (10%), control (AL-Std) rats doubled in weight (85.8 g ⫾ 3.0),
carbohydrate (2%), and inert (10%). Purina 5001 chow is composed of fat whereas the calorie-restricted groups (CR-Std) and CR-Ket
(10%), protein (25%), carbohydrate (50%), and inert (15%). Further detail
constituents of the diet were summarized in the table of our previous both remained approximately the same weight (41.7 ⫾ 2.1 g
report (11). The following formula was used to calculate the daily calorie and 42.5 ⫾ 3.8 g). The differences in brain weight were much
intake of restricted diet rats during the experiment: (calorie needs, 0.3 less pronounced. Mean AL-Std brain weight was approxi-
cal/g) ⫻ (body mass in grams) ⫻ (energy value of food, 1 g/X Kcal) ⫻ mately 15% greater than mean brain weight in the CR-Ket
(0.9) where X ⫽ 3.588 for the rodent chow and 7.351 for the ketogenic
diets. For the CR-Std group, food pellets that contained the correct
and CR-Std groups (P ⬍ 0.01), whereas brain weights were
number of daily calories were prepared. For the CR-Ket group, a syringe not significantly different in CR-Ket vs. CR-Std groups.
was used to measure the desired amount of the semisolid diet (based on Blood glucose and ketones were measured after 7 d on the
calories) into a small dish that was frozen for storage and later provided diets (Table 1). As expected, the glucose levels were signif-
to the rats. Each day, the CR-Std and the CR-Ket diet rats were given one icantly reduced in the CR-Std group (by 29%, P ⬍ 0.05), and
pellet or one dish of food per animal. Diets were started after animals
were fasted for 6 h; rats were fed individually once a day between 1500 even more in the CR-Ket group (by 68%, P ⬍ 0.0001). Again
and 1600 h. All were provided with water ad libitum. as expected, the CR-Ket group had an abundance of ketones
After 7 d on their respective diets, all eighteen rats were weighed, then in the blood, whereas the values from the Ad lib-Std and
killed by decapitation after CO2 anesthesia. Brains were removed and CR-Std groups were not elevated. Ketonemia is used clini-
immediately frozen in dry ice. Trunk blood was collected for simulta-
neous glucose and ketone measurement. The brains were weighed and
cally as predictive of seizure resistance (1). All diets were
stored at –70 C. Blood ketones were assayed by measuring the levels of well tolerated, and all animals appeared healthy, active, and
-OHB present in blood plasma using a diagnostic kit (Sigma, St. Louis, well groomed.
MO). Samples were immediately transferred to 3-ml Li⫹-heparin va-
cutainers (Becton Dickinson and Co., Franklin Lakes, NJ) and centri- IGF1 and IGFR gene expression
fuged at 2000 ⫻ g for 5– 8 min. -OHB levels were determined spec-
trophotometrically using 20 l of plasma (GDS Technology, Elkhart, IN). IGF system mRNA levels were determined by in situ hy-
Blood glucose was measured by placing a drop of trunk blood on the test bridization on serial brain sections from each animal. IGF1
strip and inserting it into the One Touch Profile glucose meter (Lifescan
Inc., Johnson & Johnson, Milipitas, CA).
mRNA levels were reduced in both CR-Std and CR-Ket
groups by 30% or more in fore- and mid-brain regions in-
cluding frontal cortex, temporal cortex, thalamus, striatum,
In situ hybridization
and inferior colliculus (Fig. 1). There was no difference, how-
Sagittal sections of 10-m thickness were cut at –15 C and thaw- ever, in IGF1 mRNA levels in cerebellar Purkinje cells among
mounted onto poly-l-lysine-coated slides for histochemical analysis.
different diet groups. The two calorie-restricted diets had
The in situ hybridization protocol has been previously described in detail
(19). The generation of cRNA probes for GLUT1, 3, and 4 (20), IGF1 and opposite effects on IGF1R gene expression. The CR-Std diet
the IGF1 receptor (IGF1R) (21) and IGFBP-2, -3, and -5 (22) have been resulted in reduced IGF1R mRNA levels similar to the effect
detailed elsewhere. After hybridization, sections were exposed to film on IGF1 (Fig. 2). In contrast, the CR-Ket diet increased IGF1R
and later dipped in Kodak NTB2 emulsion for 7–21 d. Parallel sections mRNA levels in virtually all regions of the brain compared
were hybridized to sense probes and processed together with antisense
hybridized sections. The quantitation of hybridization signal was carried with both AL-Std and CR-Std diet groups (Fig. 2). IGFR
out in a blinded fashion. Hybridization signal was captured at ⫻200 mRNA levels were not appreciably altered affected by either
using a monochrome video camera. Signals were analyzed using NIH
image version 1.57 software in several brain structures, including tem-
poral cortex, frontal cortex, striatum, thalamus, inferior colliculus, and TABLE 1. Effects of diets on body and brain weight, serum
the granule cell layer of the cerebellum. For measurement of signal in glucose, and ketone levels
these neural structures, a grain counting program of the NIH Image
software was employed. For scoring signal specifically in microvessels AL-Std CR-Std CR-Ket
and Purkinje cells, high-power light microscopy was used to count
Body weight (g) 85.8 ⫾ 3.0 41.7 ⫾ 2.1 a
42.5 ⫾ 3.8a
grains within a constant area defined by an eyepiece reticule under direct
Brain weight (mg) 1.4 ⫾ 0.05 1.25 ⫾ 0.03a 1.27 ⫾ 0.02a
visualization. Background signal from a sense probe was subtracted
Glucose (mg/dl) 179 ⫾ 10.5 127 ⫾ 15.9a 57.5 ⫾ 7.2b
from these counts before further analysis. The signal for GLUT1 in
Ketones (mM) 0.27 ⫾ 0.001 0.23 ⫾ 0.03 4.4 ⫾ 0.67b
capillary endothelial cells was scored at ⫻400 under oil. Two sections
from each brain were scored, and four measurements were made in each The data represent means ⫾ SEM for six animals per group.
section; thus, eight measurements were obtained and meaned for each a
P ⬍ 0.01 compared with AL-Std.
animal. Hybridization signals overlying Purkinje cells were counted b
P ⬍ 0.0001 compared with AL-Std and CR-Std.
The Endocrine Society. Downloaded from press.endocrine.org by [${individualUser.displayName}] on 08 July 2015. at 11:40 For personal use only. No other uses without permission. . All rights reserved.2678 Endocrinology, June 2003, 144(6):2676 –2682 Cheng et al. • IGF Receptor, GLUT Gene Expression
FIG. 1. Effects of dietary manipulation on IGF1 mRNA expression in the rat temporal cortex. A–C, Representative dark-field micrographs of
IGF1 mRNA hybrid signals in brains from AL-Std (A), CR-Std (B), and CR-Ket (C) groups. D, Bright-field view of the section shown in C. The
inset dark-field micrograph in D shows background signal produced by sense probe hybridization. IGF1 mRNA is concentrated in neurons that
have relatively large nuclei (arrows). E, Quantitation of IGF1 mRNA levels in different brain regions. P ⬍ 0.05 (a) and P ⬍ 0.01 (b) compared
with AL-Std. FC, Frontal cortex; TC, temporal cortex, Th, thalamus; St, striatum; Inf, inferior colliculus; Pk, Purkinje cells.
diet treatment in the Purkinje and granule cell layers of Because the expression levels in these regions were very low
cerebellum. in both AL-Std and CR-Std rats, essentially equivalent to
hybridization background levels, the fold difference of in-
IGFBPs crease between CR-Ket and the other two groups cannot be
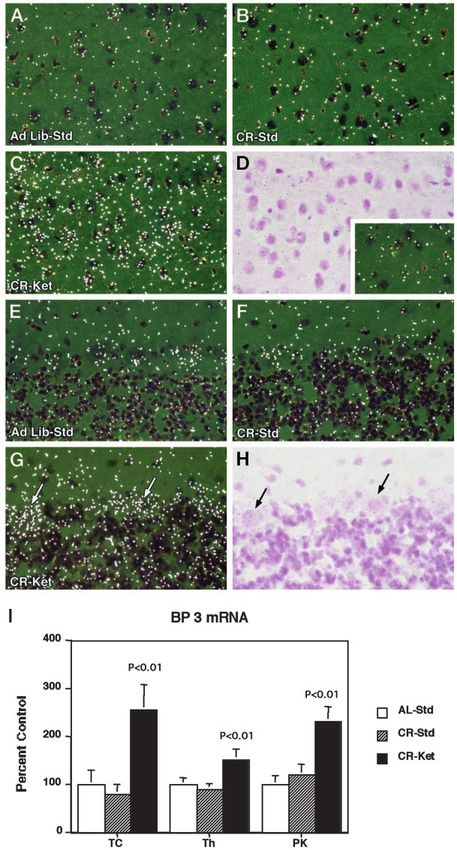
Brain IGFBP-2, -3, and -5 mRNA levels were compared in expressed. IGFBP-3 mRNA levels were not significantly af-
all diet groups. No changes were observed for IGFBP-2 or fected by the CR-Std diet (Fig. 3).
-5 (data not shown), but there was a marked increase in
GLUTs
IGFBP-3 mRNA levels in the brains of the CR-Ket group (Fig.
3). IGFBP-3 mRNA was increased in Purkinje cells of the GLUT1 and GLUT3 are two major facilitative GLUTs ex-
CR-Ket brains compared with AL-Std controls. IGFBP-3 pressed in murine brains with GLUT1 expressed by vascular
mRNA was also elevated in other brain regions, such as endothelium and glial cells, whereas GLUT3 is widely ex-
frontal cortex and striatum on CR-Ket diet (data not shown). pressed in neurons (16). Animals on the ketogenic diet
The Endocrine Society. Downloaded from press.endocrine.org by [${individualUser.displayName}] on 08 July 2015. at 11:40 For personal use only. No other uses without permission. . All rights reserved.Cheng et al. • IGF Receptor, GLUT Gene Expression Endocrinology, June 2003, 144(6):2676 –2682 2679
effects on brain gene expression and may provide insight into
the mechanisms of ketogenic diet-induced seizure suppression.
The proximate causes of the diet-induced changes in brain
gene expression remain open to conjecture. Caloric restric-
tion is well known to suppress IGF1 expression in peripheral
tissues (6 – 8), but the mechanism of this effect is unknown.
Observations on the effects of caloric restriction on brain
IGF1 expression are less consistent, with results apparently
dependent on developmental age and experimental protocol
(9, 10). It is possible that systemic glucose levels regulate IGF1
expression in brain, given that blood glucose levels were
reduced in both CR groups. However, brain IGF1 levels were
equally reduced or reduced to a greater degree in the CR-Std
group compared with the CR-Ket group (Fig. 1E), whereas
glucose levels were more profoundly reduced in the latter
group. This lack of correlation between systemic glucose
levels and brain IGF1 expression may indicate that another,
unidentified factor related to nutritional status influences
brain IGF1 expression. Alternatively, the hypoglycemic ef-
fect may be maximal in the CR-Std group.
The effects of diet on brain IGF1R and IGFBP expression
have not been previously investigated, to the best of our
knowledge. IGF1R mRNA levels were decreased with calorie
restriction in a carbohydrate-enriched diet, but increased
FIG. 2. Effects of dietary manipulation on IGF1R mRNA expression with an isocaloric fat-based diet. These effects do not seem
in the juvenile rat brains. A–C, Representative film autoradiographs obviously related to blood glucose levels that were reduced
of sagittal brain sections from animals in each of the three different in both the CR-Std and CR-Ket diets (Table 1), but it is
diet groups hybridized to radiolabeled IGF1R cRNA probes and ex- possible that qualitatively different effects may occur at very
posed to same piece of film. D, Background signal produced by sense
low glucose levels. Supporting these observations on the
probe hybridization. E, Summary of the quantitative results of the
different diets on IGF1R mRNA levels in by brain regions. a, P ⬍ 0.05; opposite effects of the ketogenic diet on IGF1 and IGF1R
b, P ⬍ 0.01; c, P ⬍ 0.001 compared with AL-Std. FC, Frontal cortex; expression, we have obtained similar results in a related
TC, temporal cortex, Th, thalamus; St, striatum; Inf, inferior collicu- model system. The suckling rat ingests a high-fat diet from
lus; Pk, Purkinje cells; GCL, cerebellar granule cell layer. maternal milk, in what is viewed as a natural model of the
ketogenic diet (23). The pups develop a marked ketosis
shortly after birth that persists during the whole suckling
showed small but significant increases in GLUT1 levels in the
period. We compared IGF1 and IGF1R mRNA and polypep-
brain parenchyma (by 26% compared with control, P ⬍ 0.01),
tide levels in pups that were weaned early (P16) to regular
with the CR-Std diet having modest effect on GLUT1 (Fig.
rat chow with littermates that continued nursing until P19
4A). GLUT1 mRNA was not, however, appreciably altered in
and found that IGF1 levels were lower and IGF1R levels
brain blood vessels by the different diets (Fig. 4A). GLUT3
higher in the suckling group (our unpublished data).
mRNA levels were decreased in the CR-Std group and in-
The present study has also found that brain IGFBP-3 ex-
creased in the CR-Ket group, similar to the pattern for IGF1R
pression is markedly increased in the context of the ketogenic
expression (Fig. 4B). GLUT4 is also expressed in neurons, but
diet. There is little information on the nutritional regulation
its expression levels are much lower and did not change
of IGFBP-3 expression (24). It is possible that ketone bodies
appreciably in response to the different diets (data not
or fatty acids, both elevated in the ketogenic diet, augment
shown).
both IGF1R and IGFBP-3 gene expression. IGFBP-2 and -5
The effects of the different diets on brain gene expression
were both considerably more abundant than IGFBP-3 in the
are summarized in Table 2.
juvenile rat brain, but neither was appreciably altered by the
study diets.
Discussion
The potential functional significance of these diet-induced
This study has shown that diet has important and complex changes in brain IGF system expression is open to specula-
effects on brain IGF system and GLUT gene expression. tion. The ketogenic diet causes a switch in brain metabolic
Calorie restriction reduces brain IGF1 and IGF1R mRNA pathways. Because glucose is largely unavailable as fuel or
levels in rats on a standard, carbohydrate-dominant diet, substrate, nonglycolytic pathways are brought into play us-
with no appreciable effect of this dietary manipulation on ing abundant fatty acids and ketone bodies. This diet is
brain IGFBP or GLUT gene expression. A diet with the same associated with an increased brain ATP/ADP ratio (25), and
calorie content composed primarily of lipid, however, in- enhanced metabolic activity revealed by magnetic resonance
creases brain IGF1R, IGFBP-3, and GLUT mRNA levels. spectroscopy (26). This is the first study to show increased
These novel findings demonstrate that the caloric content brain GLUT expression as a result of the ketogenic diet. The
and macronutrient composition of the diet exert independent effects of this diet on brain GLUT expression may be due to
The Endocrine Society. Downloaded from press.endocrine.org by [${individualUser.displayName}] on 08 July 2015. at 11:40 For personal use only. No other uses without permission. . All rights reserved.2680 Endocrinology, June 2003, 144(6):2676 –2682 Cheng et al. • IGF Receptor, GLUT Gene Expression
FIG. 3. Effects of diet on IGFBP-3 gene expression in tem-
poral (A–D) and cerebellar cortices (E–H). The dark-field
micrographs A–C are from anatomically matched regions
of cortical layers II–III, illustrated in the bright-field
shown in D. The inset micrograph in D shows nonspecific
hybridization from a sense probe. The dark-field micro-
graphs (E–G) are from anatomically matched regions of
the cerebellar cortex, illustrated in the bright-field micro-
graph in H. Arrows point to Purkinje cells. I, Quantitation
of IGBP3 mRNA in temporal cortex (TC), thalamus (Th),
and Purkinje cells (PK).
the marked reduction in systemic glucose levels seen in the induced increases in capillary but not parenchymal GLUT1
CR-Ket diet group because hypoglycemia promotes GLUT (30). The different observations are likely explained by major
expression (27–30). Neither GLUT1 nor GLUT3 mRNAs were methodological differences in the two studies. It is possible
altered by the modest 25% reduction in blood glucose pro- that GLUT3 expression was increased due to enhanced IGF
duced by the CR-Std diet, but both were increased by the activity in brain, as we have previously shown an association
CR-Ket diet, in which the reduction of blood glucose was between increased IGF1R and increased GLUT3 expression
more pronounced. We found GLUT1 to be increased in brain in the monkey brain (31). Although IGF1 mRNA levels were
parenchymal cells, but not in cortical microvasculature, in reduced, IGF1R and IGFBP-3 were both increased. The role
contrast to a previous study that found hypoglycemia- of locally produced IGFBPs with respect to IGF action is not
The Endocrine Society. Downloaded from press.endocrine.org by [${individualUser.displayName}] on 08 July 2015. at 11:40 For personal use only. No other uses without permission. . All rights reserved.Cheng et al. • IGF Receptor, GLUT Gene Expression Endocrinology, June 2003, 144(6):2676 –2682 2681
whereby diet composition regulates brain IGF system ex-
pression and to evaluate the functional consequences of these
changes on seizure susceptibility.
Acknowledgments
Received November 20, 2002. Accepted February 11, 2003.
Address all correspondence and requests for reprints to: Carolyn A.
Bondy, Building 10/10N262, 10 Center Drive, National Institutes of
Health, Bethesda, Maryland 20892. E-mail: bondyc@mail.nih.gov.
References
1. Swink TD, Vining EP, Freeman JM 1997 The ketogenic diet: 1997. Adv Pediatr
44:297–329
2. Schwartzkroin PA 1999 Mechanisms underlying the anti-epileptic efficacy of
the ketogenic diet. Epilepsy Res 37:171–180
3. Janigro D 1999 Blood-brain barrier, ion homeostatis and epilepsy: possible
implications towards the understanding of ketogenic diet mechanisms. Epi-
lepsy Res 37:223–232
4. Seidner G, Alvarez MG, Yeh JI, O’Driscoll KR, Klepper J, Stump TS, Wang
D, Spinner NB, Birnbaum MJ, De Vivo DC 1998 GLUT-1 deficiency syn-
drome caused by haploinsufficiency of the blood-brain barrier hexose carrier.
Nat Genet 18:188 –191
5. Cheng CM, Reinhardt RR, Lee WH, Joncas G, Patel SC, Bondy CA 2000
Insulin-like growth factor 1 regulates developing brain glucose metabolism.
Proc Natl Acad Sci USA 97:10236 –10241
6. Thissen JP, Underwood LE, Ketelslegers JM 1999 Regulation of insulin-like
growth factor-I in starvation and injury. Nutr Rev 57:167–176
7. Rabkin R 1997 Nutrient regulation of insulin-like growth factor-I. Miner
Electrolyte Metab 23:157–160
8. Naranjo WM, Yakar S, Sanchez-Gomez M, Perez AU, Setser J, LeRoith D
2002 Protein calorie restriction affects nonhepatic IGF-I production and the
lymphoid system: studies using the liver-specific IGF-I gene-deleted mouse
model. Endocrinology 143:2233–2241
9. Chowen JA, Goya L, Ramos S, Busiguina S, Garcia-Segura LM, Argente J,
FIG. 4. Effects of diet on GLUT1 (A) and GLUT3 (B) mRNA levels in Pascual-Leone AM 2002 Effects of early undernutrition on the brain insulin-
the juvenile rat brains. The ketogenic diet increases GLUT1 mRNA like growth factor-I system. J Neuroendocrinol 14:163–169
levels in the cortical parenchyma but not in brain blood vessels. Brain 10. Calikoglu A, Karayal A, D’Ercole A 2001 Nutritional regulation of IGF-I
GLUT3 mRNA levels are generally decreased by the CR-Std diet but expression during brain development in mice. Pediatr Res 49:197–202
increased by the CR-Ket diet. Abbreviations for brain regions are the 11. Bough KJ, Valiyil R, Han FT, Eagles DA 1999 Seizure resistance is dependent
upon age and calorie restriction in rats fed a ketogenic diet. Epilepsy Res
same as shown in the legends for Figs. 1 and 2. a, P ⬍ 0.05; b, P ⬍ 0.01.
35:21–28
12. Bondy C, Lee WH 1993 Correlation between insulin-like growth factor (IGF)-
TABLE 2. Summary of differential effects of diet on brain binding protein 5 and IGF-I gene expression during brain development. J Neu-
mRNA levels rosci 13:5092–5104
13. Lee WH, Bondy C 1993 Insulin-like growth factors and cerebral ischemia. Ann
IGF1 IGF1R IGFBP3 GLUT1 GLUT3 NY Acad Sci 679:418 – 422
14. Lee WH, Michels KM, Bondy CA 1993 Localization of insulin-like growth
CR-Std 2 2 — — 2 factor binding protein-2 messenger RNA during postnatal brain development:
CR-Ket 2 1 1 1 1 correlation with insulin-like growth factors I and II. Neuroscience 53:251–265
15. Lee WH, Wang GM, Yang XL, Seaman LB, Vannucci SI 1999 Perinatal
The arrows reflect the direction of change for brain mRNA levels
hypoxia-ischemia decreased neuronal but increased cerebral vascular endo-
compared with animals on the standard ad libitum diet. thelial IGFBP3 expression. Endocrine 11:181–188
16. Bondy CA, Lee WH, Zhou J 1992 Ontogeny and cellular distribution of brain
glucose transporter expression. Mol Cell Neurosci 3:305–314
known, but IGFBP-3 protects IGF1 from proteolysis and 17. El Messari S, Ait-Ikhlef A, Ambroise DH, Penicaud L, Arluison M 2002
clearance in the bloodstream, and it thus seems likely that Expression of insulin-responsive glucose transporter GLUT4 mRNA in the rat
brain and spinal cord: an in situ hybridization study. J Chem Neuroanat
brain IGFBP-3 production could augment local IGF1 effect by 24:225–242
protecting it from proteolysis. Thus, particularly in the con- 18. Apelt J, Mehlhorn G, Schliebs R 1999 Insulin-sensitive GLUT4 glucose trans-
porters are colocalized with GLUT3-expressing cells and demonstrate a chem-
text of increased IGF1R expression, there could be enhanced ically distinct neuron-specific localization in rat brain. J Neurosci Res 57:693–
IGF1 effect, despite a reduction in IGF1 production sug- 705
gested by decreased IGF1 mRNA levels. 19. Bondy CA 1991 Transient IGF-I gene expression during the maturation of
functionally related central projection neurons. J Neurosci 11:3442–3455
The ketogenic diet’s ability to suppress seizure activity 20. Chin E, Zhou J, Bondy C 1993 Anatomical and developmental patterns of
may be related to the increased IGF1R and GLUT1 and 3 gene facilitative glucose transporter gene expression in the rat kidney. J Clin Invest
expression described for the first time in the present study, 91:1810 –1815
21. Bondy C, Werner H, Roberts Jr CT, LeRoith D 1992 Cellular pattern of type-I
although further studies are required to establish that these insulin-like growth factor receptor gene expression during maturation of the
changes in IGF1R and GLUT mRNA levels are reflected by rat brain: comparison with insulin-like growth factors I and II. Neuroscience
46:909 –923
enhanced IGF1R and GLUT expression. GLUT1 deficiency 22. Zhou J, Bondy C 1993 Anatomy of the insulin-like growth factor system in the
results in a seizure disorder that is highly responsive to a human testis. Fertil Steril 60:897–904
ketogenic diet (32), and overexpression of GLUT1 protects 23. Nehlig A 1999 Age-dependent pathways of brain energy metabolism: the
suckling rat, a natural model of the ketogenic diet. Epilepsy Res 37:211–221
against seizure-induced neuron loss (33). Further study is 24. Underwood LE 1996 Nutritional regulation of IGF-I and IGFBPs. J Pediatr
required to elucidate the specific signaling pathways Endocrinol Metab(9 Suppl 3):303–312
The Endocrine Society. Downloaded from press.endocrine.org by [${individualUser.displayName}] on 08 July 2015. at 11:40 For personal use only. No other uses without permission. . All rights reserved.2682 Endocrinology, June 2003, 144(6):2676 –2682 Cheng et al. • IGF Receptor, GLUT Gene Expression
25. DeVivo DC, Leckie MP, Ferrendelli JS, McDougal Jr DB 1978 Chronic ketosis 30. Kumagai AK, Kang YS, Boado RJ, Pardridge WM 1995 Upregulation of
and cerebral metabolism. Ann Neurol 3:331–337 blood-brain barrier GLUT1 glucose transporter protein and mRNA in exper-
26. Pan JW, Bebin EM, Chu WJ, Hetherington HP 1999 Ketosis and epilepsy: 31P imental chronic hypoglycemia. Diabetes 44:1399 –1404
spectroscopic imaging at 4.1 T. Epilepsia 40:703–707 31. Cheng CM, Cohen M, Wang J, Bondy CA 2001 Estrogen augments
27. Boado RJ, Pardridge WM 2002 Glucose deprivation and hypoxia increase the glucose transporter and IGF1 expression in primate cerebral cortex.
expression of the GLUT1 glucose transporter via a specific mRNA cis-acting FASEB J 15:907–915
regulatory element. J Neurochem 80:552–554 32. Nordli Jr DR, De Vivo DC 1997 The ketogenic diet revisited: back to the future.
28. Duelli R, Kuschinsky W 2001 Brain glucose transporters: relationship to local Epilepsia 38:743–749
energy demand. News Physiol Sci 16:71–76 33. Gupta A, Ho DY, Brooke S, Franklin L, Roy M, McLaughlin J, Fink SL,
29. Lee DH, Chung MY, Lee JU, Kang DG, Paek YW 2000 Changes of glucose Sapolsky RM 2001 Neuroprotective effects of an adenoviral vector expressing
transporters in the cerebral adaptation to hypoglycemia. Diabetes Res Clin the glucose transporter: a detailed description of the mediating cellular events.
Pract 47:15–23 Brain Res 908:49 –57
The Endocrine Society. Downloaded from press.endocrine.org by [${individualUser.displayName}] on 08 July 2015. at 11:40 For personal use only. No other uses without permission. . All rights reserved.You can also read