FY 2018 Results Christopher Delbrück - CFO - 12 March 2019

Page created by Andrea Kim
 
CONTINUE READING
FY 2018 Results Christopher Delbrück - CFO - 12 March 2019
FY 2018 Results
Christopher Delbrück – CFO

12 March 2019
FY 2018 Results Christopher Delbrück - CFO - 12 March 2019
Agenda

1. Essentials

2. Financial Results 2018 and Outlook 2019

3. Appendix
FY 2018 Results Christopher Delbrück - CFO - 12 March 2019
Essentials – Goals for FY2018 reached,
dividend above outlook
                                                                  Executing strategy in still challenging environment
          Operations pushed
                                                                  Continuing efforts to finalize our large asset projects
                ahead
 FY2018

                                                                  First projects initiated in strategic growth areas

                                                                  Adj. EBIT 2018: €865m – within Q3 specified range
             Financial goals                                      Adj. FFO 2018: €756m – at higher end of outlook range
                achieved                                          Dividend proposal FY2018: €329m – above original
                                                                   guidance

                                                                  Fresh start with Fortum
               Managing the                                       Executing strategic growth projects and driving ESG1
                transition                                         initiatives ahead
 FY2019

                                                                  Managing European coal phase-out

                                                                  Adj. EBIT outlook: €550m - €850m
                   Outlook                                        Dividend: Aspiration to propose payout of €390m
                    2019                                           for FY2019
                                                                  Dividend policy2: On track of growth path towards 2020

          1. ESG - Environment, Social and Governance
          2. Dividend policy: CAGR 25% p.a. between FY 2016 and FY2020                 Uniper SE, Presentation FY 2018, 12 Mar 2019   3
FY 2018 Results Christopher Delbrück - CFO - 12 March 2019
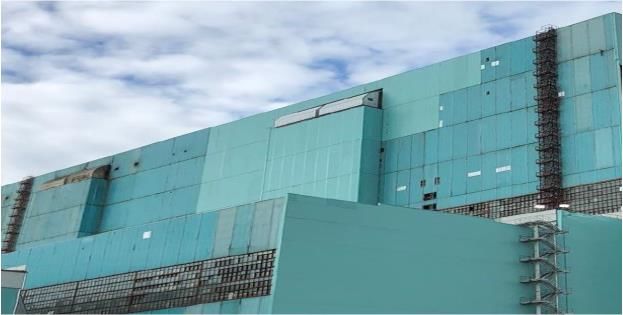
Commodity markets – Strong uptrend is
flattening
Electricity baseload forwards1                                Carbon trading prices2                               Gas forwards1
EUR/MWh                                                EUR/t CO2                                     EUR/MWh
 60                                                     25                                            25
              Germany
 50                                                     20
              Nordic
                                                                                                      20
 40                                                     15

 30                                                     10
                                                                                                      15
 20                                                       5                           EUA                                                   TTF

 10                                                      0                                            10
  Feb 17 Aug 17 Feb 18 Aug 18 Feb 19                     Feb 17 Aug 17 Feb 18 Aug 18 Feb 19            Feb 17 Aug 17 Feb 18 Aug 18 Feb 19

Electricity prices – flattening                        Towards coal-to-gas switching                  Volatile gas prices
 Price recovery with the tailwind of                   CO2 prices (EUA - EU Allowances)              Asian demand with rising impact on
  higher fuel and CO2 prices                             tripled in 2018                                European gas prices
 Weakening macroeconomic outlook                       CO2 prices reflect the elimination of         Revival of oil-to-gas price link with
  putting a damper on surging prices                     the surplus in allowances within the           more globalized gas markets
 Rising volatility with news from the                   revised EU ETS regime                         Europe in bullish mood by expecting
  political arena and weather related                   Logic of coal-to-gas switching seems           that coal-to-gas switching works
  impacts                                                to prevail                                    Year ended with mild weather and
                                                                                                        ample gas supplies

              1. Electricity baseload and gas prices: 2020 forwards
              2. EUA prices: Spot
              Source: Bloomberg, Uniper Market Analysis                                          Uniper SE, Presentation FY 2018, 12 Mar 2019     4
FY 2018 Results Christopher Delbrück - CFO - 12 March 2019
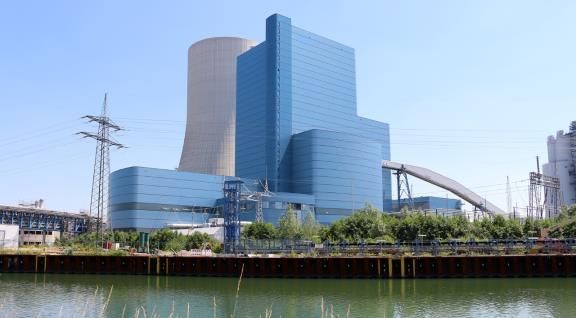
Energy policy – Germany’s coal consensus
awaits implementation
Germany: Coal phase-out plan1 Uniper: Solid German mix3                                                             Uniper: EBIT contribution
GW
120

 90

 60                                                                              10.2 GW                                                    €865m
 30

  0
                                                                                                        2018                                                    2018
           2018        2022 Plan        2030 Plan

      Hard coal   Lignite    Nuclear      Other 2               Hard coal     Lignite     Gas     Oil    Hydro                      Group     Fossil Germany

Phase-out with compensation                                Uniper with robust portfolio                               Limited contribution from coal
 Germany with challenging roadmap                          Uniper owns 4.6 GW of hard coal                           Fossil power earnings in Germany
  for coal to be phased-out until 2038                       and lignite power stations                                 still dominated by coal
 Roadmap for lignite and hard coal2:                       Downside protection with current                          Datteln IV coal-fired power station
      13 GW out until 2022                                  portfolio mix                                              as significant earnings contributor
                                                            Chance to increase cash flow from                          once up and running
      13 GW out between 2023 and 2030
                                                             existing gas fired power stations                         Promising outlook for rising gas
 Plan to operate with 17 GW of coal-
                                                            Exit path should give generators                           power earnings
  fired power stations by 2030
                                                             some optionality – including chance
 Uniper awaits negotiations with
                                                             for new investments
  governmental officials

                  1. According to Final report of Commission ‘Growth, Structural Change and Employment’
                  2. Dispatchable, excl wind and solar
                  3. Uniper’s German pro-rata capacity by the end of 2018, excl. Datteln IV coal power plant     Uniper SE, Presentation FY 2018, 12 Mar 2019          5
FY 2018 Results Christopher Delbrück - CFO - 12 March 2019
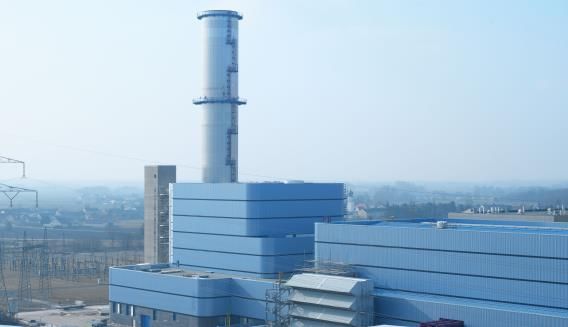
Germany’s coal phase-out – What’s next1

                          Feb
                          BMU2: draft of National
       Government

                          Climate Protection law 2050
                                 April                                                                                                           Year-end
                                 Federal Gov. with cornerstones on measures for                                                            National Climate
                                 climate targets 2030; Government/States starts                                                              Protection law
                                 negotiations on regional and structural support                                                                       2050

                                                                                                                               October
  European

                                                                                                                               New EU Commission
   Union

                                                                                                                               appointment
                                                      26 May
                                                      European                                                                                     11-22 Nov
                                                      Parliament election                                                                          COP 25
2019

                    Mar        Apr             May             Jun              Jul             Aug             Sep              Oct             Nov                Dec
       Generators

                                                   May / June
                                                   Federal Gov. starts bilateral discussions on
                                                   lignite and hard coal exit (with indicative
                                                   deadline until 30 June 2020)

                           1. Indicative timeline as recommended by Commission ‘Growth, Structural Change and Employment’
                           2. BMU - Federal Ministry for Environment, Nature Conservation and Nuclear Safety         Uniper SE, Presentation FY 2018, 12 Mar 2019         6
FY 2018 Results Christopher Delbrück - CFO - 12 March 2019
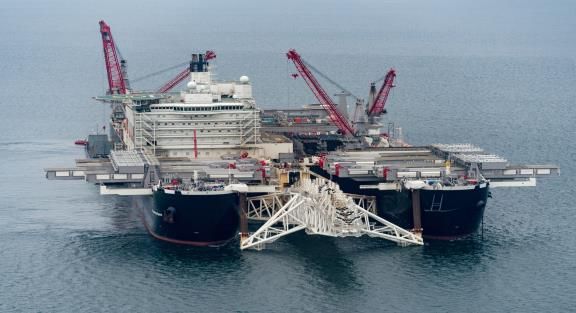
Large asset projects – Continuing efforts to
finalize projects
Datteln IV hard coal plant                          Berezovskaya III lignite plant               Nord Stream 2 pipeline project

Plant repair on track                                 Commissioning date ahead                     Pipe laying progressing well
 Dismantling of boiler walls executed                 Additional regulatory requirements,         Germany supports the projects as
 Pre-assembling of new parts at site                   e.g. extensive fire-coating                  part of a broad EU gas sourcing
 Sticking to our timeline - commercial                Commercial operation date (COD)             EU pushed ahead with plan to
  operation date planned for summer                     expected in Q4 2019                          include offshore pipelines in Gas
  2020                                                 Repair project: RUB15bn capex to be          Directive
 Budget of €0.2bn earmarked to                         spent until completion                      Despite political headwinds, key
  finalize the project                                                                               project parameters still hold
 Total investment: above €1.5bn                                                                    Project on track with 2x300 km of
                                                                                                     pipes laid in the Baltic Sea

              Source photos: Uniper, Unipro, Nord Stream 2 public photo stock                 Uniper SE, Presentation FY 2018, 12 Mar 2019   7
FY 2018 Results Christopher Delbrück - CFO - 12 March 2019
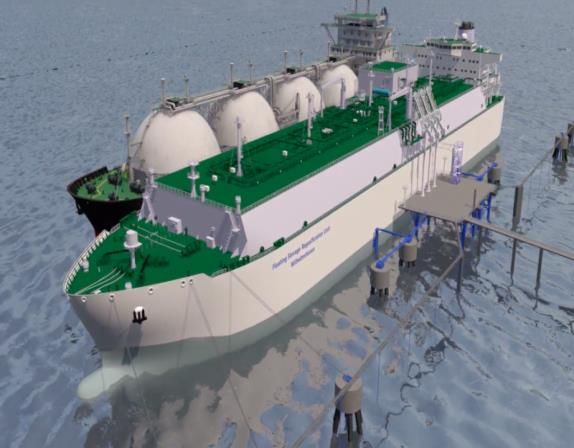
Growth initiatives – Projects initiated and
project pipeline filling up
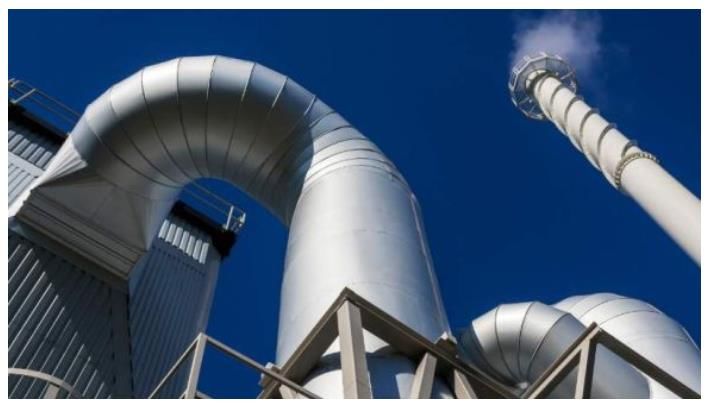
LNG terminal Wilhelmshaven                           Scholven gas CHP plant                      Irsching gas CHP plant

Project planning in advanced                          Flagship project for Industrial              Contributing in new German
stage                                                 Solutions                                    security mechanism
 Germany supports construction of two                 New gas power station to serve              Power plant on stand-by to serve as
  LNG regasification terminals                          industrial cluster in the Ruhr area          a “safety cushion” by supplying
 Uniper‘s solution as enabler offers                  Long-term contract to supply                 power in special emergency
  favorable conditions                                  electricity, process steam and heat         Long-term service contract with grid
 Provisional agreement with FSRU1                     114 MW electricity & 140 MW heat             operator TenneT
  provider MOL and Exxon Mobil (long-                   CHP project                                 300 MW CHP project with planned
  term offtaker) signed                                Planned commercial operation date            commercial operation date in
 Project could be executed until H2                    at the end of 2022                           October 2022
  2022                                                 Investment budget: €0.2bn                   Investment budget: up to €0.2bn

              1. FSRU - Floating Storage Regasification Unit
              Source photos / illustration: Uniper                                            Uniper SE, Presentation FY 2018, 12 Mar 2019   8
FY 2018 Results Christopher Delbrück - CFO - 12 March 2019
ESG – Our way going forward

               Enabling the energy transition due to                               Providing a safe work environment and
               excellent position in gas and hydro                                 ensuring equal opportunities
                                                                                    Committed to maintain a 1.75 combined TRIF1

                                                                      Social
               t CO2                                                                 threshold at the Group level through 2019
                80                                                                  About 12,000 employees reflecting a variety of
                                                                                     nationalities, cultures and generations
                60
                                                                                    Target to have women account for at least 25%
                                                                                     of Uniper’s top-level executives by 2022
 Environment

                40

                20

                 0                                                                 State of the art governance structure
                           2016               2017             2018
                                                                                   and compliance principles
                              Group       European Generation

                                                                      Governance
                                                                                    Ensuring diversity and independence in the
                Monitoring and further reducing Uniper’s                            supervisory board, e.g. 30% female supervisory
                 carbon emissions while simultaneously                               board members
                 ensuring security of energy supply                                 Remuneration system aligns management and
                Group-wide carbon intensity target of 500g of                       shareholder interest
                 CO2 per kWh (on average) through 2020                              Continuing to strengthen compliance culture
                No investments in new coal-fired power plants                       and protecting the business from corruption
                 after the commissioning of Datteln IV                               risks

                1.TRIF - Total recordable incident frequency                            Uniper SE, Presentation FY 2018, 12 Mar 2019   9
Agenda

1. Essentials

2. Financial Results 2018 and Outlook 2019

3. Appendix

                                             10
Key financials – FY 2018 fully in line with latest
guidance
Adj. EBIT(DA)                           Operating Cash Flow, Adj. FFO                      Economic Net Debt
€bn      1.7                             €bn                                                €bn
                         1.5

                                                                                                                              3.2
                                               1.4                                                       2.4
         1.1                                           1.2
                         0.9                                      0.8         0.8

      FY 2017          FY 2018             OCF        OCF      Adj. FFO Adj. FFO                      YE 2017              YE 2018
                                          FY 2017    FY 2018   FY 2017 FY 2018
           EBIT    EBITDA

Adjusted EBIT(DA) down                   Operating Cash Flow down                           Net Debt significantly up
 Driven by structural effects partly     Operating cash flow in line with                  Due to margining requirements,
  compensated by regulatory effects,       earnings development                               IFRS 16 effect and Nord Stream 2
  cost cutting and LNG proxy hedging                                                          funding
  result                                 Adjusted FFO in line
                                                                                             Economic Net Debt (END) funda-
                                          Adj. FFO is independent from                       mentally in line with targeted debt
                                           working capital effects and mainly                 factor - END does currently not
                                           profits from lower provision utilization           reflect all cash-effective positions

                                                                                      Uniper SE, Presentation FY 2018, 12 Mar 2019   11
Adjusted EBIT – FY 2018 earnings reduction
largely due to structural effects
Reconciliation Adjusted EBIT FY 2018 vs. FY 2017
€bn
                       Adj. EBIT FY 2017                  1.11

          Structural effects (YR, FX, lapse of
       Berezovskaya III insurance payments)

                                   Regulation
               (Nordic tax, capacity markets)

                      Outright price / volume

                          LNG proxy hedging

                                 Cost cutting

                                     One-offs
           (reversal of provision in H1 2018)

                                        Other

                       Adj. EBIT FY 2018           0.87

                                                           Uniper SE, Presentation FY 2018, 12 Mar 2019   12
Adj. EBIT to OCF – Healthy cash conversion due
to lower provision utilization
Reconciliation Adjusted EBIT to Operating Cash Flow (OCF)
 €m                                  341

                 678

                                                            173
                                                                                                                67

                                                                      -103                       -16
                                                -773

                          1,543
                                                                                 1,189                                       1,241

    865

 Adj. EBIT    Depreci- Adj. EBITDA Non-cash    Provision Changes in Payments     OCFbIT       Interest          Tax          OCF
 FY 2018      ation and   FY 2018  effective   utilization working  related to   FY 2018     payments         refunds       FY 2018
             amortization          EBITDA                  capital   non-op.
                                    items                           earnings,
                                                                      others

                                                                                   Uniper SE, Presentation FY 2018, 12 Mar 2019       13
Economic Net Debt (END) up due to increased
 margining, IFRS 16 impact and NS 2 financing
  Reconciliation Economic Net Debt YE 2018 vs. YE 2017                                                                              For information
                                                                                                                                     purpose only
 €bn
                                                                                                        0.3          3,2
                                                                                           0,3
                                                                                                                                                         Incl. Margining
                                                                                                                                               0.7       Receivables
                                                                              0,3                                    0.9
   2,4
                                                                0.3                                                                                      Incl. SWE KAF
                                                                                                                                               0.3
           -0,1                                                                                                                                          receivables not
                                                   0.3                                                                                                   recognized on
   1.0                                                                                                                                                   balance sheet
                                      0.6                                                                            0.8
                                                                                                                                                         acc. to IFRIC 5

   0.7                                                                                                                                         2.2
                         -1,2
                                                                                                                     1.5

   0.8

Economic Divest-        OCF      Investments      Nord   Dividend           Other       IFRS 16 Margining Economic                      Fundamental,
Net Debt ments                                  Stream 2 payment                                          Net Debt                           more
 YE 2017                                                                                                    2018                           liquidity
                                                                                                                                        oríented view
                                    AROs 1               Pension             Net financial position 2

                  1. Includes nuclear and other asset retirement obligations (AROs) as well as receivables from Swedish nuclear waste fund (KAF).
                  2. Includes cash & cash equivalents, non-current securities, financial receivables from
                     consolidated group companies and financial liabilities.                                     Uniper SE, Presentation FY 2018, 12 Mar 2019         14
2019 Outlook – Proposed earnings range with
upside potential
Reconciliation from Adjusted EBIT FY 2019E vs. FY 2018
 €bn
               Adj. EBIT FY 2018                   0.87

          Lapse of H1 2018 one-offs

                        Regulation

             Outright price / volume

                LNG proxy hedging

                 Commodity trading

                     Other (i.e. FX)

             Adj. EBIT FY 2019E

                                                         0.55          Range                0.85

                                                                Uniper SE, Presentation FY 2017,
                                                                                           2018, 08
                                                                                                 12 Mar 2018
                                                                                                        2019   15
2019 Outlook – Dividend path reiterated

Adj. EBIT                                    Dividend
€bn                                           €bn                                                       Key highlights
      0.87                0.85                                                                          European Generation
                                                                           0.39
                                                                                                         Lapse of 2018 one-offs
                         Range                      0.33                                                 Improving price / volume outright position
                          0.55                                                                           Laps of regulated income as UK capacity
                                 0.9                                                                      market income has not been included in 2019
                                                                                                          outlook and normalization in Germany

                                                                                                        Global Commodities
  FY 2018              FY 2019E                  FY 2018               FY 2019E                          Lapse of Freeport LNG hedge contribution

                                                                          1
                                                                                                         Lower Power and Gas trading margin
Adjusted EBIT contribution by segment                                                                    Better result on COFL expected

Segments                                          EBIT FY 2019E vs FY 2018                              International Power
                                                                                                         Capacity earnings on stable level
                                                                                                         Continuing volatility on electricity earnings
European Generation                               Significantly below
                                                                                                         Negative FX effects

Global Commodities                                Significantly below                                   Potential upside of up to ~ €120m once
                                                                                                        UK capacity market is resumed
International Power                               Significantly below

         1. Please note: ”significantly below” corresponds to an expected decrease in the magnitude of >=10%

                                                                                                               Uniper SE, Presentation FY 2018, 12 Mar 2019   16
Agenda

1. Essentials

2. Financial Results 2018 and Outlook 2019

3. Appendix
Outright power hedging in Germany and Nordic

Outright position – Baseload power price

              >85%                          >80%               ~0%

    €/MWh              >70%                        >55%                   >5%

      40

      35

      30

      25

      20

                                                                           Status: December 2018
      15
                     2019                          2020                      2021

                     Hedged price Germany                 Hedge ratio Germany

                     Hedged price Nordic                  Hedge ratio Nordic

                                                             Uniper SE, Presentation FY 2018, 12 Mar 2019   18
Group EBIT(DA) – Structural effects driving
earnings development in FY 2018
Adj. EBIT development by segment in FY 2018                                               Highlights
€m
                                                                                          European Generation
                                                                                           (-) Lower outright prices and spreads
                      49             -23                                                   (-) Closure of Maasvlakte 1 + 2 and
                                                                 63                             Oskarshamn 1 in 2017
      1,114                                       -338                                     (+) Swedish tax relief on hydro and
                                                                             865
                                                                                                nuclear
                                                                                           (+) Capacity market UK and France
     FY 2017    European           Global    International   Admin./Cons.   FY 2018        (+) One-off net provision release
                Generation       Commodities    Power

Adj. EBIT(DA) in FY 2018                                                                  Global Commodities
                                                                                           (-) Deconsolidation Yuzhno-Russkoye
                                                         EBITDA                 EBIT       (-) Gas provisioning for price negotiation
€m
                                                         FY 2018             FY 2018
                                                                                           (+) COFL with LNG proxy hedging result
European Generation                                           847                  386          but weak Coal optimization result
Global Commodities                                            430                  318     (+) Optimization and premature
                                                                                                termination of forward transactions
International Power                                           373                  278
                                                                                                in 2017
Administration / Consolidation                                -107              -117
                                                                                          International Power
Total                                                        1,543                 865     (-) Lapse of insurance payment for
                                                                                                Berezovskaya 3

                                                                                         Uniper SE, Presentation FY 2018, 12 Mar 2019   19
European Generation – Positive regulation and
one-off effects
Adj. EBIT development by sub-segment in FY 2018                            Main effects
 €m                                                                        Hydro
                                                                            (+) Net provision one-off
                                     46            21                       (+) Reduced hydro property tax
                    -35     17
                                                                            (-) Lower achieved prices
                                                              386           (-) Lower volumes
      337
                                                                           Nuclear
  FY 2017         Hydro   Nuclear   Fossil     Admin/Cons.   FY 2018        (+) Nuclear capacity tax abolished
                                                                            (-) Lower achieved prices
Adj. EBIT(DA) in FY 2018                                                    (-) Closure of Swedish nuclear power
                                                                                 plant Oskarshamn 1 in June 2017
                                             EBITDA              EBIT
€m
                                             FY 2018          FY 2018      Fossil
Hydro                                           363              288        (+) UK capacity payments
                                                                            (-) Closure of Dutch coal power plants
Nuclear                                          99                 39
                                                                                 Maasvlakte 1 + 2 in June 2017
Fossil                                          408                 86

Other / Consolidation                            -23                -27

Total                                           847              386

                                                                          Uniper SE, Presentation FY 2018, 12 Mar 2019   20
Global Commodities – Yushno-Russkoye
deconsolidation and normalization of Power Opt.
Adj. EBIT development by sub-segment in FY 2018                 Main effects                                  TBU
€m                                                              Gas
                                           269                   (-) Settlement of Yuzhno-Russkoye
                                                                      hedging result in Gas
                                                                 (-) Lapse of renegotiation result with
        341   -161                                 318                Gazprom
                                                                 (-) Provisioning for price negotiation
                                4
                       -136
                                                                Yuzhno-Russkoye (YR)
  FY 2017     Gas      YR     COFL       Power    FY 2018
                                                                 (-) Deconsolidation of Yuzhno-
                                                                      Russkoye
Adj. EBIT(DA) in FY 2018
                                                                COFL
                                     EBITDA          EBIT        (+) LNG with positive hedging result
€m
                                     FY 2018      FY 2018
                                                                     of US gas volumes
Gas                                     331           259        (-) Weaker coal optimization result
YR                                        -3              -3
                                                                Power
COFL                                     17              -12
                                                                 (+) Optimization effects
Power                                    85              74      (+) Premature termination of forward
                                                                      transactions in 2017
Total                                   430           318

                                                               Uniper SE, Presentation FY 2018, 12 Mar 2019         21
International Power – Lapse of insurance
payment
Adj. EBIT development by sub-segment in FY 2018                  Main effects                                  TBU
€m                                                               Russia
                                                                  (-) Lapse of Berezovskaya insurance
                                                                       payment

                                  5
                                                                  (-) Decreased electricity margins
          616                                                          due to lower generation volumes
                                                                       and higher fuel costs
                    -343                          278
                                                                  (-) Negative FX effects
         FY 2017   Russia       Brazil          FY 2018           (+) Increase of capacity payments
                                                                       thanks to effects of CSA uplift
Adj. EBIT(DA) in FY 2018

                                      EBITDA          EBIT
€m
                                      FY 2018      FY 2018
Russia                                   373              278

Brazil                                     0               0

Total                                    373              278

                                                                Uniper SE, Presentation FY 2018, 12 Mar 2019         22
Uniper Group – Adjusted EBIT(DA) by segment

Adj. EBITDA

€m                               FY 2018                FY 2017                  %

European Generation                   847                     780                9

Global Commodities                    430                     420                2

International Power                   373                     714               -48

Administration / Consolidation       -107                    -173               38

Total                               1,543                   1,741               -11

Adj. EBIT
€m                               FY 2018                FY 2017                  %

European Generation                   386                     337               15

Global Commodities                    318                     341                -7

International Power                   278                     616               -55

Administration / Consolidation       -117                    -180               35

Total                                 865                   1,114               -22

                                 Uniper SE, Presentation FY 2018, 12 Mar 2019    23
Uniper Group – Adjusted EBIT(DA) by
sub-segment
Adj. EBITDA and EBIT

                                                       FY 2018        FY 2017              FY 2018                   FY 2017
€m
                                                  Adj. EBITDA    Adj. EBITDA              Adj. EBIT                 Adj. EBIT

European Generation              Hydro                    363            381                      288                    323

                                 Nuclear                   99              85                      39                     22

                                 Fossil                   408            360                       86                     40

                                 Other/ Consol.           -23             -46                     -27                     -48

                                 Subtotal                 847            780                      386                    337
Global Commodities               Gas                      331            465                      259                    420
                                 YR                         -3           146                        -3                   133
                                 COFL                      17              -6                     -12                     -18
                                 Power                     85           -185                       74                   -195
                                 Subtotal                 430            420                      318                    341
International Power              Russia                   373            719                      278                    621
                                 Brazil                     0              -5                        -                     -5
                                 Subtotal                 373            714                      278                    616
Administration / Consolidation                           -107           -173                     -117                   -180

Total                                                   1,543          1,741                      865                  1,114

                                                                     Uniper SE, Presentation FY 2018, 12 Mar 2019          24
Uniper Group – Key P&L items at a glance

Key P&L items

€m                                                                                                                                      FY 2018                   FY 2017

Sales                                                                                                                                     78,176                   72,238
Adjusted EBITDA                                                                                                                            1,543                    1,741
Economic depreciation and amortization / reversals                                                                                           678                     627
Adjusted EBIT                                                                                                                                865                    1,114
Non-operating adjustments                                                                                                                  1,017                    1,226
EBIT                                                                                                                                        -152                     -112

Net interest income / expense1                                                                                                              -254                       26
Other financial result1                                                                                                                     -168                      -44
Income taxes                                                                                                                                  82                     -408
Net income / loss after income taxes                                                                                                        -492                     -538

Attributable to the shareholders of Uniper SE                                                                                               -452                     -656
Attributable to non-controlling interests                                                                                                     -40                    118

                 1. Result from Swedish Nuclear Waste Fund (KAF) in the amount of €-89m is moved from
                    Economic interest expenses to “Other financial result”. This also is applied retrospectively
                    for 2017 (FY 2017: €-44m).                                                                     Uniper SE, Presentation FY 2018, 12 Mar 2019         25
1,362
Uniper Group – Adjusted EBITDA to net income

Reconciliation Adj. EBITDA to Net Income
€m

     1,543         - 678

                                       865               - 329

                                                                       -343

                                                                                                                                           -452
                                                                                                                           218

                                                                                       -681
                                                                                                        -182

                                                                                                                1
    Adj.           D&A                Adj.            Economic          MTM             Net             Other          Taxes on              Net
  EBITDA                             EBIT          interest, taxes,   Derivatives   impairments                          non-             Income 3
  FY 2018                           FY 2018           minorities                                                       operating           FY 2018
                                                                                                                       earnings,
                                                                                                                       minorities
                                         Underlying earnings2                  Non-operating results

             1.   Includes other financial result
             2.   Includes non-controlling interests
             3.   Net income attributable to Uniper shareholders                                  Uniper SE, Presentation FY 2018, 12 Mar 2019       26
Uniper Group – Economic interest expense (net)

Economic interest expense Uniper Group
€m                                                                                                                                       FY 2018                      FY 2017

Interest from financial assets / liabilities                                                                                                     14                        -3

Interest cost from provisions for pensions and similar provisions                                                                               -17                       -19

Accretion of provisions for retirement and obligation and other provisions                                                                      -86                       -88

Construction period interests1                                                                                                                   50                       68

Other2, 3                                                                                                                                     -194                        52

Economic interest expense (net)                                                                                                               -233                        10

                 1. Borrowing costs that are directly attributable to the acquisition, construction or production of a qualifying asset are capitalized as
                    part of the cost of the asset; borrowing cost are interest costs incurred by an entity in connection with the borrowing of funds.
                 2. Includes e.g. interest due to tax provisions/receivables and adjustments due to changes in interest rates on provisions.
                 3. Result from Swedish Nuclear Waste Fund (KAF) in the amount of €-89m is moved from Economic interest expenses
                    to “Other financial result”. This also is applied retrospectively for 2017 (FY 2017: €-44m).       Uniper SE, Presentation FY 2018, 12 Mar 2019        27
Uniper Group – Non-operating adjustments

Non-operating adjustments

€m                                                                               FY 2018                    FY 2017

Net book gains / losses                                                                 31                     890

Fair value measurement of derivative financial instruments                             343                      -88

Restructuring / cost management expenses                                               -73                      18

Non-operating impairment charges / reversals                                           681                     400

Miscellaneous other non-operating earnings                                              35                       6

Non-operating adjustments                                                            1,017                    1,226

                                                             Uniper SE, Presentation FY 2018, 12 Mar 2019        28
Uniper Group – Cash effective investments

Investments by segment

€m                                          FY 2018                FY 2017                  %

European Generation                              397                     518               -23

Global Commodities                                 32                     49               -35

International Power                              190                     222               -14

Administration / Consolidation                     23                     54               -57

Total                                            642                     843               -24

Investment split – Maintenance and growth
€m                                          FY 2018                FY 2017                  %

Maintenance & replacement                        317                     392               -19

Growth                                           325                     451               -28

Total                                            642                     843               -24

                                            Uniper SE, Presentation FY 2018, 12 Mar 2019    29
Uniper Group – Net financial position

Net financial position Uniper Group
€m                                                                                                     31 Dec 2018                31 Dec 2017

Liquid funds                                                                                                    1,400                   1,027

Non-current securities                                                                                             83                    104

Financial liabilities                                                                                          -2,939                  -1,923

Net financial position                                                                                         -1,456                    -792

Provisions for pensions and similar obligations                                                                  -804                    -676

Asset retirement obligations                                                                                     -948                    -977

Economic Net Debt                                                                                              -3,208                  -2,445

Information: Margining assets                                                                                     698                    432

Information: Uniper’s assets of Swedish nuclear funds not recognized in balance sheet                             348                    242

Fundamental Economic Net Debt                                                                                  -2,162                  -1,771

                                                                                        Uniper SE, Presentation FY 2018, 12 Mar 2019       30
Uniper Group – Consolidated balance sheet (1/2)

Balance sheet Uniper Group – Assets
€m                                                                31 Dec 2018                31 Dec 2017
Goodwill                                                                  1,816                    1,890
Intangible assets                                                           768                      819
Property, plant and equipment                                            10,612                   11,496
Companies accounted for under the equity method                             440                      448
Other financial assets                                                      866                      814
      Equity investments                                                    783                      710
      Non-current securities                                                 83                      104
Financial receivables and other financial assets                          3,618                    3,308
Operating receivables and other operating assets                          4,914                    3,206
Income tax assets                                                             6                        6
Deferred tax assets                                                       1,116                      890
Non-current assets                                                       24,156                   22,877

Inventories                                                               1,604                    1,659
Financial receivables and other financial assets                          1,391                    1,195
Trade receivables and other operating assets                             21,468                   16,163
Income tax assets                                                            40                      170
Liquid funds                                                              1,400                    1,027
Assets held for sale                                                        546                       70
Current assets                                                           26,449                   20,284

Total assets                                                             50,605                   43,161

                                                   Uniper SE, Presentation FY 2018, 12 Mar 2019       31
Uniper Group – Consolidated balance sheet (2/2)

Balance sheet Uniper Group – Equity and liabilities
€m                                                                    31 Dec 2018                31 Dec 2017
Capital stock                                                                   622                      622
Additional paid-in capital                                                   10,825                   10,825
Retained earnings                                                             3,032                    3,399
Accumulated other comprehensive income                                       -3,531                   -2,699
Equity attributable to the shareholders of Uniper SE                         10,948                   12,147
Attributable to non-controlling interest                                        497                      642
Equity (net assets)                                                          11,445                   12,789

Financial liabilities                                                         1,187                      961
Operating liabilities                                                         4,856                    3,618
Provisions for pensions and similar obligations                                 804                      676
Miscellaneous provisions                                                      5,455                    6,068
Deferred tax liabilities                                                        355                      390
Non-current liabilities                                                      12,657                   11,713
Financial liabilities                                                         1,752                      962
Trade payables and other operating liabilities                               22,469                   16,277
Income taxes                                                                     47                       55
Miscellaneous provisions                                                      1,478                    1,362
Liabilities associated with assets held for sale                                757                        3
Current liabilities                                                          26,503                   18,659

Total equity and liabilities                                                 50,605                   43,161

                                                       Uniper SE, Presentation FY 2018, 12 Mar 2019       32
Uniper Group –
Consolidated statement of cash flows
Statement of cash flows Uniper Group
€m                                                                                                          FY 2018                    FY 2017
Net income / loss                                                                                               -492                      -538
Depreciation, amortization and impairment of intangibles / property, plant, equipment                          1,532                     1,198
Changes in provisions                                                                                           -267                      -608
Changes in deferred taxes                                                                                       -136                       309
Other non-cash income and expenses                                                                               161                       -96
Gain / loss on disposals                                                                                         -50                       865
Changes in operating assets and liabilities and in income tax                                                    493                       255
Cash provided (used for) by operating activities                                                               1,241                     1,385
Proceeds from disposals                                                                                          130                     1,796
Payments for investments                                                                                        -642                      -843
Payments in context of divestments                                                                                 -                       -66
Proceeds from disposals of securities (>3M) and of financial receivables                                         653                       951
Purchases of securities (>3M) and of financial receivables                                                    -1,494                    -1,215
Changes in restricted cash and cash equivalents                                                                   90                      -106
Cash provided (used for) by investing activities                                                              -1,263                       517
Payments received / made from changes in capital                                                                  14                        15
Cash dividends paid to the shareholders of Uniper SE                                                            -271                      -201
Cash dividends paid to other shareholders                                                                        -31                       -35
Proceeds from financial liabilities                                                                            1,228                        23
Repayment of financial liabilities                                                                              -621                      -931
Cash provided (used for) by financing activities                                                                 319                    -1,129
Net increase / decrease in cash and cash equivalents                                                             297                       773
Effect from foreign exchange rates on cash and cash equivalents                                                   -9                       -12
Cash and cash equivalents at the beginning of the year                                                           851                       169
Cash and cash equivalents from disposal groups                                                                    -1                         -
Cash and cash equivalents of deconsolidated companies                                                              -                       -79
Cash and cash equivalents at the end of the quarter                                                            1,138                       851
                                                                                        Uniper SE, Presentation FY 2018, 12 Mar 2019         33
Uniper – Contact your Investor Relations team

 Contact                              Uniper SE                                   Udo Giegerich
                                      Investor Relations                          Executive Vice President
                                      E.ON-Platz 1                                Group Finance & Investor Relations
                                      40479 Duesseldorf                                     udo.giegerich@uniper.energy
                                      Germany

                                                      +49 211 4579 4400
                                                        ir@uniper.energy

 Carlo Beck                           Mikhail Prokhorov                           Peter Wirtz
 Manager Investor Relations           Manager Investor Relations                  Manager Investor Relations
                  +49 211 4579 4402                    +49 211 4579 4484                               +49 211 4579 4414
           carlo.beck@uniper.energy      mikhail.prokhorov@uniper.energy                        peter.wirtz@uniper.energy

                                                                           Uniper SE, Presentation FY 2018, 12 Mar 2019     34
Financial calendar & further information

Financial calendar                             Further information
07 May 2019                                       https://ir.uniper.energy
Quarterly Statement January – March 2019
22 May 2019
Annual General Meeting
08 August 2019
Interim Report January – June 2019
12 November 2019
Quarterly Statement January – September 2019
10 March 2020
Annual Report 2018
07 May 2020
Quarterly Statement January – March 2020
20 May 2020
Annual General Meeting
Disclaimer

This document and the presentation to which it relates contains information relating to Uniper SE, ("Uniper" or the "Company") that must not be relied upon for any purpose and may not be redistributed,
reproduced, published, or passed on to any other person or used in whole or in part for any other purposes. By accessing this document you agree to abide by the limitations set out in this document.
This document is being presented solely for informational purposes and should not be treated as giving investment advice. It is not, and is not intended to be, a prospectus, is not, and should not be
construed as, an offer to sell or the solicitation of an offer to buy any securities, and should not be used as the sole basis of any analysis or other evaluation and investors should not subscribe for or
purchase any shares or other securities in the Company on the basis of or in reliance on the information in this document.
Certain information in this presentation is based on management estimates. Such estimates have been made in good faith and represent the current beliefs of applicable members of management of
Uniper. Those management members believe that such estimates are founded on reasonable grounds. However, by their nature, estimates may not be correct or complete. Accordingly, no
representation or warranty (express or implied) is given that such estimates are correct or complete.
We advise you that some of the information presented herein is based on statements by third parties, and that no representation or warranty, express or implied, is made as to, and no reliance should be
placed on, the fairness, accuracy, completeness or correctness of this information or any other information or opinions contained herein, for any purpose whatsoever. Certain statements contained herein
may be statements of future expectations and other forward-looking statements that are based on the Company’s current views and assumptions and involve known and unknown risks and uncertainties
that may cause actual results, performance or events to differ materially from those expressed or implied in such statements. No one undertakes to publicly update or revise any such forward-looking
statement. Neither Uniper nor any of their respective officers, employees or affiliates nor any other person shall assume or accept any responsibility, obligation or liability whatsoever (in negligence or
otherwise) for any loss howsoever arising from any use of this presentation or the statements contained herein as to unverified third person statements, any statements of future expectations and other
forward-looking statements, or the fairness, accuracy, completeness or correctness of statements contained herein.
In giving this presentation, neither Uniper nor its respective agents undertake any obligation to provide the recipient with access to any additional information or to update this presentation or any
information or to correct any inaccuracies in any such information.
This presentation contains certain financial measures (including forward-looking measures) that are not calculated in accordance with IFRS and are therefore considered as "Non-IFRS financial
measures". The management of Uniper believes that the Non-IFRS financial measures used by Uniper, when considered in conjunction with (but not in lieu of) other measures that are computed in
accordance with IFRS, enhance an understanding of Uniper's results of operations, financial position or cash flows. A number of these Non-IFRS financial measures are also commonly used by securities
analysts, credit rating agencies and investors to evaluate and compare the periodic and future operating performance and value of Uniper and other companies with which Uniper competes. These Non-
IFRS financial measures should not be considered in isolation as a measure of Uniper's profitability or liquidity, and should be considered in addition to, rather than as a substitute for, net income and the
other income or cash flow data prepared in accordance with IFRS. In particular, there are material limitations associated with our use of Non-IFRS financial measures, including the limitations inherent in
our determination of each of the relevant adjustments. The Non-IFRS financial measures used by Uniper may differ from, and not be comparable to, similarly-titled measures used by other companies.
Certain numerical data, financial information and market data (including percentages) in this presentation have been rounded according to established commercial standards. As a result, the aggregate
amounts (sum totals or interim totals or differences or if numbers are put in relation) in this presentation may not correspond in all cases to the amounts contained in the underlying (unrounded) figures
appearing in the consolidated financial statements. Furthermore, in tables and charts, these rounded figures may not add up exactly to the totals contained in the respective tables and charts.
You can also read