Analysis of Tourists' Image of Seoul with Geotagged Photos using Convolutional Neural Networks a - ICA-Proc
←
→
Page content transcription
If your browser does not render page correctly, please read the page content below
Analysis of Tourists’ Image of Seoul with Geotagged Photos using
Convolutional Neural Networks a

Dongeun Kimb , Youngok Kangb*, Yearim Parkb , Nayeon Kimb , Juyoon Leeb , Nahye Chob
a
    This Research was supported by the Technology Advancement Research Program funded by Ministry of Land, Infrastructure and
     Transport of Korean government (Grant No: 19CTAP-C151886-01)
b
    Ewha Womans University, kan00100@naver.com, ykang@ewha.ac.kr, yeahrim023@naver.com,
    rlaskdus993@naver.com, leedew12@gmail.com, cho.nahye@gmail.com
* Corresponding author

Abstract: In this study we aim to analyze the urban image of Seoul that tourists feel through the photos uploaded on Flickr, which is one of
Social Network Service (SNS) platforms that people can share Geo-tagged photos. We first categorize the photos uploaded on the site by tourists
and then performed the image mining by utilizing Convolutional Neural Network (CNN), which is one of the artificial neural networks with
deep learning capability. In this study we are able to find out that tourists are interested in old palaces, historical monuments, stores, food, etc. in
which are considered to be the signatured sightseeing elements in Seoul. Those key elements are differentiated from the major sightseeing
attractions within Seoul. The purpose of this study is two folds: First, we analyze the image of Seoul by applying the technology of image mining
with the photos uploaded on Flickr by tourists. Second, we draw some significant sightseeing factors by region of attraction where tourists prefer
to visit within Seoul.
Keywords: Seoul Tour, Image of Seoul, Social Network Service, Flickr, Geotagged photos, Convolutional Neural Network

                                                                              2016; Kagaya and Aizawa, 2015; Kaneko and Yanai,
1. Introduction                                                               2013; Kisilevich et al., 2013; Okuyama and Yanai, 2013).
Today people prefer to share the posts such as texts,                         On the other hand, the studies which have utilized the
images, and videos via Social Network Services (SNS)                          photos uploaded on the site by tourists is really rare. This
without regard to time and location. Moreover, the geo-                       study aims to track down representative images and
tagged photos uploaded on the site by tourist surface on                      elements of sightseeing attractions by analyzing the
the perception and the action of tourists as well as display                  photos uploaded on Flickr by Seoul tourists by applying
the images that tourists feel about the sightseeing                           the technique of image mining based on deep learning.
attractions (Donaire et al., 2014). As the images of                          In Part 2 we review the researches related to the image
touristic sites are closely associated with the tourists’                     data mining. In Part 3 we discuss the collection of Flickr
attraction and intention, they serve as a reference for                       data, differentiation of tourists, extraction of important
other tourists who seek to travel to those sites (Park et al.,                touristic locations, and methodologies of image data
2012). In addition, as the process of sharing the images                      mining. In Part 4 we compare the tourists’ image of Seoul
on SNS consists of continually producing and                                  with the image of important touristic locations by
reproducing touristic images, we are able to ascertain                        applying the methodologies described in Part 3. In Part5
perceptions and trends of representative sightseeing                          we summarize the study results and enumerate future
elements and locations by analyzing the images uploaded                       tasks. For our analysis we apply Python version 3.6 and
on SNS. Furthermore, this process contributes to the                          Tensorflow, open source machine learning library.
basic research on tourism in relation to discovering,
developing, and improving sightseeing attractions (Saito                      2. Research on Image Data Mining via Convolutional
et al, 2018).                                                                 Neural Network (CNN)
We think that it is possible for us to analyze broader                        Image data mining is the process of extracting
scope with more extracted information in tandem with                          information or knowledge from image data (Deepak et al.,
preexisting methodologies of spatial data analysis                            2012). Recently, with the increase in the volume of image
because geo-tagged photos contain locational information.                     data as well as the improvement of training algorithm,
Especially we can make better use of Flickr data as they                      techniques of image data mining using artificial neural
contain information on location and time, which are                           networks have been applied to various fields such as
automatically affiliated with photo metadata. However,                        medicine, environmental studies, information science,
previous studies which have utilized geo-tagged data on                       and computer graphics (Géron, 2017). Convolutional
SNS have mostly explored the location that users                              Neural Network (CNN) which is one of aritificial neural
occupied (Kádár, 2014), patterns of movement (Yuan and                        networks has been developed based on neurological
Medel, 2016; Zheng et al., 2012), and analysis through                        knowledge surrounding the visual cortex of humans and
uploaded texts (Jang and Cho, 2016; Hong and Shin,                            animals (Ciresan et al., 2011). As CNN has been shown

Proceedings of the International Cartographic Association, 2, 2019.
29th International Cartographic Conference (ICC 2019), 15–20 July 2019, Tokyo, Japan. This contribution underwent
single-blind peer review based on submitted abstracts. https://doi.org/10.5194/ica-proc-2-62-2019 | © Authors 2019. CC BY 4.0 License.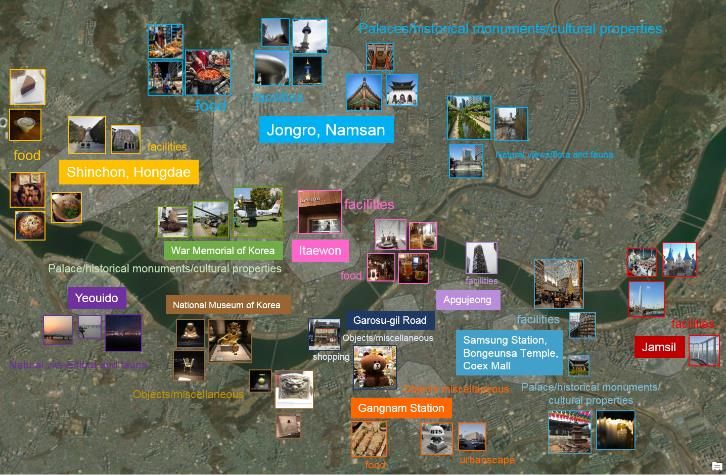
2 of 8

to be effective in distinguishing and categorizing the               of Korea, or did not provide enough evidence to locate an
photo images, it has become a trend to make use of it in             exact place of residence in order to distinguish tourists
most image data mining research. CNN is basically                    from others. We then further reduced the 868 users to 689
composed of three layers such as a convolutional layer, a            tourists, after eliminating 179 users who had specified
pooling layer, and a fully connected layer. One can not              their place of residence as Seoul. Those for whom we
only produce a variety of models by changing the CNN                 could not discern whether they resided in Seoul (1,106
configurations, but also train the CNN through the scan              users) were categorized as residents of Seoul if the first
of the image characteristics.                                        and the last photo posted throughout the duration of the
The studies that have executed image data mining using               study exceeded 30 days; using this procedure we
the images on SNS are as follows: Kaneko and Yanai                   concluded that 319 were residents of Seoul and 787 were
(2013) researched to track down event photos such as                 tourists. A total of 1,476 users were categorized as
festivals, sports game, earthquake and fires by analyzing            tourists after sorting out the 689 users who had input their
geo-tagged photos on Tweeter. Okuyama and Yanai                      place of residence and 787 users who had not input their
(2013) selected representative images of designated                  residence. Finally, we analyzed the image of Seoul based
locations after extracting the locations from photos on              a total of 39,157 data on Flickr uploaded by a total of
Flickr where tourists visit. These studies have applied              1,476 tourist users. We then extracted 11 Regions of
Speeded-Up Robust Features (SURF) technique out of                   Attraction (RoA) from the 39,157 Flickr data uploaded by
various image data mining techniques. On the other hand,             tourists through the use of Density Based Spatial
CNN has come to be used as an image mining method.                   Clustering of Application with Noise (DBSCAN)
Jang and Cho (2016) have proposed a method of                        algorithm (Kim et al., 2018). Information on each RoA is
extracting tags automatically from the images posted on              shown below in Table 1 and Figure 1. Figure 2 illustrates
Instagram. Hong and Shin (2016) have proposed a                      analytical method and procedure of this study.
method of recommending followers (information
providers) by extracting the categories with the huge                                                                        Number of
                                                                      Name               Region of Attraction
number of images uploaded after categorizing the images                                                                       Photos
posted by Instagram users.                                                       Samcheong-dong,                palaces          21,323
Kagaya and Aizawa (2015) distinguished the images that                           (Gyeongbokgung,Deoksugung,
                                                                                 Changgyeonggung),Cheonggye Stream,
actually contained food from those that did not among the                        Sejong Center for the Performing Arts,
populated photos when searching “#food” on Instagram.                 Jongro,
                                                                                 City Hall, Namdaemun Marketplace,
                                                                      Namsan
In addition, CNN method has also been utilized in the                            Seoul Station, Insa-dong, Myeong-
field of medicine in order to categorize the images                              dong, Hanyang Wall Course 3,
                                                                                 Namsangol Park, Namsan Tower, DDP,
produced. Krishnan et al. (2018) categorized liver                               Gwangjang Market, Daehakro
diseases surfaced on the images of ultrasonic inspection.                        Ewha Women’s University, Yeonse-ro,              2,607
Sawant et al. (2018) detected brain cancer through MRI,              Shinchon,
                                                                                 Yeonnam-dong, Hongdae Station area,
                                                                     Hongdae
and Motlagh et al. (2018) distinguished breast cancer                            Mecenatpolis
from the images of histopathological samples. Further,                 War                                                        1,017
CNN method has been applied in other fields of image                 Memorial    War Memorial of Korea
mining. Park and Shim (2017) established a model of                  of Korea
discerning the genre from the images of movie posters,               National                                                       970
                                                                    Museum of    National Museum of Korea
taking inspiration from the thought that elements such as             Korea
title font and chroma of images of movie posters can                 Samsung                                                        876
differ according to the genre of the movies. Lee and Lee              Station,
(2017) created model which could recognize the                      Bongeunsa    Bongeunsa Temple, Coex Mall
characters in the animation of ‘The Simpson’, and Xu et              Temple,
                                                                    Coex Mall
al. (2017) conducted a research on distinguishing geo-
tagged land images by the conditions of land coverage.                Jamsil     Lotte World, Lotte World Tower                     849
                                                                                 Hannam-dong,     Itaewon         Station,          842
                                                                      Itaewon
                                                                                 Gyeongridan Road
3. Method of Analysis and Process                                    Gangnam                                                        752
                                                                                 Gangnam Station Street
                                                                      Station
3.1 Data collection and extraction of important                      Yeouido     IFC Mall                                           430
touristic locations                                                 Garosu-gil
                                                                                 Garosu-gil Road
                                                                                                                                    421
In this study we use a total of 86,304 data uploaded on               Road
Flickr via open API, which encompasses specific spatio-             Apgujeong    K-Pop Street                                       306
temporal parameters of Seoul consisting of latitude of               Table 1. RoA Within Seoul
37.4°~ 37.8°, and longitude of 126.8° ~ 127.2° between
January 1, 2015 and December 31, 2017. The number of
users is 1,974 among the total of 86,304 data on Flickr.
We divided the 1974 users into 868 users who had
specified their place of residence and 1,106 users who
either had not specified their place of residence, Republic

Proceedings of the International Cartographic Association, 2, 2019.
29th International Cartographic Conference (ICC 2019), 15–20 July 2019, Tokyo, Japan. This contribution underwent
single-blind peer review based on submitted abstracts. https://doi.org/10.5194/ica-proc-2-62-2019 | © Authors 2019. CC BY 4.0 License.
3 of 8

                                                                     meaning by comparing 1,000 categories when each image
                                                                     is categorized into one of 1000 categories by applying the
                                                                     Inception v3 model in TensorFlow. Moreover, the 27
                                                                     primary categories in ImageNet were also not easily
                                                                     applicable to the category––tourism.           Given these
                                                                     constraints, we generated 14 new categories that were
                                                                     suitable for the field of tourism based on the values
                                                                     resulting from the categorization of the 38,691 images.
                                                                     Basically 14 categories have been created by referring the
                                                                     categories of major activities on the survey of the current
                                                                     state of foreign tourists conducted by the Korea Tourism
                                                                     Organization in 2017. These categories are as follows:
                                                                     “food,” “entertainment,” “shopping,” “transportation,”
                                                                     “cityscape,” “facilities,” “residence,” “natural views/flora
Figure 1. Region of attraction in Seoul                              and     fauna,”     “people,”     “religion,”    “clothing,”
                                                                     “palace/historical     monuments/cultural       properties,”
                                                                     “objects/miscellaneous,” and “exhibits/sculptures” (Table
                                                                     2).

                                                                      PrimaryCategories              Examples ofSecondaryCategories
                                                                                            bakery, bakeshop,bakehouse/coffee mug/ restaurant,
                                                                             food
                                                                                            eatinghouse, eatingplace,eatery,etc.
                                                                         entertainment      beer bottle/horizontal bar/wine bottle,etc.
                                                                                            barbershop/cinema, movie theatre,movie house,
                                                                          shopping          picture palace/confectionery,confectionery,candy
                                                                                            store,etc.
Figure 2. Research Flow                                                                     ambulance/bicycle-built-for-two,tandembicycle,
                                                                        transportation
                                                                                            tandem/canoe,etc.
3.2 Image data collection, pre-processing, and image                      cityscape         cab,hack, taxi,taxicab/spotlight,spot/volcano
data mining                                                                                 beacon,lighthouse,beaconlight, Pharos/greenhouse,
We performed data mining with a total of 38,691 photos                    facilities
                                                                                            nursery,glasshouse/ fountain,etc.
after eliminating 465 images that were deleted from the
39,156 images posted by 1,476 tourists. We applied                                          mobile home, manufactured home/prison, prison
                                                                          residence
                                                                                            house
Inception v3 model of Google Net, which is one of
various CNN models, for the photo data mining.                       natural views/flora    trench, Tinca tinca/goldfish,Carassius auratus/
Inception v3 is a model “trained” with ImageNet’s image                  and fauna          lakeside,lakeshore,etc.
data set, which comprises of 14,197,122 images divided                                      ballplayer,baseballplayer/ groom,bridegroom/scuba
into 1,000 categories. The images in ImageNet are                          people
                                                                                            diver
divided into 27 primary categories and 1,000 secondary                     religion         altar/church,church building/stupa,tope
categories. In case of categorizing images with the
Inception v3 model, the model generates the category                       clothing         gown/kimono/ neckbrace,etc.
name that most resembles with the input image among                    palace/historical
1000 categories and its accuracy value. In addition to                monuments./cultural   abacus/ bellcote, bellcot/palace,etc.
GoogleNet, there are also LeNet-5, AlexNet, and ResNet,                   properties
which are various variations of convolutional neural                                       accordion,pianoaccordion,squeeze box/ashcan,trash
networks. The Inception module, a subnetwork included                objects/miscellaneous can,garbage can, wastebin,ashbin, ash bin,ashbin/
with GoogleNet, has a deep structure and makes                                             candle,taper, waxlight,etc.
GoogleNet use parameters more effectively than other
                                                                      exhibits/sculptures balloon/ pedestal,plinth,footstall/ totempole,etc.
models (Géron, 2017). Among the various models of
GoogleNet using the Inception module, Inception v3                   Table 2. Newly Produced Primary Categories (14) and
models are not only low-error rates, but also source code            Corresponding Secondary Categories
is widely available.
As Inception v3 model uses TensorFlow to operate, it is              4. Results of Analysis
necessary to pre-process the photos into appropriate
formats before analyzing photo data. As data crawled
from Flickr’s API are in the format of image URL, we                 4.1 Images of Seoul as seen by tourists in Seoul
downloaded them in BMP format and then converted                     As a result of categorizing the 38,691 photos uploaded by
them into size of 299 * 299 RGB, which can be used in                Seoul tourists, we were able to produce 858 of 1,000
the Inception v3 model. It is not easy to derive the                 categories using ImageNet. The categories that had a

Proceedings of the International Cartographic Association, 2, 2019.
29th International Cartographic Conference (ICC 2019), 15–20 July 2019, Tokyo, Japan. This contribution underwent
single-blind peer review based on submitted abstracts. https://doi.org/10.5194/ica-proc-2-62-2019 | © Authors 2019. CC BY 4.0 License.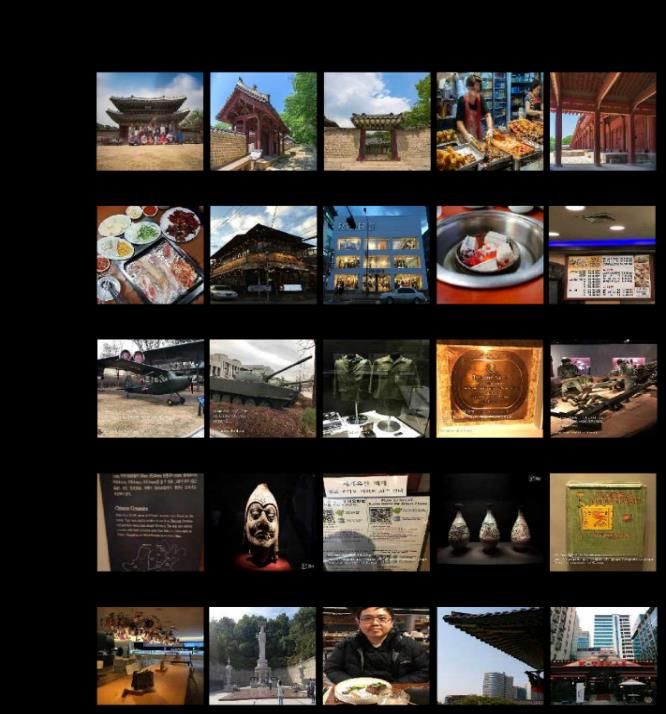
4 of 8

proportion of 1% or above among 858 categories are                   of exteriors of buildings, although it is rarely the case in
shown in Figure 3. When looking the category into                    Korea that a movie theatre occupies one part of an entire
details, there are usually images of front gate for “palace”,        building. In addition, although the monastery is rarely
roof tiles for “bell cote” and “tile roof”, and interior             seen in Seoul, Ewha Womans University buildings and
gardens for “patio, terrace”. Like this, we can get an idea          photographs of buildings blended with trees are classified
of the representative images of palaces that tourists have           as 'monastery'. Given these factors, there appears to be a
in mind when visiting Seoul. In the category of food,                need to produce categories and a data set by considering
“plate” includes traditional Korean cuisine, sashimi, and            the characteristics of relevant tourist attractions and
pasta, “restaurant” does barbeque house, café and inner              locations.
interiors, “food market” does the images of markets such
as supermarkets, street markets, traditional market and
street food, “hot pot” does the images of soup and “menu”
does menu list. The “toyshop” contain the images of not
only actual toy stores but also of objects including certain
characters and interiors of various shops, such as variety
stores and hardware stores. The “movie theatre” includes
the images of shop exteriors such as clothing stores and
restaurant. The “stage” includes the images of building
interiors and those that emphasize equipment. Both “taxi”
and “traffic light” include the images of streets, cars
parked along the road, and neon signage decorating the
outside of buildings. The “prison” and “monastery”
include the images of crowded residential areas,
museums, and the like. “Lakeside,” on the other hand,
includes images of natural views with not only lakes or
rivers but also trees or sky, while “pier” does the images
of rivers, streams, ponds, college campus, and so on. To
sum it all up, we can deduce that tourists have a
perception of Seoul that consists of palaces, food,
buildings, and facilities.
Because the ImageNet dataset used in the training of the
Inception v3 model was not collected for Seoul tourist               Figure 3. Results of Classifying photos Uploaded by
photo analysis, the actual classification accuracy could             Tourists in Seoul (categories, number of photos, photo
not be confirmed through the accuracy value returned by              proportion, classification accuracy by each category)
the model. In order to check the accuracy of the
classification, the classification accuracy of each category
was calculated by directly checking the photographs
belonging to the category with the picture ratio of 1% or
more. The results are shown at the bottom of each
category photo in Figure 3. In the categories with a
classification accuracy of more than 80%, there are 'plate',
'bell cote', 'palace', 'terrace' and 'hot pot'. In the categories
with a classification accuracy of less than 20%, there are
'movie theater', 'prison', 'monastery', 'taxi', and 'toyshop'
Figure 4 shows an example of misclassification for each
category. The 'palace', which had a relatively high
classification accuracy, includes buildings classified as
European style such as the War memorial hall, city hall,
and Seoul station. 'Bell cote' includes a bell tower shaped
building or a building with a view looking up from below.
In the case of 'prison', where the classification accuracy
was low, the photographs posted by the tourists on Flickr
are photos of low-rise multi-family houses with many
windows, which are classified as 'prison' categories,                              Figure 4. Incorrectly classified cases
judged to be similar to prison photos belonging to
ImageNet's training data. In addition, although a Flickr             Table 3 shows the results of assigning 1,000 categories to
image showed the exterior of a building, those image                 14 primary categories for analysis by subjects. Figure 5
would be categorized as “movie theatre”. The image was               shows the results of further extracting the top five
probably categorized this way because the images of                  primary categories and examining their secondary
movie theatre in ImageNet’s training data mostly consist             categories. We can see that tourists who come to Seoul
                                                                     are generally interested in palaces, historical monuments,

Proceedings of the International Cartographic Association, 2, 2019.
29th International Cartographic Conference (ICC 2019), 15–20 July 2019, Tokyo, Japan. This contribution underwent
single-blind peer review based on submitted abstracts. https://doi.org/10.5194/ica-proc-2-62-2019 | © Authors 2019. CC BY 4.0 License.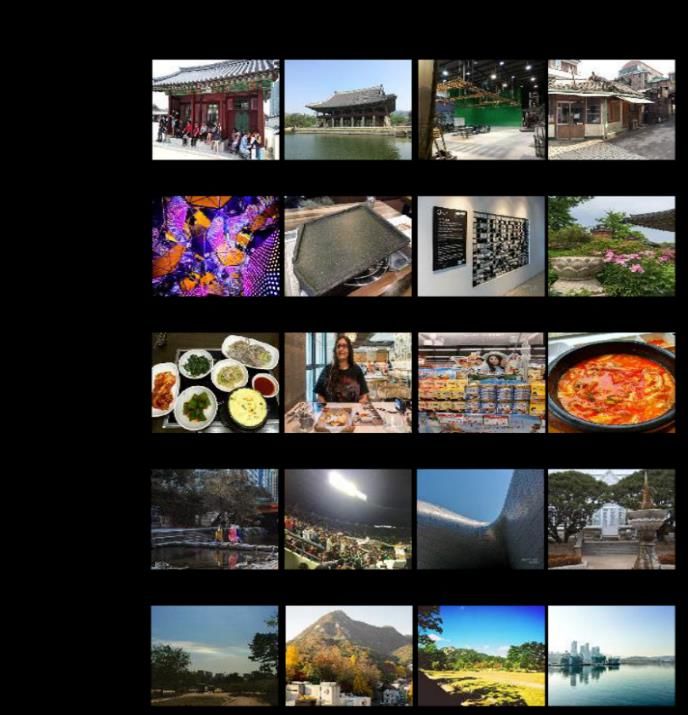
5 of 8
cultural properties, objects, food, facilities, natural views,
and flora and fauna. More specifically, when looking into
the category of “palace/historical monuments/cultural
properties”, “palace,” and “bell cote,” contain the images
of palaces, tile-roofed houses, and Korean-style houses,
“patio and terrace” contain the images of courtyards, and
“tile roof” contains the images of rafters. From this we
can deduce that a considerable number of tourists seem to
consider palaces and traditional houses as representative
images that can be seen in Seoul. “Umbrella” which
belongs to a subcategory of “objects/miscellaneous”
includes the images of not only actual umbrellas but also
silhouettes that resemble the shape of an umbrella.
Similarly, while there are some images of food on tray for
the category of “tray,” there are mostly images of objects
that resemble a tray. And there are mostly images of
historical monuments and exhibits in “book jacket.” As
mentioned before, this is probably due to the lack of
adequate categories to properly categorize the images
taken by tourists. “Plate” which belongs to a subcategory
of “food” has numerous images of food such as
traditional Korean cuisine and sashimi, and there are
mostly images of restaurants and coffee shops in Figure 5. Top Five Primary Categories and the
“restaurant.” There are images of big supermarkets and Corresponding Secondary Categories of Photos Uploaded
traditional street markets for “food market,” and images by Tourists in Seoul
of food such as rice cake in hot sauce, soups, and
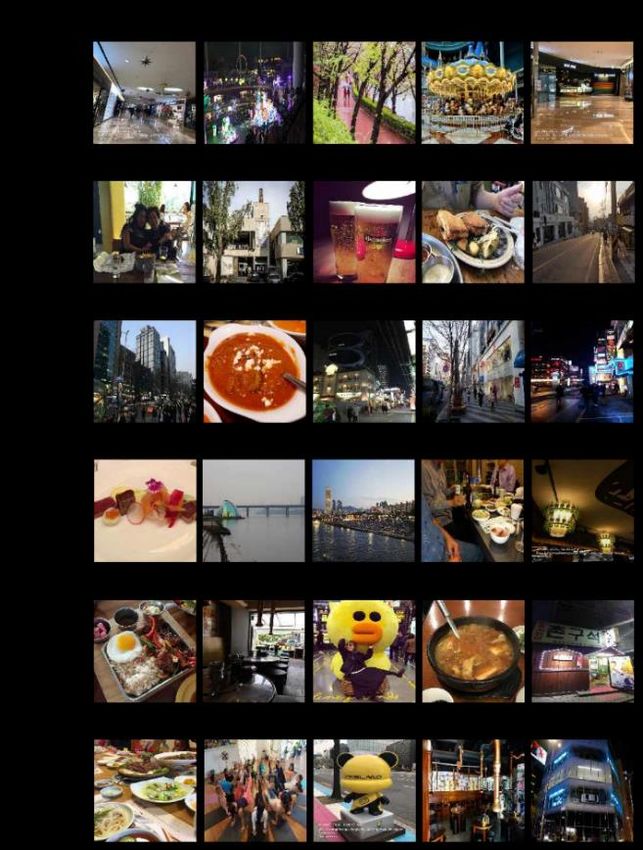
teppanyaki for “hot pot”. We can interpret this findings as 4.2 Comparison of image by RoA
indicative of how iconic dishes of Seoul are only We categorized the photos into 11 RoA in Seoul to
available in Korea. “Pier” which belongs to a subcategory compare their different characteristics. Table 4 shows the
of “facilities” contains the images of Cheonggye Stream, number of photos and proportions included in the photos
the ECC building of Ewha Women’s University, of 11 RoA. There are 20,987 photos including Jongro and
“planetarium” does the images of landmarks such as Namsan, which make up 54.2% of all the photos, and
Dongdaemun Design Plaza while a subcategory of there are 2,584 photos of Shinchon and Hongdae, which
“natural views/flora and fauna” contains the images make up 6.7%. Uploaded photos of other locations were
mostly of sky, the Han River, and mountains. generally similar in number. Figure 6 and 7show the
results of dividing the photos of RoA into 1,000
Proportion categories. The photos of Jongro and Namsan were of
Categories Number of Photos
(%) specific elements such as palace facades, palace gates,
palaces/historical walls, and other structures, while the photos of War
monuments/cultural 6,627 17.1 Memorial and National Museum of Korea included
properties various kinds of cultural properties and historical
objects/miscellaneous 6,211 16.1 monuments. For Shinchon, Hongdae, and Itaewon, there
food 5,899 15.2 are many photos that emphasize not only food itself but
facilities 5,607 14.5 also the interiors of restaurants and other shops,
natural views/flora and especially for Itaewon, where there are many photos of
3,149 8.1
fauna alcohol, such as beers and cocktails. The photos of
shopping 2,316 6.0 Samsung Station, Bongeunsa Temple, Coex Mall, Jamsil,
clothing 2,273 5.9 Gangnam Station, Apgujeong, and Garosu-gil include
transportation 2,204 5.7 various stores and sculptures. More specifically, there
urbanscape 1,469 3.8 were photos of temples for Samsung Station, Bongeunsa
exhibits/sculptures 1,452 3.8 Temple, and Coex Mall, ponds and amusement parks for
religion 502 1.3 Jamsil, urban scape for Gangnam Station, food for
residence 465 1.2 Garosu-gil and Apgujeong. Meanwhile, photos of
entertainment 296 0.8 Yeouido appear to include not only food and restaurants
people 221 0.6 but also Han River.
Total 38,691 100.0 Figure 8 shows the results of assigning 1,000 categories
to 14 primary categories for every RoA. We can see that
Table 3. Classification Results of Photos Uploaded by Tourists tourists who visit Jongro, Namsan, War Memorial of
in Seoul Korea, and National Museum of Korea usually think of
“palace/historical monuments/cultural properties,”
Proceedings of the International Cartographic Association, 2, 2019.
29th International Cartographic Conference (ICC 2019), 15–20 July 2019, Tokyo, Japan. This contribution underwent
single-blind peer review based on submitted abstracts. https://doi.org/10.5194/ica-proc-2-62-2019 | © Authors 2019. CC BY 4.0 License.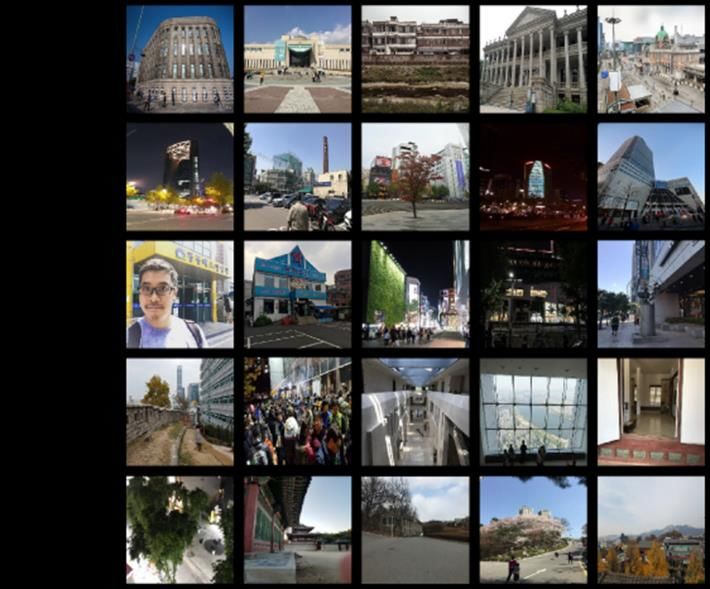
6 of 8

“facilities,” and “objects/miscellaneous.” As the images
for National Museum of Korea categorized as
“objects/miscellaneous” are mostly of historical
monuments or cultural properties, we can see that tourists
who visit the RoA have the images of palaces, historical
monuments, and cultural properties in common.
Meanwhile, tourists who visit Shinchon, Hongdaw,
Itaewon, Gangnam Station, Garosu-gil, and Apgujeong
have the images of “food”, those who visit Samsung
Station, Bongeunsa Temple, Coex Mall, Jamsil, and
Yeouido have the images of “facilities”, and those who
visit Garosu-gil, Jamsil, Gangnam Station, Itaewon,
Shinchon, Hongdae, and Apgujeong have the images of
“shopping”. While the images of Gangnam Station are
related to “urban scape,” the images of Jongro, Namsan,
Samsung Station, Bongeunsa Temple, Coex Mall, and
Yeouido are related to “natural views/flora and fauna.”
Figure 9 shows a map with the 14 primary categories and
representative photos of all RoA.

                                    Number of
           RoA/Outlier                         Proportion (%)
                                     Images
        Jongro, Namsan                  20,987           54.2
      Shinchon, Hongdae                  2,584             6.7
    War Memorial of Korea                1,008             2.6
                                                                     Figure 7. Secondary Categories and Representative
   National Museum of Korea                957             2.5
                                                                     Images per RoA
   Samsun Station, Bongeunsa
                                             872              2.3
      Temple, Coex Mall
             Jamsil                          840             2.2
            Itaewon                          829             2.1
        Gangnam Station                      744             1.9
            Yeouido                          428             1.1
           Garosu-gil                        419             1.1
          Apgujeong                          306             0.8
            Outliers                       8,717            22.5
              Total                       38,691           100.0
Table 4. Number of Photos per RoA

                                                                     Figure 8. Results of Classifying Photos into 14
                                                                     Categories by RoA

Figure 6. Secondary Categories and Representative                    Figure 9. Representative Categories and Images per RoA
Images per RoA

Proceedings of the International Cartographic Association, 2, 2019.
29th International Cartographic Conference (ICC 2019), 15–20 July 2019, Tokyo, Japan. This contribution underwent
single-blind peer review based on submitted abstracts. https://doi.org/10.5194/ica-proc-2-62-2019 | © Authors 2019. CC BY 4.0 License.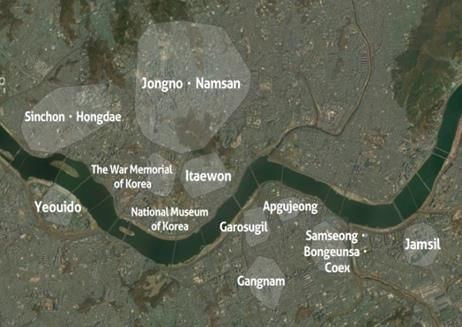
7 of 8

5. Summary and Conclusion                                            Deepak, S. and Chavan, M., 2012, Content-Based Image
In this study we aim to analyze the tourists’ images of               Retrieval: Review. International Journal of Emerging
Seoul by making use of the photos uploaded by visitors                Technology and Advanced Engineering, 2(9): 2250–
on Flickr which is one SNS platforms, from January 1,                 2459.
2015 until December 31, 2017. We were able to find out               Donaire, J., Camprubi, R. and Gali, N. 2014, Tourism
that tourists have a strong image of palaces and historical           Clusters from Flickr Travel Photography, Tourism
monuments and then the iconic cuisine of Seoul (food,                 Management Perspectives, 11: 26–33.
restaurants, etc.) by analyzing the photos uploaded by
                                                                     Géron, A., 2017, Hands-On Machine Learning with
tourists. These characteristics also differed from one RoA
                                                                      Scikit-Learn and TensorFlow, O'Reilly Media.
to another. The images that tourists feel about Jongro and
Namsan are palace and cultural properties, while the                 Hong, T. and Shin, J., 2016, Recommendation Method of
images of Shinchon, Hongdae, Itaewon, Yeouido,                        SNS Following Category Classification of Image and
Garosu-gil, and Apgujeong are food and restaurants. As                Text Information, Smart Media Journal, Korean
for War Memorial of Korea and National Museum of                      Institute of Smart Media, 5(3): 54–61.
Korea, there were many images of monuments that could                ImageNet, http://image-net.org/
be photographed on site as well as the images of artifacts           Jang, H. and Cho, S., 2016, Automatic Tagging for Social
that were on display in the museum. Moreover, there                   Images using Convolution Neural Networks, Journal of
were a combination of images of facilities, temples, and              KIISE, Korean Institute of Information Scientists and
cultural properties around Samsung Station, and the                   Engineers, 43(1): 47–53.
images of toyshops around Jamsil.
Through this study we were able to verify which images               Kádár, B., 2014, Measuring Tourist Activities in Cities
tourists had of Seoul and its various RoA. However, we                Using Geotagged Photography, Tourism Geographies,
were also able to ascertain a research topic that must be             16(1): 88–104.
improved upon in the future. On the other hand, we                   Kagaya, H. and Aizawa, K., 2015, Highly Accurate
recognized that we had a limitation to apply the                      Food/Non-Food Image Classification Based on a Deep
ImageNet’s data set in Korea because it was developed                 Convolutional       Neural    Network,     International
abroad. It was not possible to accurately categorize                  Conference on Image Analysis and Processing, Springer,
certain iconic landmarks of Korea (e.g., Namsan Tower,                350–357.
Dongdaemun Design Plaza, etc.) or traditional elements               Kaneko, T. and Yanai, K., 2013, Visual event mining
that are not widely known (e.g., lamplight, Hanbok, etc.)             from geo-tweet photos, 2013 IEEE International
because of the lack of suitable categories for these images.          Conference on Multimedia and Expo Workshops
Photographs related to palaces and Hanok villages were                (ICMEW), IEEE, 1–6.
also scattered in categories such as 'Palace', 'bell cote' and       Kim, N., Kang, Y., Lee, J., Kim, D. and Park, Y., 2019,
'terrace'. Moreover, in this study we analyzed the images             Tourists Hot Spot Analysis in Seoul Using Geotagged
of Seoul uploaded during a three-year period and                      Web Photos, Seoul City Research, 20(1): 1–17,
discovered that the number of users was severely limited              Forthcoming.
while there were many images available for the study.
This is why the number of images within a specific                   Kisilevich, S., Rohrdantz, C., Maidel, V. and Keim, D.,
category may be overestimated when one user uploads                   2013, What Do You Think about this Photo? A Novel
multiple similar images. Given these factors, there is a              Approach to Opinion and Sentiment Analysis of Photo
need to train the programs with separate data sets based              Comments, International Journal of Data Mining,
on the images uploaded by visitors of Seoul for future                Modelling and Management, 5(2): 138–157.
study. Further, there is also a need to prevent the                  Krishnan, K., Raghesh, M., Midhila and Sudhakar, R.
overestimation of the number of images included in a                  2018, Tensor Flow Based Analysis and Classification of
specific category by eliminating redundant images                     Liver Disorders from Ultrasonography Images,
uploaded by the same users.                                           Computational Vision and Bio Inspired Computing,
                                                                      Springer, Cham, 734–743.
Acknowledgments                                                      Lee, T. and LEE, I., 2017, Animation Character
This research is based on the result of the “Seoul                    Recognition Using Deep Learning, 2017 Journal of
Research Competition 2018,” which is the award for an                 KCGS, Korea Computer Graphics Society, 37–38.
outstanding paper.                                                   Motlagh, N., Jannesary, M., Aboulkheyr, H., Khosravi, P.,
                                                                      Elemento, O., Totonchi, M. and Hajirasouliha, I., 2018,
                                                                      Breast Cancer Histopathological Image Classification:
5. References                                                         A Deep Learning Approach, bioRxiv. DOI:
                                                                      https://doi.org/10.1101/242818.
Ciresan, D., Meier, U., Masci, J., Maria Gambardella, L.
 and Schmidhuber, J. 2011, Flexible, high performance                Okuyama, K. and Yanai, K., 2013, A Travel Planning
                                                                      System Based on Travel Trajectories Extracted from a
 convolutional neural networks for image classification,
 IJCAI Proceedings of the International Joint Conference              Large Number of Geotagged Photos on the Web, In the
 on Artificial Intelligence, 22(1): 1237–1242.                        Era of Interactive Media, Springer, 657–670.

Proceedings of the International Cartographic Association, 2, 2019.
29th International Cartographic Conference (ICC 2019), 15–20 July 2019, Tokyo, Japan. This contribution underwent
single-blind peer review based on submitted abstracts. https://doi.org/10.5194/ica-proc-2-62-2019 | © Authors 2019. CC BY 4.0 License.
8 of 8 Park, S. and Shim, H., 2017, Movie Poster Classification into Genres via Convolutional Neural Network, 2017 Journal of KIISE, Korean Institute of Information Scientists and Engineers, 890–892. Park, J., Yoon, H., Kwon, H., Jeong, W. and Park, J., 2012, Geovisualization of City Image: Focusing on the Evaluation of Representative Image Components of Seoul, Seoul Studies, The Seoul Institute, 13(1):167– 180. Saito, N., Ogawa, T., Asamizu, S. and Haseyama, M., 2018, Tourism Category Classification on Image Sharing Services Through Estimation of Existence of Reliable Results, Proceedings of the 2018 ACM on International Conference on Multinedia Retrieval, ACM, 493–496. Sawant, A., Bhandari, M., Yadav, R., Yele, R. and Bendale, S., 2018, Brain Cancer Detection From MRI: A Machine Learning ApproacH (TENSORFLOW), International Research Journal of Engineering and Technology, 5(4): 2089–2094. Solanki, P. and Gopal, G., 2017, Image Categorization Using Improved Data Mining Technique, Big Data Analytics, Springer, 185–193. Xu, G., Zhu, X., Fu, D., Dong, J. and Xiao, X., 2017, Automatic Land Cover Classification of Geo-Tagged Field Photos by Deep Learning, Environmental Modelling & Software, 91:127–134. Yuan, Y. and Medel, M., 2016, Characterizing International Travel Behavior from Geotagged Photos: A Case Study of Flickr, PloS one, 11(5), e0154885. Zheng, Y., Zha, Z., and Chua, T. 2012, Mining Travel Patterns from Geotagged Photos, ACM Transactions on Intelligent Systems and Technology, 3(3): 56–73. Proceedings of the International Cartographic Association, 2, 2019. 29th International Cartographic Conference (ICC 2019), 15–20 July 2019, Tokyo, Japan. This contribution underwent single-blind peer review based on submitted abstracts. https://doi.org/10.5194/ica-proc-2-62-2019 | © Authors 2019. CC BY 4.0 License.
You can also read