Sustainable Energy - without the hot air
←
→
Page content transcription
If your browser does not render page correctly, please read the page content below
Sustainable Energy – without the hot air
                            David J.C. MacKay

   This remarkable book sets out, with enormous clarity and objectivity, the vari-
ous alternative low-carbon pathways that are open to us.
                                                        Sir David King FRS
                   Chief Scientific Adviser to the UK Government, 2000–08

    For anyone with influence on energy policy, whether in government, business
or a campaign group, this book should be compulsory reading.
                                                              Tony Juniper
                             Former Executive Director, Friends of the Earth

   At last a book that comprehensively reveals the true facts about sustainable
energy in a form that is both highly readable and entertaining.
                                                         Robert Sansom
           Director of Strategy and Sustainable Development, EDF Energy

A ten-page synopsis
We have an addiction to fossil fuels, and it’s not sustainable. The devel-
oped world gets 80% of its energy from fossil fuels; Britain, 90%. And
this is unsustainable for three reasons. First, easily-accessible fossil fu-
els will at some point run out, so we’ll eventually have to get our energy
from someplace else. Second, burning fossil fuels is having a measurable
and very-probably dangerous effect on the climate. Avoiding dangerous
climate change motivates an immediate change from our current use of
fossil fuels. Third, even if we don’t care about climate change, a drastic
reduction in Britain’s fossil fuel consumption would seem a wise move if
we care about security of supply: continued rapid use of the North Sea               Photo by Terry Cavner.

oil and gas reserves will otherwise soon force fossil-addicted Britain to de-
pend on imports from untrustworthy foreigners. (I hope you can hear my
tongue in my cheek.)
    How can we get off our fossil fuel addiction?
    There’s no shortage of advice on how to “make a difference,” but the
public is confused, uncertain whether these schemes are fixes or figleaves.
People are rightly suspicious when companies tell us that buying their
“green” product means we’ve “done our bit.” They are equally uneasy
about national energy strategy. Are “decentralization” and “combined
heat and power,” green enough, for example? The government would have
us think so. But would these technologies really discharge Britain’s duties
regarding climate change? Are windfarms “merely a gesture to prove our
leaders’ environmental credentials”? Is nuclear power essential?
    We need a plan that adds up. The good news is that such plans can be
made. The bad news is that implementing them will not be easy.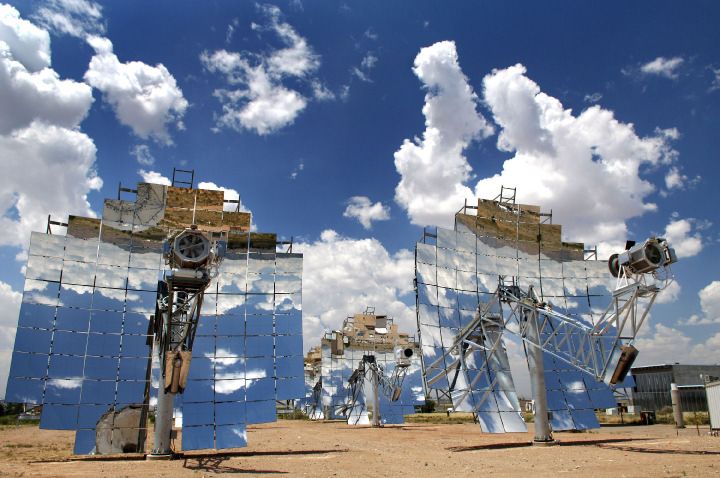
2

                          400                                                                                       Figure 1. Carbon dioxide (CO2 )
                                                                          340                                       concentrations (in parts per million)
                          350                                                                                       for the last 1100 years, measured from
                                                                          330                                       air trapped in ice cores (up to 1977)
                                                                                                                    and directly in Hawaii (from 1958
                          300                                                                                       onwards).
                                                                          320
                                                                                                                    I think something new may have
CO2 concentration (ppm)

                          250                                             310                                       happened between 1800 AD and
                                                                                                                    2000 AD. I’ve marked the year 1769,
                          200                                             300                                       in which James Watt patented his
                                                                                                                    steam engine. (The first practical
                                                                          290
                                                                                                                    steam engine was invented 70 years
                          150
                                                                                                                    earlier in 1698, but Watt’s was much
                                                                                                                    more efficient.)
                                                                          280
                          100

                                                                          270
                           50                                                           1769
                                                                          260
                           0                                                    1600   1700    1800   1900   2000
                                1000   1200   1400   1600   1800   2000

                                                                                                                     Consumption         Production

Part I – Numbers, not adjectives
The first half of this book discusses whether a country like the United                                                Jet flights:
                                                                                                                       30 kWh/d
Kingdom, famously well endowed with wind, wave, and tidal resources,
could live on its own renewables. We often hear that Britain’s renew-
ables are “huge.” But it’s not sufficient to know that a source of energy is
“huge.” We need to know how it compares with another “huge,” namely
                                                                                                                                         Wave: 4 kWh/d
our huge consumption. To make such comparisons, we need numbers, not
adjectives.                                                                                                                              Solar heating:
    Where numbers are used, their meaning is often obfuscated by enor-                                                                     13 kWh/d
                                                                                                                          Car:
mousness. Numbers are chosen to impress, to score points in arguments,                                                 40 kWh/d
rather than to inform. In contrast, my aim here is to present honest, factual
                                                                                                                                             Wind:
numbers in such a way that the numbers are comprehensible, comparable,                                                                     20 kWh/d
and memorable. The numbers are made accessible by expressing them all
in everyday personal units. Energies are expressed as quantities per person
in kilowatt-hours (kWh), the same units that appear on household energy
                                                                                                                    Figure 2. Comparisons of a couple of
bills; and powers are expressed in kilowatt-hours per day (kWh/d), per                                              energy-consuming activities with
person. Figure 2 illustrates a few quantities compared in these units. In                                           conceivable renewable energy
red, for example, driving an average car 50 km per day uses 40 kWh per                                              production from three UK sources.
day. In green on the right, some renewable resources are represented: cov-                                          On the left, driving 50 km per day
ering 10% of the country with wind farms would yield 20 kWh per day per                                             consumes 40 kWh per day, and taking
                                                                                                                    an annual long-range flight by jet uses
person on average.                                                                                                  30 kWh per day (averaged over the
    One reason for liking these personal units is that it makes it much                                             year). On the right, covering the
easier to move from talking about the UK to talking about other countries                                           windiest 10% of Britain with onshore
or regions. For example, imagine we are discussing waste incineration and                                           windfarms would yield 20 kWh per
we learn that UK waste incineration delivers a power of 7 TWh per year                                              day per person; covering every
                                                                                                                    south-facing roof with solar
and that Denmark’s waste incineration delivers 10 TWh per year. (1 TWh                                              water-heating panels would capture
(one terawatt-hour) is equal to one billion kWh.) Does this help us say                                             13 kWh per day per person; and wave
whether Denmark incinerates “more” waste than the UK? While the total                                               machines intercepting Atlantic waves
                                                                                                                    over 500 km of coastline would
                                                                                                                    provide 4 kWh per day per person.
3

power produced from waste in each country may be interesting, I think
that what we usually want to know is the waste incineration per person.
(For the record, that is: Denmark, 5 kWh/d per person; UK, 0.3 kWh/d
per person. So Danes incinerate about 13 times as much waste as Brits.)
By discussing everything per-person from the outset, we end up with a
more transportable book, one that will hopefully be useful for sustainable
energy discussions worldwide.
   With simple honest numbers in place, we are able to answer questions
such as:

  1. Can a country like Britain conceivably live on its own renewable en-
     ergy sources?

  2. Will a switch to “advanced technologies” allow us to eliminate car-
     bon dioxide pollution without changing our lifestyle?

    Part I of Sustainable Energy – without the hot air builds up an illustra-
tive red consumption stack, enumerating the energy cost of a range of
energy-consuming activities; and a complete green stack, adding up all
the potential renewable resources available in Britain.
    While working out the numbers for the left-hand red consumption
stack, we debunk several myths. For example, “leaving mobile phone
chargers plugged in” is often held up as an example of a behavioural eco-
crime, with people who switch their chargers off being praised for “doing            Stuff flows in Britain
their bit.” The truth is that a typical mobile phone charger consumes just            (kg per day, per person)
0.01 kWh per day. The amount of energy saved by switching off the phone         In
charger, 0.01 kWh, is exactly the same as the energy used by driving an
                                                                                Fossil fuels                16
average car for one second. I’m not saying that you shouldn’t switch phone
                                                                                  coal                       4
chargers off. But don’t be duped by the mantra “every little helps.” Ob-
                                                                                  oil                        4
sessively switching off the phone-charger is like bailing the Titanic with a
                                                                                  gas                        8
teaspoon. Do switch it off, but please be aware how tiny a gesture it is.
                                                                                All imports                12.5
     All the energy saved in switching off your charger for one day
                                                                                 food imports               1.6
     is used up in one second of car-driving.
                                                                                 manufactured stuff         3.5
     The energy saved in switching off the charger for one year is              Water                      160
     equal to the energy in a single hot bath.
                                                                                Out
Your charger is only a tiny tiny fraction of your total energy consumption.     Carbon dioxide and
If everyone does a little, we’ll achieve only a little.                          other GHG pollution         30
    Another memorable number is the contribution of long-distance flying        Municipal waste             1.6
to a person’s energy footprint. If you fly to Cape Town and back once per         recycled                 0.27
year, the energy you use in that trip is nearly as big as the energy used by      incinerated              0.13
driving an average car 50 km per day, every day, all year.                        landfilled                1.0
    A significant item in the British energy footprint is stuff. Imported         hazardous waste           0.2
manufactured stuff is usually omitted from Britain’s energy footprint, since      food thrown away          0.3
another country’s industry was responsible for expending the energy; but
that overseas energy cost of making imported manufactured stuff (things         Table 3. Sources: DEFRA, Eurostat,
like vehicles, machinery, white goods, electrical and electronic equipment,     Office for National Statistics,
iron, steel, and dry bulk products) is at least 40 kWh per day per person.      Department for Transport.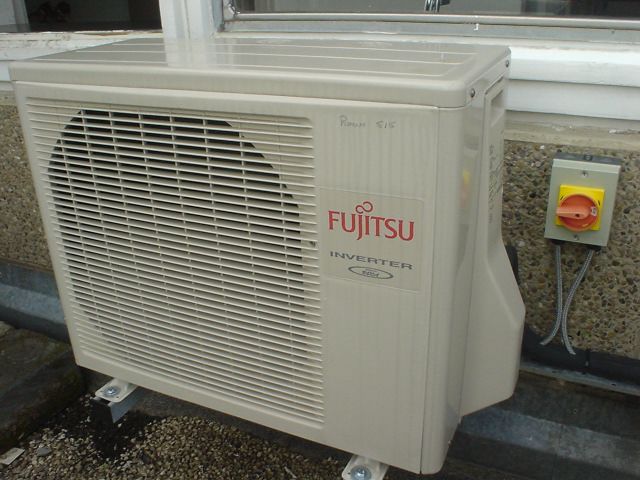
4

    The first half gives two clear conclusions. First, for any renewable facil-         Power per unit land
ity to make an appreciable contribution – a contribution at all comparable                 or water area
to our current consumption – it has to be country-sized. To provide one
                                                                                    Wind                   2 W/m2
quarter of our current energy consumption by growing energy crops, for
                                                                                    Offshore wind          3 W/m2
example, would require 75% of Britain to be covered with biomass plan-
                                                                                    Tidal pools            3 W/m2
tations. To provide 4% of our current energy consumption from wave
                                                                                    Tidal stream           6 W/m2
power would require 500 km of Atlantic coastline to be completely filled
                                                                                    Solar PV panels   5–20 W/m2
with wave farms. Someone who wants to live on renewable energy, but
                                                                                    Plants               0.5 W/m2
expects the infrastructure associated with that renewable not to be large or
                                                                                    Rain-water
intrusive, is deluding himself.
                                                                                     (highlands)        0.24 W/m2
    Second, if economic constraints and public objections are set aside, it would
                                                                                    Hydroelectric
be possible for the average European energy consumption of 125 kWh/d
                                                                                     facility             11 W/m2
per person to be provided from these country-sized renewable sources.
                                                                                    Geothermal        0.017 W/m2
The two hugest contributors would be photovoltaic panels, which, cov-
                                                                                    Solar chimney        0.1 W/m2
ering 5% or 10% of the country, would provide 50 kWh/d per person;
                                                                                    Ocean thermal          5 W/m2
and offshore wind farms, which, filling a sea-area twice the size of Wales,
                                                                                    Concentrating solar
would provide another 50 kWh/d per person on average.
                                                                                    power (desert)        15 W/m2
    Such an immense panelling of the countryside and filling of British
seas with wind machines (having a capacity five times greater than all the
wind turbines in the world today) may be possible according to the laws             Table 4. Renewable facilities have to
                                                                                    be country-sized because all
of physics, but would the public accept and pay for such extreme arrange-           renewables are so diffuse. This table
ments? If we answer no, we are forced to conclude that current consumption          lists the power per unit land-area or
will never be met by British renewables. We require either a radical reduction      sea-area offered by a number of
in consumption, or significant additional sources of energy – or, of course,        renewables.
both.

Part II – Energy plans that add up
The second part of Sustainable Energy – without the hot air explores six
strategies for eliminating the gap between consumption and renewable
production identified in the first part, then sketches several energy plans
for Britain, each of which adds up.
    The first three strategies for eliminating the gap reduce energy demand:
    • population reduction;
    • lifestyle change;
    • changing to more efficient technology.
    The other strategies for eliminating the gap increase energy supply:
    • “Sustainable fossil fuels” and “clean coal” are names given to carry-
      ing on burning coal, but in a different way, with carbon capture and
      storage. What power could we get from coal, “sustainably”?
    • Nuclear power is another controversial option; is it just a stop-gap?
    • A third way to get extra carbon-free power would be to live on re-            Figure 5. Stirling dish engine. These
                                                                                    beautiful concentrators deliver a
      newable energy from other countries – in particular, countries blessed        power per unit land area of 14 W/m2 .
      with plentiful sunshine, large areas, and low population densities.           Photo courtesy of Stirling Energy
      What is the realistic potential of the Sahara desert?                         Systems. www.stirlingenergy.com
5

      current                                                                    Figure 6. Current consumption per
   consumption                                                                   person in “cartoon Britain 2008” (left
                                                                                 two columns), and a future
                                                                                 consumption plan, along with a
                          losses in                                              possible breakdown of fuels (right
                         conversion                                              two columns). This plan requires that
                        to electricity                                           electricity supply be increased from
                                              future             consumption
                                                                 breakdowns      18 to 48 kWh/d per person of
                                           consumption
                                                                                 electricity.

                         Electrical          Electrical
                                                                  Electricity:
                          things:             things:
                                                                  18 kWh/d
                         18 kWh/d            18 kWh/d

                                         efficiency
                                                                  Electricity:
       Energy                                                     12 kWh/d
       inputs:           Heating:
     125 kWh/d           40 kWh/d                                  Pumped
                                             Heating:
                                                                    heat:
                                             30 kWh/d
                                                                  12 kWh/d
                                                             Wood: 5 kWh/d

                                                            Solar HW: 1 kWh/d

                                         efficiency
                                                             Biofuel: 2 kWh/d
                         Transport:
                         40 kWh/d
                                             Transport:           Electricity:
                                             20 kWh/d             18 kWh/d

                 2008                                     2050

    To sharpen the discussion, this part of the book simplifies Britain into a
cartoon featuring just three categories of consumption: transport, heating,
and electricity.
    Five energy plans for Britain are presented, all of which reduce the
energy demand by electrifying transport and by electrifying heating (us-
ing heat pumps). Electric vehicles serve a second convenient function:
the charging of their batteries is a large electricity demand that is easily
turn-off-and-onable, so smart battery-charging would help match supply
to demand in a renewable-heavy or nuclear-heavy electricity network.
    The electrification of transport and heating of course requires a substan-
tial increase in electricity generation. The five plans supply this required
electricity using five different mixes of the carbon-free options. The mixes
represent different political complexions, including plan G, the Green plan,
which forgoes both “clean coal” and nuclear power; plan N, the NIMBY
plan, which makes especially heavy use of other countries’ renewables;
and plan E, the Economist’s plan, which focuses on the most economical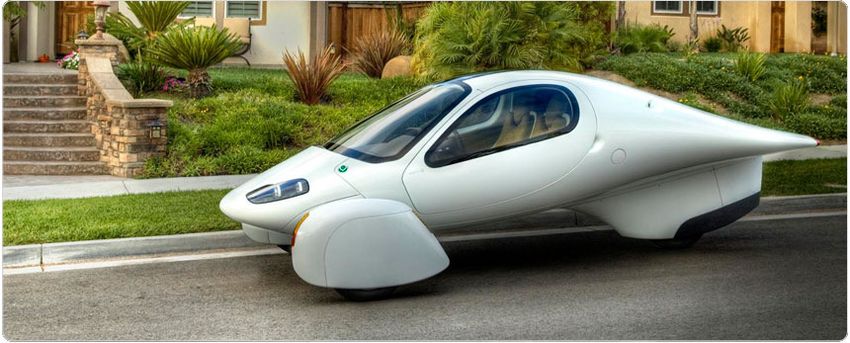
6

      plan D          plan N           plan L           plan G               plan E

                                                        Solar in
                                      Solar in         deserts: 7
    Clean coal:      Solar in
                                      deserts:
    16 kWh/d         deserts:                          Tide: 3.7
                                     16 kWh/d
                    20 kWh/d
                                                        Wave: 3
                                                       Hydro: 0.2        Nuclear:
      Nuclear:                       Clean coal:                        44 kWh/d
                    Clean coal:                        Waste: 1.1
     16 kWh/d                        16 kWh/d
                    16 kWh/d                            Pumped
     Tide: 3.7                        Tide: 3.7          heat:
      Wave: 2        Nuclear:         Wave: 2          12 kWh/d
     Hydro: 0.2     10 kWh/d         Hydro: 0.2
                                                    Wood: 5 kWh/d           Tide: 0.7
     Waste: 1.1       Tide: 1         Waste: 1.1
                                                      Solar HW: 1       Hydro: 0.2
      Pumped        Hydro: 0.2        Pumped           Biofuel: 2           Waste: 1.1
       heat:         Waste: 1.1        heat:             PV: 3
     12 kWh/d                        12 kWh/d                            Pumped
                     Pumped                                               heat:
Wood: 5 kWh/d         heat:        Wood: 5 kWh/d
                                                                        12 kWh/d
    Solar HW: 1     12 kWh/d         Solar HW: 1
                                                       Wind: 32       Wood: 5 kWh/d
     Biofuel: 2   Wood: 5 kWh/d       Biofuel: 2
    PV: 3 kWh/d                        PV: 3                            Solar HW: 1
                    Solar HW: 1
                                                                            Biofuel: 2
Wind: 8 kWh/d        Biofuel: 2       Wind: 8
                      Wind: 2                                               Wind: 4

                                                                                 Figure 7. Five energy plans for Britain.
                                                                                 All these supply-side plans assume
carbon-free choices: onshore wind farms, nuclear power, and a handful of
                                                                                 that demand has been substantially
tidal lagoons.                                                                   reduced by efficiency savings in
    These plans make clear the building blocks from which we must create         heating and transport.
our low-carbon future.
    Any plan that doesn’t make heavy use of nuclear power or “clean coal”
has to make up the energy balance using renewable power bought in from
other countries. The most promising renewable for large-scale develop-
ment is concentrating solar power in deserts. Concentrating solar power
uses various combinations of moving mirrors, molten salt, steam, and heat
engines to generate electricity.

                                                                                 Figure 8. Andasol – a “100 MW” solar
                                                                                 power station under construction in
                                                                                 Spain. Excess thermal energy
                                                                                 produced during the day will be
                                                                                 stored in liquid salt tanks for up to
                                                                                 seven hours, allowing a continuous
                                                                                 and stable supply of electric power to
                                                                                 the grid. The power per unit land
                                                                                 area will be 10 W/m2 .
                                                                                 Photo: IEA SolarPACES.
7

    To convey the scale of energy plans that add up, figure 9 shows a map
of Britain bearing a sixth plan. This sixth plan features every possible low-
carbon energy source, and lies roughly in the middle of the first five, so I
call it plan M.

                                                                                Figure 9. Plan M. A plan that adds
   Solar in                                                                     up, for Scotland, England, and Wales.
   deserts:                                                                     The grey-green squares are wind
  16 kWh/d                                                                      farms. Each is 100 km2 in size and is
 Clean coal: 3                                                                  shown to scale.
                                                                                The red lines in the sea are wave
                                                                                farms, shown to scale.
   Nuclear:                                                                     Light-blue lightning-shaped
  16 kWh/d                                                                      polygons: solar photovoltaic farms –
                                                                                20 km2 each, shown to scale.
   Tide: 3.7                                                                    Blue sharp-cornered polygons in the
   Wave: 0.3                                                                    sea: tide farms.
  Hydro: 0.2                                                                    Blue blobs in the sea (Blackpool and
                                                                                the Wash): tidal lagoons.
  Waste: 1.1
                                                                                Light-green land areas: woods and
   Pumped                                                                       short-rotation coppices (to scale).
    heat:                                                                       Yellow-green areas: biofuel (to scale).
  12 kWh/d                                                                      Small blue triangles: waste
                                                                                incineration plants (not to scale).
Wood: 5 kWh/d                                                                   Big brown diamonds: clean coal
  Solar HW: 1                                                                   power stations, with cofiring of
   Biofuel: 2                                                                   biomass, and carbon capture and
     PV: 2                                                                      storage (not to scale).
                                                                                Purple dots: nuclear power stations
   Wind: 8                                                                      (not to scale) – 3.3 GW average
                                                                                production at each of 12 sites.
                                                                                Yellow hexagons across the channel:
                                                                                concentrating solar power facilities in
                                                                                remote deserts (to scale, 335 km2
                                                                                each). The pink wiggly line in France
                                                                                represents new HVDC lines, 2000 km
                                                                                long, conveying 40 GW from remote
                                                                                deserts to the UK.
                                                                                Yellow stars in Scotland: new
                                                                                pumped storage facilities.
                                                                                Red stars: existing pumped storage
                                                                                facilities.
                                                                                Blue dots: solar panels for hot water
                                                                                on all roofs.

   My goal is not to pick winners, but to present honest quantitative facts
about all the options. Having said that, I now highlight a few sacred cows
that don’t fare too well under the spotlight of quantitative attention, and a
few that do.
   Bad: Hydrogen-powered vehicles are a disaster. Most prototype hydro-
gen-powered vehicles use more energy than the fossil-fuel vehicle they re-
place. The BMW Hydrogen 7 uses 254 kWh per 100 km (while the average
fossil car in Britain uses 80 kWh per 100 km). Good: In contrast, prototype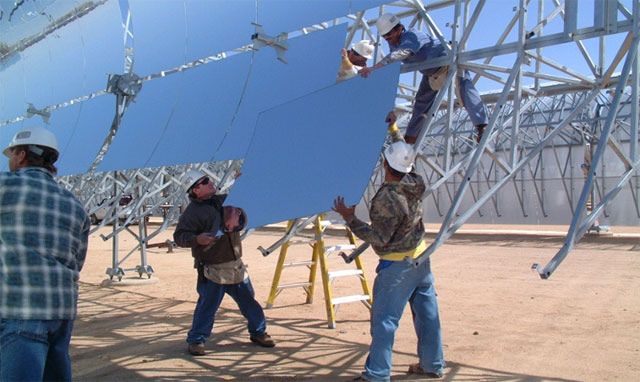
8
electric vehicles use ten times less energy: 20 kWh per 100 km or even
6 kWh per 100 km. Electric vehicles are far better than hybrid cars. Today’s
hybrid cars, which are typically at best about 30% better than fossil cars,
should be viewed as a brief helpful stepping stone on the way to electric
vehicles.
Figure 10. Bad: BMW Hydrogen 7. Figure 11. Good: The Tesla Roadster Figure 12. Good: The Aptera. 6 kWh
Energy consumption: 254 kWh per electric car. Energy consumption: per 100 km. Photo from
100 km. Photo from BMW. 15 kWh per 100 km. www.aptera.com.
www.teslamotors.com.
Bad: Decentralized combined heat and power is another looming mis-
take. Yes, combined heat and power (that is, putting individual power
stations in each building, generating local electricity and heat to keep the
buildings warm) can be a slightly more efficient way of using fossil fuels
than the standard way (that is, centralized power stations and local con-
densing boilers). But they are only about 7% more efficient. And they
use fossil fuels! Isn’t the goal to get off fossil fuels? The fact is, there is a
much better way to generate local heat: heat pumps. Good: Heat pumps
are back-to-front refrigerators. Powered by electricity, they pump heat into
the building from the outside – either from the air, or from the ground.
The best heat pumps, recently developed in Japan, have a coefficient of
performance of 4.9; this means that using 1 kWh of electricity, the heat
pump delivers 4.9 kWh of heat in the form of hot air or hot water. This
is a far more efficient way to use high-grade energy to make heat, than
simply setting fire to high-grade chemicals, which achieves a coefficient of
performance of only 0.9.
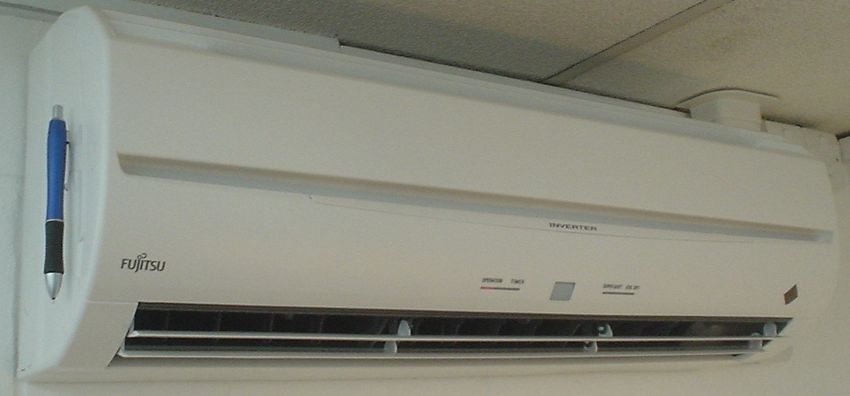
Figure 13. Good: The inner and outer
bits of an air-source heat pump that
has a coefficient of performance of 4.
The inner bit is accompanied by a
ball-point pen, for scale. One of these
Fujitsu units can deliver 3.6 kW of
heating when using just 0.845 kW of
electricity. It can also run in reverse,
delivering 2.6 kW of cooling when
using 0.655 kW of electricity.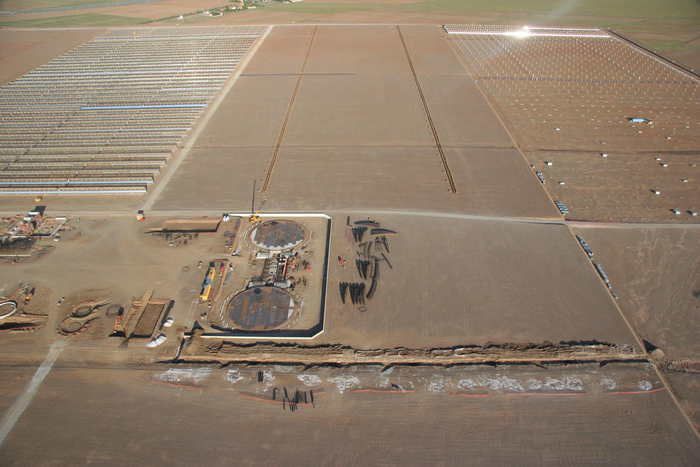
9

                                                                                Figure 14. Bad: An Ampair “600 W”
                                                                                micro-turbine. The average power
                                                                                generated by this micro-turbine in
                                                                                Leamington Spa is 0.037 kWh per day
                                                                                (1.5 W).

   Bad: Roof-mounted micro-wind turbines are an utter waste of re-
sources. They never pay for themselves. Good: In contrast, roof-mounted
solar water heaters are a no-brainer. They really work: even in Britain,
where the sunniness is only about 30%, a modest 3-m2 panel can supply
half of a typical family’s hot water.

                     8
                                       total heat generated
                                                                                Figure 15. Good: Solar power
                     7                                                          generated by a 3 m2 hot-water panel
                         immersion heater
                     6                                                          (green), and supplementary heat
     power (kWh/d)

                     5
                                                                                required (blue) to make hot water in
                                           hot water used
                                                                                the test house of Viridian Solar. (The
                     4
                                                                                photograph shows a house with the
                     3
                                                                                same model of panel on its roof.) The
                     2                                                          average solar power from 3 m2 was
                     1   solar power                                            3.8 kWh/d. The experiment simulated
                                            controller
                     0                                                          the hot-water consumption of an
                         J   F M A M J            J      A S O N D              average European household – 100
                                                                                litres of hot (60 ◦ C) water per day. The
                                                                                1.5–2 kWh/d gap between the total
    Bad: Turning phone chargers off is a feeble gesture, like bailing the Ti-   heat generated (black line, top) and
tanic with a teaspoon. The widespread inclusion of “switching off phone         the hot water used (red line) is caused
chargers” in lists of “10 things you can do” is a bad thing, because it dis-    by heat-loss. The magenta line shows
tracts attention from more-effective actions that people could be taking.       the electrical power required to run
                                                                                the solar system. The average power
Good: Turning the thermostat down is the single most effective energy-
                                                                                per unit area of these solar panels is
saving technology available to a typical person – every degree you turn it      53 W/m2 .
down will reduce your heating costs by 10%; and heating is likely to be the
biggest form of energy consumption in most British buildings. Figure 16
shows data from my house.
    This book isn’t intended to be a definitive store of super-accurate num-
bers. Rather, it’s intended to illustrate how to use approximate numbers
as a part of constructive consensual conversations. This book doesn’t ad-
vocate any particular energy plan or technology; rather, it tells you how
many bricks are in the lego box, and how big each brick is, so the reader
can figure out for himself how to make a plan that adds up.
10
                                                                   condensing boiler installed
                                                                               61                                            Figure 16. My domestic gas
                                                                                                                             consumption, each year from 1993 to
                                                                                                      lower thermostat
                      20                                                              50   50                                2007. Each line shows the cumulative
                                                    47                                                     more insulation   consumption during one year in kWh.
                                                              43          44
                                                                                                                             The number at the end of each year is
                                      d
                                   h/                               41
gas used (1000 kWh)

                                                                                                             more glazing
                                  kW
                      15                  36
                                                                                                                             the average rate of consumption for
                                40

                                                                                                 35
                                               33        34                                                                  that year, in kWh per day.
                                                                                                       32
                                                                                                                             Meter-readings are indicated by the
                                                                                                              26
                      10                                                                                                     blue points. Evidently, the more
                                                                                                                             frequently I read my meter, the less
                                                                                                                    13
                                                                                                                             gas I use!
                      5

                      0
                           93    94       95   96   97   98   99 2000 01       02    03    04    05   06      07   08

 Part III – Technical chapters
 The third part of the book drills down to the physical foundations of en-
 ergy consumption and energy production. Eight appendices show from
 first principles where the numbers in the first two parts come from. These
 appendices explain, for example, how cars can be made significantly more
 energy-efficient, and why planes cannot; and they explain how the power
 from wind farms, tide farms, and wave farms can all be calculated on the
 back of an envelope. Whereas the bulk of the book is intended to be ac-
 cessible to everyone who can add, multiply, and divide, these technical
 appendices are aimed at readers who are comfortable with formulae like
 “ 12 mv2 ”.

                                                                                                                             Figure 17. Flow of air past a windmill.
                                                                                                                             The air is slowed down and splayed
                                                                                                                             out by the windmill.

 Part IV – Useful data
 The final sixteen pages of the book contain further reference data and con-
 version factors, useful for applying the book’s ideas to other countries, and
 for translating to and from units used by other organizations.
                                                                                                 December 2, 2008            Further information
                                                                                                                             The book is available for free online at
                                                                                                                             www.withouthotair.com. The book is
                                                                                                                             published by UIT Cambridge on 2nd De-
                                                                                                                             cember 2008 in the UK, and on 1st April
                                                                                                                             2009 in North America.
                                                                                                                             David MacKay is Professor of Natural Phi-
                                                                                                                             losophy in the Department of Physics at the
                                                                                                                             University of Cambridge.
You can also read