INTERIM RESULTS PRESENTATION - 15 OCTOBER 2020 Piet Mouton PSG Group CEO
←
→
Page content transcription
If your browser does not render page correctly, please read the page content below
INTERIM RESULTS PRESENTATION
           15 OCTOBER 2020
              Piet Mouton
             PSG Group CEO

1
Agenda

    1. Material transactions and significant changes

    2. PSG 3.0 – A smaller but more nimble company

    3. PSG Group underlying investee companies

    4. PSG Alpha investments

    5. PSG Group underlying investee companies - Websites

    6. Questions

2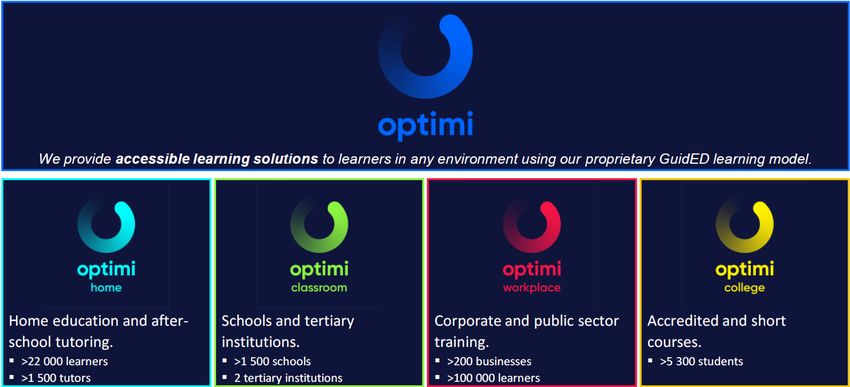
Material transactions and
  significant changes
Capitec unbundling – Theoretical shareholder value unlock (for illustrative purposes)

                                                                                                1. PSG Group traded at a 43.2% discount to its
                                                                                  9 Oct 20         SOTP value as at 9 Oct 20
    Value attributable to shareholders post the Capitec unbundling
    PSG Group SOTP value per share (R)                                                  82.80   2. The unbundled Capitec value per PSG Group
    PSG Group discount to SOTP value as at 9 Oct 201                                    43.2%      share is based on the unbundling ratio of 14
    Current share price (R)                                                             47.03      Capitec shares for every 100 PSG Group shares
    Unbundled Capitec per PSG Group share (R)2                                         148.23
                                                                                                   held. The Capitec share price was R1,058.77
                                                                                                   per share as at 9 Oct 20
    Value attributable to a PSG Group share (R)                                        195.26

                                                                                                3. PSG Group’s 12-month average discount was
    Value attributable to a PSG Group share had PSG Group not unbundled Capitec
                                                                                                   25.9% prior to the Capitec unbundling
    PSG Group SOTP value per share(R)                                                   82.80      announcement. This discount is used to
    Unbundled Capitec per PSG Group share (R)2                                         148.23      determine the theoretical PSG Group share
    Theoretical PSG Group SOTP value per share (R)                                     231.03      price had PSG Group not unbundled Capitec
    PSG Group discount to SOTP value prior to the Capitec unbundling3                   25.9%
    Theoretical PSG Group share price (R)                                              171.18   4. The value unlocked is calculated as the
                                                                                                   difference between the value attributable to
    Value unlocked per PSG Group share (R) 4                                            24.08
                                                                                                   PSG Group shareholders post the unbundling
                                                                                                   of Capitec and the theoretical PSG Group share
    Value unlocked per PSG Group share                                                  14.1%
                                                                                                   price had PSG Group not unbundled Capitec

4
     4
Curro – Rights offer
Curro raised R1.5bn from shareholders by way of a partially
underwritten non-renounceable rights offer at R8.07 per share

Rationale for the rights offer:
•    For prudency purposes, proactively reduce Curro’s debt due to uncertainty
     created by COVID-19
•    Raise additional capital for potential opportunities that have presented
     themselves in the current market

PSG Group’s involvement:
•    PSG Group underwrote R1.15bn of the R1.5bn rights issue
•    It ultimately invested R1.05bn, thereby increasing its interest in Curro by
     ~5% to ~60% at R8.07 per share

 5
PSG Group – Change in status to Investment Entity
PSG Group’s status changed to that of an Investment Entity with effect
from 1 Mar 20

Reasons for its change in status:
•   PSG Group undertook significant corporate action during the interim period
    under review, including the unbundling of Capitec, whereby the criteria for
    classification as an Investment Entity were met with effect from 1 Mar 20
•   Such reassessment necessitated a change in accounting policy whereby
    investee subsidiaries are accounted for at fair value instead of normal
    consolidation procedures, with no restatement of comparatives required
The impact of the change in accounting policy:
•   Considering PSG Group’s objective of wealth creation on a per share basis
    through capital appreciation, investment income, or both, the change in
    accounting policy should now provide users of PSG Group’s financial
    statements with more relevant and transparent information to assess PSG
    Group’s performance from a valuation perspective
•   PSG Group continues to use its SOTP value per share as key performance
    measure, being consistent with its aforementioned policy to account for its
    investments on a fair value basis

6
PSG 3.0 –
A smaller but more nimble company
PSG Group’s objective remains unchanged:
    “To create wealth for shareholders on a per share basis”

    Grow the underlying
                                                              Pay dividends
        businesses

                          Sell/unbundle investments when
                                     opportune
                                          +
                          Other value-enhancing initiatives

8
Economic reality
Lost decade COVID-19 Uncertainty
• State capture • Q2 GDP retraction of • Stick to our investment philosophy
• Corruption 16.4% • Manage liquidity at a PSG Group level
• Malmanagement of SOEs • ~3m jobs lost › All term debt comprising redeemable prefs has
• Destruction of state organs • Economy struggling been repaid
• Spiraling government debt and business › PSG Group’s dividend policy has been changed
confidence at a record for prudency purposes
low › PSG Group is in a healthy liquidity position
• SA Inc downgraded • Underlying investee companies
with negative outlook › Performed scenario analyses to better
• Lockdown restrictions understand the potential impact of COVID-19
still affecting many on their operations and finances
businesses, especially › PSG Group will continue to support their
tourism and hospitality growth
• New opportunities will continuously be evaluated
and, if attractive, be pursued
9Investment philosophy – early-stage investing
New investments should be in large
• High-growth companies should have stronger balance sheets and markets:
make limited use of debt › Banking
• Management cannot simultaneously focus on high-growth › Energy
(J-curve) investment opportunities and on servicing debt: › Education
› Loss of focus and conservatism If successful, the returns should be
• Window to capture the market substantial
Large inefficient incumbents:
› “Free” services
(Education and Energy)
Fragmented:
› IFAs
› Retirement villages
Best management teams:
› Think different
Best operating models:
› Service
› Pricing
› Experience
10PSG Group investment & exit philosophy vs company life cycle
Rebirth
Profits
Growth Mature/
slows sustain
High
growth
Decline
Start-up
Time
PSG Group invests Greatest returns are made during this Exit investment Remain invested and the process restarts if we
during this period period. PSG Group holds and strives to can deliver a “rebirth” of the business
11 increase stakeSouth African investment holding companies – Premium/(discount) to their SOTP values
South African investment holding companies’
15% Premium/(Discount) (%)
5%
(5%)
(15%)
(25%) (21%)
(22%)
(25%) (24%)
(35%) (31%)
(35%)
(45%) (40%)
(44%)
(48%)
(55%) (51%)
(65%)
(75%)
FY 16 H1 FY17 FY 17 H1 FY18 FY 18 H1 FY19 FY 19 H1 FY20 FY 20 Oct 20
PSG Group IHC 1 IHC 2 IHC 3 IHC 4 IHC 5 Average
*IHC – South African investment holding company
12Why are holding companies trading at such material discounts?
Permanent capital:
• PSG Group’s strategy has always been to create shareholder wealth
› We are not and have never been focused on the size of our group, but rather on per share wealth creation
• PSG Group is a long-term investor – not a permanent investor
Fee/cost structures:
• PSG Group management do not charge a fee to manage its underlying assets
• Our head office costs to manage PSG Group and PSG Alpha’s investments (annualised post Capitec unbundling):
› Relative to SOTP ~0.3%
› Relative to Market Capitalisation ~0.5%
Poor investment decisions:
• Capitec was an exceptional investment
• By and large our other investments also outperformed the JSE All Share Index having delivered ~15% per annum since Feb 2010
Too many listed entry points:
• This is a legacy issue and will be very difficult to address in the short term
13PSG Group – SOTP value
28 Feb 19 29 Feb 20 31 Aug 20 9 Oct 20
1. PSG Alpha’s investee valuations are now presented
Asset/(liability) Rm Rm Rm Rm
separately – more info on PSG Alpha investee
PSG Konsult* 8,700 6,399 5,768 6,391
companies has been included
Capitec* 46,351 46,130 2,702 3,214
Curro* 5,714 2,604 1,872 3,211
2. PSG Group was trading at a 43.2% discount to its SOTP
Zeder* 3,166 3,173 1,796 1,826
value as at 9 Oct 20
PSG Alpha 4,712 3,618 3,497 3,525
CA&S** 1,075 1,130 1,180 1,191
Evergreen^ 832 975 921 921
Stadio* 1,277 662 542 582 SHARE OF ASSETS - 9 OCT 20
Optimi^ 447 305 187 187 4.2%
Energy Partners^ 572 118 266 277
Other investments^ 599 499 470 436 18.6%
Less : minority shareholding held by PSG Alpha management (90) (71) (69) (69) 33.7%
Dipeo^
Other net assets 1,702 879 1,842 797
Cash^^ 323 187 1,915 943
Pref investments and loans receivable^^ 1,297 542 448 549 9.6%
Other^^ + 82 150 (521) (695)
Total assets 70,345 62,803 17,477 18,964
Perpetual pref funding* (1,367) (1,463) (1,093) (1,080)
Other debt^^ (1,020) (1,020)
Total SOTP value 67,958 60,320 16,384 17,884 16.9% 16.9%
Shares in issue (net of treasury shares) (m) 218.2 218.2 216.0 216.0 PSG Konsult Capitec Curro
Zeder PSG Alpha Other net assets
SOTP value per share (R) 311.45 276.43 75.86 82.80
Share price (R) 259.78 186.60 45.00 47.06
*Listed on the Johannesburg Stock Exchange **Listed on the Botswana Stock Exchange ^Internal valuation ^^Carrying value
+
The 31 Aug 20 and 9 Oct 20 balances include a capital gains tax liability in respect of the Capitec shares disposed of and the retained interest
14 Note : PSG Group's live SOTP containing further information is available at www.psggroup.co.za
14PSG Group share price vs SOTP value per share
PSG Group share price vs SOTP value per share Discount
350 (31 Aug 15 - 9 Oct 20)
300 Latest discount ~43.2%
250 12-month average discount
200 ~25.9%
150
100
82.80
Liquidity (per annum)
50 31 Aug 20 91.1%
47.06
-
29 Feb 20 48.9%
Aug 15 Aug 16 Aug 17 Aug 18 Aug 19 Aug 20
28 Feb 19 47.1%
SOTP value (R) Share price (R)
28 Feb 18 68.8%
28 Feb 17 30.0%
PSG Group premium/(discount) to the SOTP value (%)
50% 29 Feb 16 50.0%
(31 Aug 15 - 9 Oct 20)
28 Feb 15 16.7%
30%
10%
(10%)
(30%) (43.2%)
(50%)
Aug 15 Aug 16 Aug 17 Aug 18 Aug 19 Aug 20
15PSG Group’s dividend policy
Previous dividend policy:
• Pay up to 100% of available free cash flow as an ordinary dividend
• For the previous 5 years (i.e. prior to the SA Reserve Bank’s Guidance Note 4/2020 discouraging banks from paying dividends for the
time being), the Capitec dividend PSG Group received constituted ~60% on average of the PSG Group dividend paid to shareholders
• Following the unbundling of Capitec, PSG Group shareholders will receive the Capitec dividend directly
• Given that management anticipates that PSG Group may continue to trade at a discount to its SOTP value, and that the equity markets
will hence essentially remain closed for capital raisings, the board has adopted a more prudent dividend policy
New dividend policy:
• To pay ad hoc dividends as and when circumstances allow
• Accordingly, ad hoc dividends may be considered from time to time, also while the SA Reserve Bank’s Guidance Note remains in place
PSG Group will pay an ad hoc interim gross dividend of 164cps
16
16PSG Group underlying investee
companiesRecurring headline earnings per share increased by 9%
30 Jun 20:
• Schools: ↑ from 166 to 177
• Learners: ↑ from 57,597 to 59,967
› Learner numbers pre COVID-19 was 62,482
› Pre-school (excl. Grade R) was most affected, representing 72.6% of the 2,515 net leavers
COVID-19 – business continuity with school closure:
• Curriculum: Remote and online learning strategies deployed (for learners up to Grade 12); specific material developed and electronically
delivered for primary and high school learners
• Sport: All activities cancelled, but learners provided with home-based training programs
• Culture: Curro Create (performing arts) continues to present national Eisteddfod; all material delivered and adjudicated via online channels
30 Jun 20 financial drivers:
• Revenue: ↑ 7% to R1.6bn
• Bad debts as a percentage of revenue: ↑ from 1.3% to 5.2%
• Discounts as a percentage of revenue: ↑ from 7.8% to 12.8%
• R1.5bn rights issue concluded to bolster balance sheet/reduce debt given uncertainty and to have a war chest for opportunities
19Recurring headline earnings per share increased by 7%
Share of recurring headline earnings
Wealth management:
• AUM: ↑ 11% to R213.7bn (since 29 Feb 20)
• Net inflows (6 months): R6.3bn
66%
• Advisers: ↑ 4 to 563 (since 29 Feb 20)
• Recurring headline earnings: ↑ 25% to R219m
Insure:
• Gross written premium: ↓ 2% to R3.3bn (compared to H2 2020)
• Advisers: ↓ 1 to 375 19%
• Underwriting margin increased from 10.4% to 13.2%
• Shareholders investment income: ↑ 34.4% to R16.8m
• Recurring headline earnings: ↑ 17% to R63m
Asset management:
• AUM: ↓ 14% to R31.5bn (since 29 Feb 20) 15%
• Net outflows (6 months): R4.2bn
• Recurring headline earnings: ↓ 39% to R50m
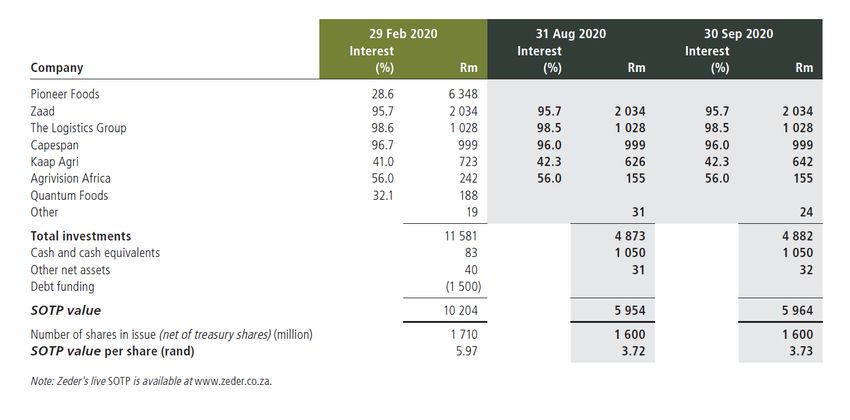
21SOTP value
• Zeder’s SOTP value per share decreased to R3.73 as at 30 Sep 20
› The decrease is largely attributable to the disposal of its investment in Pioneer Foods and the subsequent special dividend paid
to shareholders of R2.30 per share
23Zeder
• Zeder shares PSG Group’s DNA with its core objective of shareholder wealth creation
• The agriculture and related sectors’ performance has been adversely affected by challenging weather and economic conditions
in recent years
• Uncertainty created by discussions in parliament (in the last couple of years) regarding “Expropriation Without Compensation”
has curtailed investment in these sectors
• Zeder has traded at a substantial discount to its SOTP value for an extended period and the actions to date (which include the
disposal of its investments in Pioneer Foods and Quantum Foods at significant premiums) have unlocked value for shareholders,
but more can be done
• However, patience will be required as there are no short-term solutions
• Furthermore, we need to understand what impact COVID-19 will have on the investee companies and the economy in general
over the short to medium term
2425
PSG Alpha – Historical financial performance

                                                                                         SOTP value per share (R)
         3.50

         3.00                                                                                               2.90 *                   CAGR: 10.1% (5.5-year period)

         2.50                                                                                                                           2.40

         2.00                                                                                                                                                      1.80                       1.70
                                                                                  1.62
         1.50                                          1.21
                            1.00
         1.00

         0.50

            -
                            FY15                       FY16                       FY17                       FY18                       FY19                       FY20                     FY21H1

         *The FY18 and FY19 values were significantly impacted by the Stadio component value at the time. Post unbundling from Curro, investor sentiment drove Stadio’s share price to R6.75 as
         at 28 Feb 18. The price has normalised since.

     •          SOTP value per share decreased by 5.3% during the interim period under review, mostly due to the effects of COVID-19 on the portfolio

     •          PSG Alpha’s current SOTP value is R3.6bn

     •          PSG Alpha does not employ any gearing, nor are there any operating costs at its level

26
PSG Alpha – SOTP value
As at 31 Aug 20
Total value PSG Alpha share of
Investment Shareholding % (Rm) value (Rm) Basis of valuation
CA&S 47.3% 2,491 1,180 Listed (BSE/4AX)
Evergreen 50.0% 1,841 921 NAV (excluding deferred tax)
Stadio 44.4% 1,220 542 Listed (JSE)
Optimi 86.2% 216 187 PE valuation
Energy Partners 56.0% 464 266 EV/EBITDA multiple
Other investments 470
Total SOTP 3,566
• PSG Alpha generally values its investments conservatively
• It should be noted that these valuations are not an indication of the values at which PSG Alpha would consider
selling any of its investments
2749%
Business overview
• CA&S Group is the parent company of a collection of FMCG businesses that operate across the
Southern African region
• CA&S Group delivers various FMCG related route-to-market services to blue chip manufacturers. The
service offering includes selling, merchandising, warehousing, distribution, shopper promotions,
training and debtor administration
• Listed on the Botswana Stock Exchange (BSE) and 4AX in South Africa
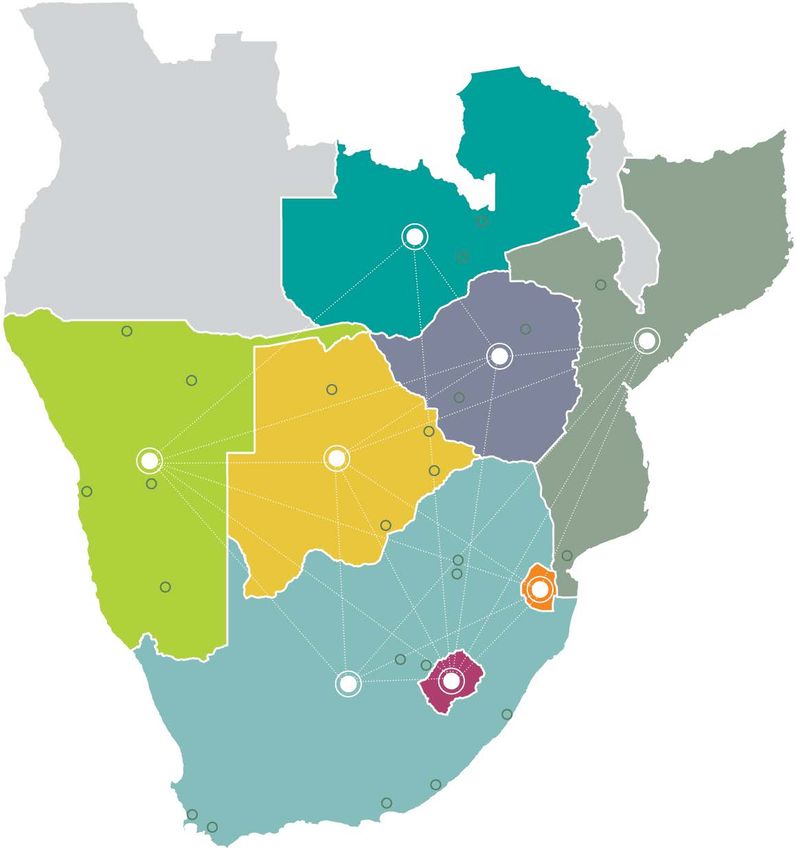
29Business model
ZAMBIA
• The CA&S businesses provide • Expo Africa
• Promexs
various services to the principles
it represents. They earn a NAMIBIA
combination of service fees and • Wutow
• Expo Africa
commission • PacknStack
• SMC Brands
• Local knowledge, understanding
BOTSWANA ZIMBABWE
and customer relationships • CA Sales & Distribution • Bull Red Distribution
combined with regional • Expo Africa
• Kalahari Training Institute
• Expo Africa
connectivity and shared collective • PEO Promotions
• SMC Brands KINGDOM OF ESWATINI
expertise give CA&S Group • Smithshine Enterprises • Expo Africa
a powerful competitive advantage • SuraPax • Logico Unlimited
• SMC Brands
in the region SOUTH AFRICA
LESOTHO
• Array Marketing
• EDGE Logistics • Expo Africa
• PacknStack • SMC Brands
• SuraPax • Whitakers
30Basis of valuation: Listed share price
• Valuation of CA&S for PSG Alpha’s SOTP is based on the closing share price on the Botswana Stock Exchange (BSE)
• Its 31 Aug 20 closing share price of R5.51 represents a 10.8x historic PE ratio based on CA&S’s 2019 recurring
headline earnings of R230m
H1 commentary:
Historic headline earnings*
250 60.00 • Headline earnings decreased by 25%
51.31
50.00 • Rand weakening against the pula
200
40.11 resulted in net exchange loss of
Headline earnings (Rm)
40.00 R42.8m
150 33.23 157
30.91
HEPS (cps)
26.26 30.00 • Reduced liquor and tobacco sales as
134
100
18.66
a result of COVID-19 lockdown
105 20.00 regulations
86
50 66
40 73 10.00 • Cost savings and income from new
46 55
12 21 20 32 business managed to partially offset
- -
FY14 FY15 FY16 FY17 FY18 FY19 FY20
the impact of the above
H1 Headline earnings (Rm) H2 Headline earnings (Rm) HEPS (cps)
*YE: Dec
3150%
Business overview

•    Evergreen Lifestyle is an integrated developer, owner and operator of retirement lifestyle villages
•    The primary business goal is to grow its portfolio of retirement units
•    Evergreen Lifestyle aims to further entrench its position as the leading retirement brand in South Africa by
     providing a superior lived experience to its residents, supported by excellent healthcare
•    Occupation of the units is sold on a life right basis (right of tenure) in exchange for an interest-free loan, while
     ownership of the properties remain with Evergreen Lifestyle

33
Business model
Income from investment property
• Fair value gains on new developments (units)
› Normal property development margins realised on completion of new units
• Fair value gains on existing units
› Ownership of the units remain with the developer under the life right model
› Long-term property appreciation is linked to the general residential property sector
Other income and expenses
• General overhead and head office costs
• Net income/loss from village operations (levy income less expenses)
› Villages initially make operational losses until they reach scale
• Net income or loss from healthcare services
› Currently expenses exceed income, but expected to reverse with greater scale
34Basis of valuation: NAV excluding deferred tax Historical financials (YE: Feb) FY18 FY19 FY20 FY21 H1 Comments Unit overview1 Units with life right agreements (#) 486 557 702 722 Units not yet under life right agreements (#) 15 47 245 247 Total units 501 604 947 969 Assets Rm Rm Rm Rm 1. Units with life right agreements 1,249 1,526 1,880 1,857 Valued at market value with reference to active sales of life rights2 2. Units not yet under life right agreements 29 127 657 591 Valued at market value with reference to active sales of life rights 3. Work in progress 483 607 333 424 Valued at cost 4. Vacant land 142 534 860 836 Valued at cost3 5. Deferred tax asset - 36 53 61 Carrying value 6. Net cash / working capital / PPE 19 257 41 38 Carrying value Total assets 1,922 3,088 3,823 3,806 Liabilities 1. Life right loans 755 1,011 1,309 1,353 Carrying value4 2. Development facilities 78 347 460 509 Carrying value 3. Corporate overdraft facility - - 6 50 Carrying value 4. Deferred tax liability 109 145 192 167 Carrying value 5. Other / working capital 264 62 72 53 Carrying value Total liabilities 1,206 1,564 2,039 2,132 NAV 715 1,523 1,784 1,674 Add back: Deferred tax liability5 109 145 192 167 Total 825 1,669 1,977 1,841 PSG Alpha valuation for SOTP purposes (50% interest) 412 834 988 921 Note 1: The unit overview includes 100% of the units at the Evergreen Val de Vie joint venture; the financial statements includes Evergreen's 50% economic interest in the joint venture Note 2: Independent valuer values all operational villages on 3-year rotational basis (i.e. a 3rd of villages each year) Note 3: During the half-year ended 31 Aug 20, certain costs capitalised to land were reclassified to work in progress. The majority of these costs related to capitalised interest of R26m Note 4: Loans are interest free. Loans are only repayable on resale of the unit to a new life right holder Note 5: Deferred tax liability is excluded from the NAV. Deferred tax liabilities arise on fair value gains on investment property. As the business intends to hold the units indefinitely, deferred tax is disregarded from the valuation 35
Overview of current and future retirement villages
                                                                  Retirement units

                                                                                                                                                        Total opportunities
     Province            Village   Feb-19         Feb-20             Aug-20               In construction       Feb-21 (expected)   Land banked units
                                                                                                                                                          on owned land

                Bergvliet                    78            100                 100                          -                100                    -                  100
                Muizenberg                  260            260                 260                          -                260                    -                  260
                Diep River                   57             57                  57                          -                  57                   -                   57
                Lake Michelle                31             31                  31                          -                  31                110                   141
Western Cape
                Noordhoek                    46            150                 150                     120                   270                    -                  270
                Val de Vie                    2            111                 133                          6                139                 469                   608
                Sitari                        -               -                   -                         -                   -                370                   370
                Somerset West                 -               -                   -                         -                   -                340                   340
     Gauteng    Broadacres                  130            238                 238                          -                238                 108                   346
                Umhlanga                      -               -                   -                         -                   -                640                   640
       KZN      Hilton                        -               -                   -                         -                   -                900                   900
                Zimbali                       -               -                   -                         -                   -                750                   750
Eastern Cape    Westbrook                     -               -                   -                         -                   -                800                   800

                Total                       604            947                 969                     126                  1,095               4,487                5,582

                                                           Care units (monthly fees apply)

Western Cape    Muizenberg                   32             32                                              -                  32
     Gauteng    Broadacres                   32             32                                              -                  32
                Total                        64             64                        -                                        64

36
44%
Business overview

Stadio is building a ‘credible private university’ business for 100 000+ students
 •   Vision: “To be a leading higher education provider, offering qualifications aligned with the needs of societies, students, and the world
     of work”

Through several acquisitions in 2017 to 2019, Stadio created a base to build from. Key metrics for the business include:
 •   ~32,000 students
 •   97 accredited qualifications (37 in pipeline)
 •   14 existing sites of delivery (single faculty)
 •   80% off-campus, 20% on-campus students – similar ratio expected in future
 •   Services school leavers, adults and corporates

38
Business model
• Provide quality, relevant higher education to school leavers and adult learners
• Multi-mode (distance education and face to face), multi-faculty (wide range of qualifications), multi-campus (across
South Africa)
• Stadio to invest in:
› One Stadio brand – in process to merge 6 brands into One Stadio
› Greenfield multi-faculty campuses – 3,000 to 5,000 students capacity campuses in progress in Centurion and
Durbanville
› Accredited qualifications (e.g. first online SAICA accredited Post Graduate Diploma in Accounting, Engineering, etc.)
39Basis of valuation: Listed share price
• Stadio has been listed on the Johannesburg Stock Exchange (JSE) since Oct 17
• Its 31 Aug 20 closing share price of R1.49 represents a 13.8x historic PE ratio based on Stadio 2019 core
headline earnings of R88m
Historic core headline earnings*
100 12.00
90
10.80
10.00
80
Core headline earnings (Rm)
8.60
70
Core HEPS (cps)
41.8 8.00
60
50 38.1 6.00
40
4.00
30 56.8
20
46.4
31.9 2.00
10
0 -
FY18 FY19 FY20
H1 Core headline earnings (Rm) H2 Core headline earnings (Rm) Core HEPS (cps)
*YE: Dec
40(previously FutureLearn)
86%Business overview
• The Optimi group provides education products and services across 4 divisions: Home, Workplace, Classroom and
College. Together, these divisions service over 200,000 learners per annum with accessible, simple and affordable
learning and teaching solutions
• Optimi's offerings include the SA market leader in home-schooling Impaq (Optimi Home), leading adult education and
training provider Mediaworks (Optimi Workplace), leading provider of e-learning solutions ITSI (Optimi Classroom) and
vocational distance education CollegeSA (Optimi College)
42Business model
• Optimi provides various education products and services, using their proprietary GuidED™ learning
model as the foundation of its brand promise and offerings
• Optimi’s GuidED™ learning model provides learners and facilitators with individualised guidance
throughout their learning journey to achieve their learning goals:
• integrating five core elements needed for effective learning and facilitation, namely guidance,
content, application, engagement, and formal assessment
• based on the latest research in the science of learning, including neuroscience, cognitive science,
pedagogy, and psychology
• delivered using Optimi’s technology ecosystem that ensures an integrated and visible learning
experience while enabling efficient and effective learning delivery
• supported by Optimi’s centralised services that aim to lower the cost of learning through
centralisation and automation
43Basis of valuation: PE valuation
• The average PE multiple of three listed education companies is used as a reference point. The industry average PE
ratio is multiplied by Optimi's 2019 recurring earnings
• Note that education companies, like Optimi, typically follow a one-year cycle and therefore historic full year
earnings are considered more appropriate for a valuation than using interim reported financials
• The average PE ratio of 13.3x is considered fair considering Optimi's growth prospects and market leading positions
(YE: Dec) FY17 FY18 FY19
Optimi PE valuation Rm Rm Rm
Optimi Group revenue including acquisitions (Rm) 119.0 211.5 357.4
Recurring earnings (Rm) 9.9 13.7 16.2
PE multiple 13.3x
Valuation (Rm) 216.4
4457%
Business overview
• Energy Partners is a fully integrated private utility business that sells solar energy, cooling and heating to commercial and
  industrial clients
• The primary business focus is to grow the investment portfolio of energy assets
• By owning the assets, Energy Partners secures recurring income and a greater share of the lifetime value of the assets

     Divisions retained                       Brief rationale

                                              Large scope for photovoltaic solar plants (both as cash and PPA* projects) given the cost advantages
                    Solar
                                              compared to grid alternatives

                                              Significant potential to design, build, own and operate industrial and commercial refrigeration plants exists in
               Refrigeration                  South Africa where value can be unlocked through the funding model, exceptional design, execution and
                                              operation of assets

                                              The potential exists to design, build, own and operate boilers in South Africa where we have offered clients
                   Steam
                                              savings by superior design, control and operations. Assets are typically large and attractive on a PPA model

                                              The support required to track asset performance and bill utilities is invaluable to our three divisions building
      Energy Intelligence Solutions
                                              assets, as well as to large corporates like Netcare and Pick n Pay

     *Power Purchase Agreement, where Energy Partners owns the asset

46
Business model and basis of valuation
The business model comprises two components:
1. Operations business
• Constructs and sells energy installations to external customers or to the Energy Partners investment business*
*Inter-company transactions occur at market-related rates and eliminate on consolidation
2. Investment business
• Owns energy-related assets with long-term off-take agreements with private sector clients
Basis of valuation – EV/EBITDA multiple:
• The following EBITDA multiples are used to value the respective components of the business:
› Operations business - 6.0x
› Investment business - 10.0x
• The following adjustments are made in the interest of accuracy:
› The EBITDA from assets commissioned in the last 12 months is annualised (otherwise the debt would be overstated)
› Available cash and the value of work-in-progress assets are added to the valuation
› All debt is deducted from the valuation
47Basis of valuation: EV/EBITDA multiple (continued)
3-year
Historical financials (YE: Jan) (Rm) FY17 FY18 FY19 FY20 CAGR FY21 H1
Cumulative commissioned energy assets (owned by EP) 52.0 102.0 160.2 252.6 69% 319.3
Work-in-progress energy assets - 6.9 15.0 47.9 n/a 66.9
Total capital value of energy assets 52.0 108.9 175.3 300.5 79% 386.2
EBITDA from Investments (FY21 H1 has been annualised) 7.2 16.6 28.5 35.3 70% 43.9
EBITDA from Continuing Operations (rolling 12-month actual) 5.2 33.8 7.5 13.0 36% 11.3
Enterprise value 506.5
Net cash/(debt) (126.3)
Add work-in-progress asset value 59.0
Equity value as at 31 Jul 201 439.2
Plus shareholder loans advanced during Aug 202 25.0
Total valuation as at 31 Aug 20 464.2
Plus shareholder loans advanced during Sept 203 20.0
Total valuation as at 9 Oct 20 484.2
Average yield on assets 13.8% 16.3% 17.8% 14.0% 13.7%
Note 1: Energy Partners adopted the valuation methodology in FY21
Note 2: Energy Partners 100% equity value as at 31 Aug 20 includes shareholder loans of R25m that were capitalised at 30 Sept 20
Note 3: Energy Partners 100% equity value as at 9 Oct 20 includes further shareholder loans of R20m that were capitalised at 30 Sept 20
48Other investments
Investment % Focus Comments
• Established a joint venture in USA with Taiki International (Japanese cosmetics manufacturer) to
Nanofiber material
61 produce and sell nanofiber-based cosmetic facial masks and related products
science
• Developed and commercialised face masks using replaceable nanofiber inserts (COVID-19 related)
Improve new car • Systems approach and digital marketing proving successful
76 purchase • Carter owns the #1 and #2 Renault dealership in South Africa; looking for opportunity to add more
experience brands through acquisitions
• 51% Black-owned mining services business
Mining support
42 • Specialises in structural support and outsourced mining services in the platinum mining industry
services
• Looking to diversify geographically and into related commodities
49 LBO specialist • Diversified portfolio of five investments
49PSG Group underlying investee companies - Websites
• Most of PSG Group’s major underlying investees presented their interim results recently
• For more information, please visit the respective companies’ websites:
› PSG Konsult: www.psg.co.za
› Curro: www.curro.co.za
› Capitec: www.capitecbank.co.za
› Zeder: www.zeder.co.za
- Kaap Agri: www.kaapagri.co.za
› PSG Alpha investments:
- CA&S: www.casholdings.co.za
- Evergreen: www.evergreenlifestyle.co.za
- Stadio: www.stadio.co.za
- Optimi: www.optimi.co.za
- Energy Partners: www.energypartners.co.za
50Questions 51
You can also read