Sodexo Group Presentation - April, 2018

Page created by Jeffrey Schmidt
 
CONTINUE READING
Sodexo Group Presentation - April, 2018
Sodexo
Group Presentation
           April, 2018
Sodexo Group Presentation - April, 2018
FORWARD-LOOKING INFORMATION

            This presentation contains statements that may be considered as
            forward-looking statements and as such may not relate strictly to
            historical or current facts.
            These statements represent management’s views as of the date
            they are made and Sodexo assumes no obligation to update them.

            Figures have been prepared in thousands of euro and published
            in millions of euro.

            Alternative Performance Measures:
            please refer to Appendix 6 for definitions

2   Sodexo Group Presentation, April 2018
Sodexo Group Presentation - April, 2018
AGENDA

            1. First Half Fiscal 2018 highlights
            2. Fiscal 2017 Highlights
            3. Sodexo at a glance
            4. Shareholder & Investor relations
            5. Appendices

3   Sodexo Group Presentation, April 2018
Sodexo Group Presentation - April, 2018
FISCAL 2018 FIRST HALF HIGHLIGHTS
Sodexo Group Presentation - April, 2018
FIRST HALF FISCAL 2018: SUMMARY                                                        H1 18

      Organic revenue growth of +1.9%, excluding 53rd week, for the First half of Fiscal 2018,
      and underlying margin of 6.1% were below expectations

      Clear set of action plans in place, both short and medium term

      The Group continues to generate substantial cash flow
      and the balance sheet remains strong

      The Group remains well-positioned in structurally attractive global growth market

5   Sodexo Group Presentation, April 2018
Sodexo Group Presentation - April, 2018
MODEST GROWTH                                                                                                                                      H1 18
    First Half Fiscal 2018 highlights

      ORGANIC GROWTH                                     ON-SITE                       BENEFITS & REWARDS
                                                        SERVICES                            SERVICES

                               +1.7%                      +1.6%                                             +2.9%
                              +1.9%                     -1.5%    +4.4%                         -2.0%                    +7.1%
                        Excl. 53rd week impact   North America   excl. North America    Latin America                    excl. Latin America

    ▪ Good momentum in Business & Administrations                     ▪ Education suffering from prior year net losses in
        • Ramp-ups in Energy & Resources                                Universities
        • modest pick-up in France
        • Strong dynamic in developing economies
                                                                      ▪ Benefits & Rewards Services strong growth
    ▪ Health Care & Seniors soft in North America and                   in Europe. Brazil impacted by interest rate decline
      Europe but very strong in developing economies

6   Sodexo Group Presentation, April 2018                                                * Please refer to Appendix 6 for Alternative Performance Measures definitions
Sodexo Group Presentation - April, 2018
DECREASE OF UNDERLYING OPERATING PROFIT                                                                                                                    H1 18
    First Half Fiscal 2018 highlights

                         Underlying Operating profit                                    Underlying Operating profit margin
                                -15.0%        -7.4%                                            -80 bps                      -70 bps
                                      TOTAL   EXCLUDING                                          TOTAL                        EXCLUDING
                                     GROWTH   CURRENCY*                                         GROWTH                        CURRENCY*

     ▪ Expected in H1
          • Lower interest rates in Brazil
          • Deconsolidation of certain activities
          • Additional savings generated by the Adaptation and Simplification Program, reinvested to enhance growth

      ▪ Unplanned incremental factors in H1
           • Delays in implementation of performance enhancement leading to margin deterioration in North America
             mainly in Education and Health Care
           • Significant contracts ramp up not yet at expected level of profitability

7   Sodexo Group Presentation, April 2018                                                        * Please refer to Appendix 6 for Alternative Performance Measures definitions
STRONG NET PROFIT, BALANCE SHEET AND CASH FLOW                                                                                            H1 18
    First Half Fiscal 2018 highlights

                           Tax rate down                   Solid Balance sheet                       Increased
                                                                                                   Net Acquisitions

                 32.6%                         25.9%         1.1x      49%                            €674m spent
                    H1 FY17                      H1 FY18    NET DEBT
                                                             RATIO
                                                                       GEARING                           1.3%
                                                                                          net contribution to revenues

                Group Net profit growth                          Strong                   Share buyback program
                                                             free cash flow

                    +6.9%                   +13.9%                                                          €300m
                                                                  €125m
                        TOTAL                EXCLUDING
                       GROWTH                CURRENCY*

8   Sodexo Group Presentation, April 2018                                        * Please refer to Appendix 6 for Alternative Performance Measures definitions
PERFORMANCE IN THE P&L                                                                      H1 18
    First Half Fiscal 2018 Financial Performance
                                                                                  CHANGE
                                                                        At current       Excluding
    € millions                              H1 FY 2018   H1 FY 2017   exchange rates   currency effect

     Revenues                                10,293       10,634          -3.2%            +3.0%

     Underlying Operating profit                627          738        -15.0%             -7.4%

     Underlying Operating margin               6.1%         6.9%        -80 bps         -70 bps

     Other Operating income and expenses        (73)        (153)
     Operating profit                           554          586          -5.4%            +4.1%
     Net financial expense                      (44)         (56)
     Effective tax rate                       25.9%        32.6%

     Underlying Group net profit                397          458        -13.4%             -7.6%

     Group net profit                           372          348         +6.9%          +13.9%

9   Sodexo Group Presentation, April 2018
ROBUST CASH FLOW                                                                                                                                                    H1 18
     First Half Fiscal 2018 Financial Performance
     € millions

                                                                                                                                                 H1 FY2018         H1 FY2017
         Operating cash flow                                                                                                                          650                523
         Change in working capital1                                                                                                                 (402)              (388)
         Net capital expenditure                                                                                                                    (123)              (105)

         Free cash flow                                                                                                                               125                     30
         Net acquisitions                                                                                                                           (674)              (165)
         Share buy-backs/ Treasury stock                                                                                                              (49)            (302) 2
         Dividends paid to parent company shareholders                                                                                              (411)              (359)
         Other changes (including change in Financial Assets, scope and exchange rates)                                                               (43)               (31)
         (Increase)/decrease in net debt                                                                                                          (1,052)              (827)

     1   Excluding change in financial assets in Benefits & Rewards of €(73)m in H1 FY’18 and €(38)m in H1 FY’17.
         Total Change in working capital as reported in Consolidated Cash Flow statement: H1 FY’18 of €(475)m = €(402)m + €(73)m and H1 FY’17 of €(426)m = €(388)m + €(38)m
     2   including 300m€ of the 2017 share buy-back program

10   Sodexo Group Presentation, April 2018
ROBUST BALANCE SHEET AND RATIOS                                                                                                                                              H1 18
     First Half Fiscal 2018 Financial Performance
         € millions
                                               February 28, 2018       February 28, 2017                                            February 28, 2018               February 28, 2017
         Non-current assets                            7,981                  7,916        Shareholders’ equity                               3,343                          3,574
         Current assets
                                                       5,207                  5,532        Non-controlling interests                                34                             39
         excluding cash
         Restricted cash
                                                          495                    486       Non-current liabilities                            3,956                          4,227
         Benefits & Rewards
         Financial assets
                                                          465                    376       Current liabilities                                8,335                          8,168
         Benefits & Rewards
         Cash                                          1,519                  1,698
         Total assets                                15,668                  16,008        Total liabilities & equity                       15,668                         16,008
                                                                                           Gross borrowings                                   4,062                          3,758
                                                                                           Net debt                                           1,663                          1,234
         Operating cash totaled €2,399                 million1,                           Gearing ratio                                        49%                             34%
         of which €2,002 million related to
         Benefits and Rewards Services                                                     Net debt ratio                                          1.1                            0.9
                                                                                           (net debt/EBITDA)

     1   Cash – Bank overdrafts of €81m + Financial assets related to BRS activity

11   Sodexo Group Presentation, April 2018                                                                           * Please refer to Appendix 6 for Alternative Performance Measures definitions
ORGANIC GROWTH                                                                              H1 18
     First Half Fiscal 2018 Financial Performance

                                                         REVENUE GROWTH
                                                              -3.2%
                                       Currency effect                         Scope changes
                                           -6.2%                                   +1.3%

                                                         ORGANIC GROWTH
                                                 +1.7% / +1.9% excl. 53rd week impact
                                                              of which:
                                   On-site Services                   Benefits and Rewards Services
                                       +1.6%                                      +2.9%

12   Sodexo Group Presentation, April 2018
53rd WEEK WORKING DAYS                                                                    H1 18

       FY16                   >              52 weeks x 7            364
       FY17                   >              52 weeks x 7 + 6 days   370
       FY18                   >              A calendar year         365        Impacts
                                                                           Q1     >       0
                                                                           H1     >       -1
                                                                           9M     >       0
                                                                           FY     >       -5

13   Sodexo Group Presentation, April 2018
H1 18
     BUSINESS & ADMINISTRATIONS – REVENUES                                                                                                                                            54%
                                                                                                                                                                                    On-site
                                                                                                                                                                                    Services
                                                                                                                                                                                     FY 17
                                                                                  ORGANIC GROWTH

     € millions                                                                       +2.7%   North America                                                                            24%
                                                                                              ▪ Strong growth in Airline lounge activity
                                            Net                                               ▪ Significant project work in Q1                                                        of FY17
                                                                                                                                                                                        B&A
                          Organic        acquisition
                          growth                                                              ▪ Increase in comparable unit sales

                                                       Unfavorable
                                                                                      +1.2%   Europe
                                                                                                                                                                                      50%
                                                        currency      5,295                   ▪ Contract openings and continued recovery
                                                          effect
       5,196            +4.5%                                                                   in tourism in France                                                                  of FY17
                                                                                                                                                                                        B&A
                                                                                              ▪ Energy & Resources -17%
                                                                                              ▪ Solid growth in Government & Agencies

                                                                                     +12.4% Africa, Asia, Australia, Latin America
                                                                                              & Middle East                                                                           26%
                                                                                              ▪ Strong growth in Corporate driven
                                                                                                by strong new business and comparable unit sales                                      of FY17
                                                                                                                                                                                        B&A
                                                                                              ▪ Energy & Resources favorable momentum
     H1 FY 2017                                                      H1 FY 2018

14   Sodexo Group Presentation, April 2018                                                                          * Please refer to Appendix 6 for Alternative Performance Measures definitions
H1 18
     HEALTH CARE & SENIORS – REVENUES                                                                                                                                                 25%
                                                                                                                                                                                    On-site
                                                                                                                                                                                    Services
                                                                                                                                                                                     FY 17

                                                                                 ORGANIC GROWTH
     € millions

                                                                                       -1.6%    North America
                                                                                                                                                                                       66%
                                                                                                ▪ Lower than expected new contract wins
                                                                                                ▪ Weak comparable unit growth                                                         of FY17
                                                                                                                                                                                   Health Care
                           Organic              Net                                                                                                                                 & Seniors
                           Growth            acquisition

                                                                                       -0.2%    Europe
       2,500 -0.1%
                                                           Unfavorable                          ▪ Selective bidding in France and UK still ongoing;                                   29%
                                                            currency                              some recent wins in UK
                                                              effect      2,359                                                                                                       of FY17
                                                                                                                                                                                   Health Care
                                                                                                                                                                                    & Seniors

                                                                                      +16.6%1 Africa, Asia, Australia, Latin America
                                                                                              & Middle East
                                                                                                ▪ Strong double digit growth in Brazil due to
                                                                                                  contract wins and increased same site sales                                          5%

                                                                                                ▪ Solid comparable growth in Asia                                                     of FY17
                                                                                                                                                                                   Health Care
                                                                                                                                                                                    & Seniors
     H1 FY 2017                                                          H1 FY 2018

15   Sodexo Group Presentation, April 2018                                                                                                    1 Restated for internal transfers between segments.

                                                                                                                     *Please refer to Appendix 2 for Alternative Performance Measures definitions
H1 18
     EDUCATION – REVENUES                                                                                                                                                             21%
                                                                                                                                                                                    On-site
                                                                                                                                                                                    Services
                                                                                                                                                                                     FY 17

                                                                                       ORGANIC GROWTH
     € millions

                                                                                           -4.1%        North America
                                                                                                        ▪ Poor momentum from last year                                                 77%
                                                                                                        ▪ Steady comparable unit growth
                           Organic
                           Growth                                                                       ▪ Improving retention to date                                                 of FY17
                                                                                                                                                                                    Education
                                             Net disposal
       2,483
                          -2.7%                                                            +2.7%        Europe                                                                         21%
                                                            Unfavorable
                                                             currency                                   ▪ High single digit growth in Schools in UK
                                                               effect      2,228                          particularly in the private sector                                          of FY17
                                                                                                                                                                                    Education
                                                                                                        ▪ Positive calendar effect (+2 days)
                                                                                                          in France and Italy

                                                                                                                                                                                        2%
                                                                                          +15.8%1       Africa, Asia, Australia, Latin America
                                                                                                        & Middle East
                                                                                                                                                                                      of FY17
                                                                                                        ▪ Very strong growth in Schools in Asia                                     Education

     H1 FY 2017                                                           H1 FY 2018
                                                                                                          particularly in India and China

                                                                                                                                              1 Restated for internal transfers between segments.
16   Sodexo Group Presentation, April 2018
                                                                                                                     *Please refer to Appendix 2 for Alternative Performance Measures definitions
ISSUE VOLUME AND REVENUES                                                                                                                                                      H1 18
     Benefits & Rewards Services

                                             ISSUE VOLUME                                                                   REVENUES
                                                 € billions                                                                     € millions

                           Organic growth        Acquisitions                                              Organic growth

                                                                 Unfavorable
                                                                                    9.1         457                         Net disposal
           9.1                                                  currency effect
                                                                                                                                                  Unfavorable
                                                                                                                                                 currency effect              413
                                              ORGANIC GROWTH                                                            ORGANIC GROWTH

                                                 +5.6%                                                                           +2.9%

      H1 FY 2017                                                                  H1 FY 2018   H1 FY2017                                                                 H1 FY 2018

17   Sodexo Group Presentation, April 2018                                                                            * Please refer to Appendix 6 for Alternative Performance Measures definitions
H1 18
     EUROPE, ASIA, USA                                                                                                                                                           53%
                                                                                                                                                                              FY 17 BRS
                                                                                                                                                                               revenues
     Benefits & Rewards Services

                                             ISSUE VOLUME                         10.0                                REVENUES
                                                € billions                                                                  € millions

                            Organic growth Acquisitions                                                 Organic growth Net disposal
                                                              Unfavorable

           5.1                                               currency effect      5.4                                                            Unfavorable
                                                                                             241                                                currency effect
                                                                                                                                                                             229
                                             ORGANIC GROWTH                                                        ORGANIC GROWTH

                                                +5.9%                                                                        +7.1%

         H1 FY 2017                                                            H1 FY 2018   H1 FY2017                                                                     H1 FY 2018

     ▪ Robust growth in Central Europe
     ▪ Continued growth in Incentive & Recognition
     ▪ Weakness in India impacted by mandatory transfer from paper to card on January 1st and a loss of a large contract
     ▪ Disposal of Vivabox US, last year in Q4, impacting H1 strongly due to seasonality

18   Sodexo Group Presentation, April 2018                                                                        * Please refer to Appendix 6 for Alternative Performance Measures definitions
H1 18
     LATIN AMERICA                                                                                                                                                                                                       47%
                                                                                                                                                                                                                      FY 17 BRS
                                                                                                                                                                                                                       revenues
     Benefits & Rewards Services

                                             ISSUE VOLUME                                                                                                   REVENUES
                                                 € billions                                                                                                       € millions
                                    Organic growth

                                                                                                                                                                 Acquisitions
              4.0                                                                                                                      Organic growth
                                                         Unfavorable
                                                        currency effect
                                                                                                                    215                                                                 Unfavorable
                                                                                                                                                                                       currency effect
                                                                                       3.7                                                                                                                           184
                                             ORGANIC GROWTH                                                                                               ORGANIC GROWTH

                                                +5.3%                                                                                                               -2.0%

         H1 FY 2017                                                              H1 FY 2018                      H1 FY 2017                                                                                     H1 FY 2018

     ▪ Weakness in Brazil impacted by lower interest rates and number of beneficiaries slightly offset by increase in average face value
     ▪ Continued growth in Chile and Mexico
                                                                                                                                                         * Please refer to Appendix 6 for Alternative Performance Measures definitions
19   Sodexo Group Presentation, April 2018                                Note: As per hyperinflation accounting, Fiscal 2018 and Fiscal 2017 Venezuelan bolivars have been converted at the exchange rate as at February 28, 2018
                                                                                                                                            of 1 U.S. dollar = 35,280 VEF relative to the Fiscal 2017 rate of 1 U.S. dollar = 3,250 VEF.
DETERIORATION IN UNDERLYING OPERATING PROFIT                                                                                                 H1 18
     First Half Fiscal 2018 Financial Performance

                                                          -80 bps        -70 bps
                                                          TOTAL GROWTH   EXCLUDING
     Underlying Operating margin                                         CURRENCY
                                                                          EFFECT

                                               6.9%
                                                                                                      6.1% At current exchange rates
                                               738         -15.0%        -7.4%
     € millions                                              TOTAL
                                                            GROWTH
                                                                         EXCLUDING
                                                                         CURRENCY
                                                                                                      627
     Underlying                                                           EFFECT *

     Operating profit

                                             H1 FY 2017                                       H1 FY 2018

20   Sodexo Group Presentation, April 2018                                           * Please refer to Appendix 6 for Alternative Performance Measures definitions
UNDERLYING OPERATING PROFIT AND MARGIN                                                                                       H1 18
                                                          At constant rate
                                  H1 FY 2017 H1 FY 2018

                                      224M€   207M€                          ▪ Loss of several high margin accounts
      Business &
      Administration                                                         ▪ Slower than expected ramp-up
                                     +4.3%*   +3.9%*         -40 bps           in profitability of some recent large contracts

                                                                             ▪ Delay in SKU rationalization plan
      Health Care
                                      159M€   145M€
      & Seniors
                                                                             ▪ Higher labor inflation in North America
                                     +6.4%*   +6.1%*         -20 bps
                                                                             ▪ Lower performance on some large contracts

                                                                             ▪ Delay in delivery of performance improvement plans
                                      252M€    211M€
      Education                                                              ▪ Higher labor inflation in North America
                                    +10.1%*   +9.5%*         -60 bps
                                                                             ▪ Impact of negative net development from last year

                                                                             ▪ Decline in interest rates in Brazil
     Benefits
                                      156M€   124M€
     & Rewards
                                                                             ▪ Investment in diversification, in particular Mobility
                                    +34.1%*   +30.0%*        -320 bps
                                                                             ▪ Accelerated card migration
21   Sodexo Group Presentation, April 2018                                                                                         * % of revenue
REVISED FISCAL 2018 OBJECTIVES                                                                                                                       H1 18
     Outlook

                                             ▪ Low level of signatures since the beginning
                                               of the Fiscal Year
                                             ▪ Continued weakness in North America                  Organic revenue growth
                                               especially Health Care & Seniors
                                                                                                     of between 1 and 1.5%
                                             ▪ Negative calendar effect in Education in Q3
      In H1 Fiscal 2018                      ▪ Government & Agencies impacted by                              excluding 53rd week impact
      ▪ Soft growth in revenues                UK Army losses
      ▪ Decrease                             ▪ Slow-down in Energy & Resources
           in margins
      ▪ Strong cash flow

                                             ▪ Compounded effects of delayed efficiency                 Underlying operating
                                               ramp-ups
                                                                                                        profit margin around
                                             ▪ A further deterioration expected
                                               in North America Health Care
                                                                                                               at 5.7%
                                               before the delivery of action plans                          (excluding currency effects)

22   Sodexo Group Presentation, April 2018                                                   * Please refer to Appendix 6 for Alternative Performance Measures definitions
IMMEDIATE ACTION PLAN                                                                                                H1 18
     DESIGNED FOR NORTH AMERICA BUT IMPLEMENTED ACROSS REGIONS

       IMPROVING FOOD COST MANAGEMENT                                     ENHANCING LABOR PRODUCTIVITY
       › Rationalize SKUs                                                 › Enhance demand-based scheduling to adapt on site
       › Control drop frequency more strictly                              productive hours to better meet needs

       › Further increase supplier                                        › Improve overtime management
         and product compliance
                                                          STRENGTHENED
                                                                          › Rationalize temporary labor
       › Accelerate synergies from acquisitions            MANAGEMENT     › Re-engineer Full time/ Part time mix
                                                              TEAM:
      OPTIMIZING SG&A/OUT OF UNITS                        RIGHT PEOPLE,   ADRESSING LOW PERFORMING CONTRACTS
                                                           RIGHT ROLES
      › Introduce Zero base redesign                                      › Implement detailed action plan for each of the top
                                                                           low performing contracts
      › Consolidate back-office including acquisitions
      › Simplify the organization                                         › Enhance claim management
                                                                           and client renegotiations
      › Reduce discretionary spend                                        › Ensure close monitoring by Executive committee
                                                                           member for each contract

                                             EMBEDDED IN A LONG TERM STRATEGIC AGENDA
23   Sodexo Group Presentation, April 2018
THE STRATEGIC AGENDA                                                                                   H1 18
                                             FOCUS ON GROWTH

                                             GROWTH          OPERATIONAL
     FOCUS ON                                                 EFFICIENCY      With a unified and rigorous
     EXECUTION                                                                performance management
                                                                              Program (STEP)

                                             TALENT           CORPORATE
     FOCUS ON                                                RESPONSIBILITY
     WHAT MAKES                              STRENGTHENED
                                              MANAGEMENT
     A REAL                                      TEAM:
                                             RIGHT PEOPLE,

     DIFFERENCE                               RIGHT ROLES

24   Sodexo Group Presentation, April 2018
STEP: A UNIFIED AND RIGOROUS PERFORMANCE MANAGEMENT
     PROGRAM                                          H1 18

                                                               Client Sales & Marketing

                                                             Consumer Sales & Marketing
                           New approach
                                                                  Labor Efficiency
                           ▪ Redefine and track common
                             key operational drivers
                                                                   Material Costs
                           ▪ Align for consistency
                           ▪ Use STEP for:                        Overhead Costs
                                › Business Reviews
                                › Definition of objectives             People
                                › Performance appreciation
                                                                    Social Impact

25   Sodexo Group Presentation, April 2018
THE WAY FORWARD                                                                                 H1 18

                                                Sodexo is well placed in attractive,
           Discipline and                         structural growth markets and,
         Accountability for                  with a reinvigorated performance culture
         a better execution                     and improved execution, will return      program
                                               to delivering strong growth over time

       Refocus our people                        Clear set
                                                                      Refreshed         Specific focus on
         on operational                        of immediate
                                                                   management team       North America
           excellence                          action plans

26   Sodexo Group Presentation, April 2018
FISCAL 2017 HIGHLIGHTS
GROWTH INDICATORS ONSITE SERVICES                                                                      FY 17

     Fiscal 2017 highlights

                   Client retention                           Comparable                 Business
                                                              unit growth               development
                  93.1%                       93.5%

                                                                                        7.2%          6.5%
                                                                          Excluding
                                                                          53rd week
                                                            2.1%          1.5%

                Fiscal 2016                  Fiscal 2017   Fiscal 2016   Fiscal 2017   Fiscal 2016   Fiscal 2017

28   Sodexo Group Presentation, April 2018
CENTERPLATE                                                                                                        FY 17

     A leading event hospitality provider for North America and the UK
                              COMPANY OVERVIEW                         A WELL DIVERSIFIED PORTFOLIO¹

     ▪ Food and beverage service provider
                                                                                                        Convention Centers
                                                                                8%
     ▪ 40,000 events and 100m guests annually
                                                                                         32%            Sports
     ▪ c.250 venues, in North America,                                    22%
       the UK and Spain                                North America
                                                       92%                                              Entertainment
     ▪   4th largest operator by revenues
         in the US Sports & Leisure market                                       38%                    UK

     ▪ 3 business lines:                                                                                     ¹ 2016 revenue breakdown

         • Convention Centers
                                                              RECOGNISED EXPERTISE – SELECTED AWARDS
         • Sports
         • Entertainment
                                                          “Best Food and Beverage”                      #1 NFL Experience
                                                        5 Years Running, Convene Magazine                 Stadium Journey
     ▪ c.30,000 employees
                                                                        “America’s Best Stadium Food”
     ▪ 12-months revenues to June 2017: $998 million                        Travel + Leisure Magazine

29   Sodexo Group Presentation, April 2018
CENTERPLATE + SODEXO                                                                                            FY 17

                        SPORTS & LEISURE TRANSFORMED                                NORTH AMERICA STRENGTHENED

                                                                                  S&L

                        Doubling
                        revenues
                                                                                                         S&L
                                                          From 472 to
       Sodexo S&L                  Sodexo S&L revenues
                                                                           B&A
     Current revenues                plus Centerplate
                                                           700+                         Healthcare
                                                                                                      B&A         Healthcare
                                                          sites operated

                 Business mix                                               Education                       Education
                        Airline
             Conference lounges
           & Convention 12%
                                                         From 12,500 to     122,500
                Centres
                   21%
                                                                                                        150,000+
                                  Sports                 40,000+                 employees                   employees

                                  28%                      employees
                Cultural
            destinations
                   39%

30   Sodexo Group Presentation, April 2018
CENTERPLATE CONTRIBUTION TO SODEXO FINANCIALS
      A leading event hospitality provider for North America and the UK                                         FY 17
                                                P&L                                BALANCE SHEET

     ▪ 8 months contribution to revenues (~€500 million)        ▪ Consideration = $675m
     ▪ Brings contribution of external growth to date for       ▪ Brings total Sodexo commitments since YE=~€650m
       Fiscal 2018 = 2.5%
                                                                ▪ Doubles Sodexo net debt => net debt ratio including
     ▪ Before synergies, slight dilution to margins in Fiscal     commitments at Fiscal 2017 year end = 0.8
       2018
     ▪ With synergies, margins will be in line
       with Group North American margins
     ▪ Mild Net profit accretion from Fiscal 2018

                                              CASHFLOW                           VALUATION RATIOS

     ▪ Strong cash generating business,                         ▪ EV/revenues = 0.7x
       with significant retail operations                       ▪ EV/pro forma EBIT post synergies = 9-10x
     ▪ Expected capex / sales ~3%

31    Sodexo Group Presentation, April 2018
SODEXO AT A GLANCE
SODEXO KEY FIGURES                                                                                                  H1 18
     Sodexo at a glance

                                                               ▪ Founded in 1966 by Pierre Bellon
                        €20.7bn revenues
                                                               ▪ Main Shareholders as 31/08/2017:
                                                                > Bellon S.A 40.4% of capital (55.8% of voting rights)
                         427,000 employees                      > International Institutional investors 37.7%

                        19th largest employer
                             worldwide

                                       million consumers
                        100            served daily

                        80 countries
                        €11.8bn               market
                                              capitalization
                                                                                                                Strong Investment
                                                                                                                Grade S&P “A-/A-1”
                                              April 11, 2018

33   Sodexo Group Presentation, April 2018
AN ENGAGED WORKFORCE                                                                                           FY 17
         Sodexo at a glance

                                                                                                         34%
                                                                                                         reduction of
                                                                                                           carbon (2)

1 2016 employee engagement survey
2   Absolute reduction in Scope 1, Scope 2 and Scope 3 carbon emissions, compared to a 2011 base line.

    34   Sodexo Group Presentation, April 2018
OUR MAJOR STRENGTHS
     Sodexo at a glance

                                                     A unique range of
                                                                                         Significant
                                                 Quality of Life Services
            Independence                                                                   market
                                                  particularly well aligned
                                                                                          potential
                                                with evolving client demand

                                                                    A robust
                                              Undisputed
         A global network                                      financial model        A strong culture
                                             leadership in
             covering                                          that allows Sodexo       and engaged
                                              developing
          80 countries                                          to self-finance its        teams
                                              economies
                                                                  development

35   Sodexo Group Presentation, April 2018
WORLD LEADER IN QUALITY OF LIFE SERVICES
     Sodexo at a glance
                                             An unrivaled array of services :
     ON-SITE                                      BENEFITS AND               PERSONAL AND
     SERVICES                                     REWARDS SERVICES HOME SERVICES
      8 client segments:                          5 service categories:     3 service categories:
      Corporate Services                          Employee Benefits        Childcare
      Energy and                                  Incentive and            In-Home Senior
       Ressources (Remote                                                     Care
       Sites)                                       Recognition solutions
                                                                             Concierge services
      Defense                                     Mobility and Expense
      Justice                                      management
      Sports & Leisure                            Public Benefits
      Health Care & Seniors
      Education

36   Sodexo Group Presentation, April 2018                  page 36
FISCAL 2017 REVENUE SPLIT: €20.7 BN
      Sodexo at a glance
                                                                                    Distribution
       Revenue by segment
                                                                                by geographic region

     21% Health Care                          4% Benefits and Rewards
                                                      Services
     & Seniors

                                                          51% Business &
                                                          Administrations

         24%
         Education                                       96% On-Site Services
                                                                    4%

37    Sodexo Group Presentation, April 2018
SODEXO’S VALUE PROPOSITION
     Sodexo at a glance
                                    ➢        Maximizing value added with a unique and differentiating offer…

                            DESIGN                                   MANAGE                         DELIVER

                                                        … adapted to client priorities :

                 Increase people                                Enhance processes             Improve infrastructure
              satisfaction, motivation                           quality, efficiency         and equipment utilization,
                and effectiveness                                 and productivity              reliability and safety

             To deliver
             ▪ Enhanced Quality of life to client employees
             ▪ Support for client development and achievement of objectives

38   Sodexo Group Presentation, April 2018
INTEGRATED QUALITY OF LIFE SERVICES OFFER
    Sodexo at a glance

39 Sodexo Group Presentation, April 2018
BENEFITS AND REWARDS: THE PASS CYCLE
     Sodexo at a glance
                                                               Payment of
                                                               the value
          SODEXO PASS                                                             CLIENTS

                                                                    Delivery
                                                                of the Pass
                                              Presentation                      Distribution
     Reimbursement
                                             of the Pass for                    of the Pass
       of the value
                                             reimbursement

                   AFFILIATED
                   MERCHANTS                                    Use
                                                                               BENEFICIARIES
                                                                of the Pass

40   Sodexo Group Presentation, April 2018
SODEXO’S DEVELOPMENT - 50 YEARS OF HISTORY
             Sodexo at a glance
         1966                                     1983                           2005                                     2016
     Sodexo                       1971 - 1978                                    Michel Landel                             Sophie Bellon
                                                  IPO of Sodexo on Paris
     founded by                  International                                   becomes CEO, Pierre                           becomes
                                                  stock exchange
     Pierre                      expansion                                       Bellon remains                           Chairwoman  of
                                 starts                  1985 - 1993             Chairman of the Board                      the Board of
     Bellon
                                 Service                 International           of Directors          2009                    Directors
                                 Vouchers                development:                                 Sodexo reviews its
                                 launched                Americas, Russia,                            strategic positioning
                                                         South Africa & Asia

                                                  1998-2001
                                                                                2007-2010                   2011-2013        2014-2017
                                                  Sodexo Marriot Services
     Acquisitions

                    1995                                                       VR Brazil                                    Motivcom,  UK
                                                  US                                                       Puras do Brasil,
                        Gardner                                                Score Groupe and Crèche                      Inspirus US
                                                                                                           Brazil
                    Merchant, UK                  2001                         Attitude, France            Lenôtre, France PSL, UK
                                                         Sogeres France        Zehnacker, Germany          Roth Bros, US    Centerplate, US
                           Partena
                                                 Wood Dining Services US       Comfort Keepers &           MacLellan, India Morris, Australia
                           Sweden
                                                                               Circles, US
                                                                               RKHS, India

41     Sodexo Group Presentation, April 2018
REGULAR AND SUSTAINED PERFORMANCE
     Sodexo at a glance
                                              Revenues (in € millions)                                       Operating Profit ( in € millions)
                                                                                   1 200
     25 000                                                                                +5.5 % CAGR over 10 years
                   +4.5% CAGR over 10 years                                        1 000
     20 000
                                                                                    800
     15 000                                                                         600
     10 000                                                                         400

       5 000                                                                        200
                                                                                      0
             0
                                                                                           2007 2008 2009 2010 2011 2012 2013 2014 2015 2016 2017
                   2007 2008 2009 2010 2011 2012 2013 2014 2015 2016 2017
                                                                                                             Net Income ( in € millions)
                                             Operating Cash flow (in € millions)     800
       1 200
                   +6.7% CAGR over 10 years                                                +7.6% CAGR over 10 years
       1 000                                                                         600
         800
         600                                                                         400

         400
                                                                                     200
         200
             0                                                                         0
                   2007 2008 2009 2010 2011 2012 2013 2014 2015 2016 2017                  2007 2008 2009 2010 2011 2012 2013 2014 2015 2016 2017

42   Sodexo Group Presentation, April 2018
REGULAR AND SUSTAINED SHAREHOLDER RETURNS
     Sodexo at a glance

                 EPS (in €)                                               Dividend (in €)
      6                                                              5
              +8.1% CAGR over 10 years                                   +9.1% CAGR over 10 years
      5                                                              4
      4
                                                                     3
      3
                                                                     2
      2

      1                                                              1

      0                                                              0
            2007 2008 2009 2010 2011 2012 2013 2014 2015 2016 2017       2007 2008 2009 2010 2011 2012 2013 2014 2015 2016 2017

43   Sodexo Group Presentation, April 2018
SHAREHOLDER & INVESTOR RELATIONS
SODEXO SHARE OWNERSHIP AS OF AUGUST 31, 2017
     Shareholder & Investor Relations

     OWNERSHIP STRUCTURE AS OF AUGUST 31, 2017                         BREAKDOWN OF VOTING RIGHTS AS OF AUGUST 31, 2017

                 57%
               Public
                                                    40.4% Bellon SA
                                                                            43.1%                         55.8%
37.7% Non-                                                                  Public
                                                                                                          Bellon SA
French
Institutional
shareholders
                                                   1.1% Employees
                                                1.5% Treasury shares
                         15%                 4.3% Individual                          1.1%
          French institutional
               shareholders                  shareholders                        Employees

45   Sodexo Group Presentation, April 2018
SODEXO SHARES
     Shareholder & Investor Relations
         ▪ Sodexo shares are listed on NYSE Euronext Paris
           Euroclear code: FR 0000121220; included in the Next 20 index
         ▪ Sodexo American Depositary Receipts (ADRs) are traded on the over the counter
           (OTC) market, ticker SDXAY, with five ADRs representing one Sodexo share.

                                                       Since initial listing in 1983

                                             SHARE PRICE HAS BEEN MULTIPLIED BY 63*
                                                                                       * As of August 31, 2017

                                                         More than 4.6 times
                                                       the growth of the CAC 40
46   Sodexo Group Presentation, April 2018
STOCK MARKET PERFORMANCE
     Shareholder & Investor Relations

                                                                                                       ● SODEXO
                                                                                                       ● CAC 40

          August 2012                August 2013   August 2014   August 2015   August 2016   August 2017

     ▪ Over the last five fiscal years, Sodexo’s share price increased by +55.9%, whereas the CAC 40 index increased by
       +49.0% during the same period
     ▪ During the last fiscal year, Sodexo’s share price decreased by 5.6% whereas the CAC 40 index rose by +14.6%

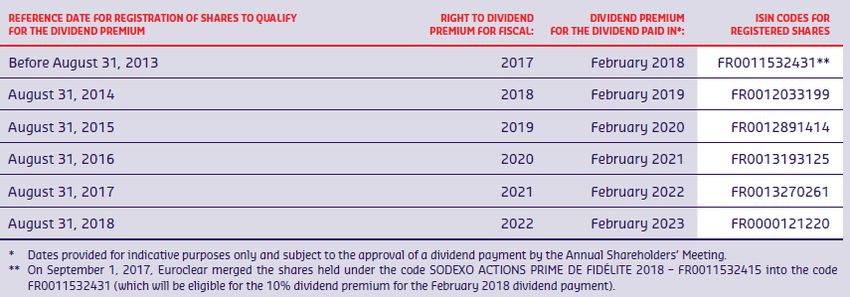
47   Sodexo Group Presentation, April 2018
REGISTERED SHAREHOLDERS
     Shareholder & Investor Relations
     Benefits of being a registered Sodexo shareholder:
     • reduced administration costs (for pure registered shares only);
     • double voting rights for registered shares held for at least four years;
     • and since 2014, a dividend premium of 10% for registered shares held for more than four years (limited to 0.5% of issued capital per
       shareholder)

       Contacts for Registered Shareholders: For further information call :
                                                         Société Générale Nantes (France) : +33(0)2 51 85 67 89
                                                         or visit the Société Générale website: www.sharinbox.societegenerale.com

48   Sodexo Group Presentation, April 2018
SODEXO ADR PROGRAMME
     Shareholder & Investor Relations
      Sodexo offers investors the convenience of investing in American Depositary Receipts (ADRs)

                                                               Benefits of ADRs to US investors
                                                               ▪ They clear and settle according to normal US
                                                                 standards
                                                               ▪ Stock quotes and dividend payments are in US
                                                                 dollars
                                                               ▪ They can be purchased in the same way as
                                                                 other US stocks via a US broker
                                                               ▪ They provide a cost effective means of building
                                                                 an international portfolio.

        For any question about Sodexo ADRs, please contact Citi:
        New York                                London
        Michael O’Leary                          Michael Woods
        citiadr@citi.com                        michael.woods@citi.com
        Tel: +1(212) 723-5435                   Tel: +44 20 7500 2030

49   Sodexo Group Presentation, April 2018
APPENDICES

             1.           Contracts wins
             2.           Corporate responsibility distinction
             3.           Adaptation and simplification program
             4.           H1 Fiscal 2018 exchange rates
             5.           Number of shares
             6.           Alternative Performance Measure definitions
                          and financial ratios
             7.           Reverse factoring
             8.           Gross Financial debt
             9.           Financial calendar

50   Sodexo Group Presentation, April 2018
CONTRACT WINS AND EXTENSIONS                                                                                    Appendix 1
     First Half Fiscal 2018 highlights

                                                      Continued momentum in
      Contract extensions                                                          Pick up in Food contracts
                                                      Energy & Resources

                                 Pierre Fabre                   Ecopetrol                     Renault                 Wellspring
                                                                                                                      Academy Trust
                                                                Onshore contract              Corporate contract
                                 Corporate contract
                                                                in Colombia                   in Brazil               Schools contract in
                                 in France
                                                                                                                      the United Kingdom

                                 Huawei                         Vale                          Methodist Hospital      Nissan
                                                                                              North Lake              Corporate contract
                                 Corporate contract             Onshore contract
                                                                                                                      in Brazil
                                 in 5 countries                 in Brazil                     Health Care contract
                                                                                              in the US

51   Sodexo Group Presentation, April 2018
CORPORATE RESPONSIBILITY DISTINCTIONS                                                Appendix 2
     First Half Fiscal 2018 highlights

        Named the top-rated company in its sector      Earnt the highest marks in RobecoSAM’s
        on the Dow Jones Sustainability Index (DJSI)   “Sustainability Yearbook” for 11th straight year
        for the 13th consecutive year

52   Sodexo Group Presentation, April 2018
ADAPTATION PROGRAM DELIVERING ON TRACK                                                                Appendix 3
     First Half Fiscal 2018 Financial Performance

     € millions

      EXCEPTIONAL                                    TOTAL
      IMPLEMENTATION                         over 18 months            108 in FY 2016     137 in H1 2017         245
      COSTS                                  (Sept. 2015-Feb. 2017)

                                                     Fiscal 2016       32
      SUSTAINABLE                                    Fiscal 2017
      CUMULATED
                                                                                        150
      ANNUAL                                    H1 Fiscal 2018                                      195
      SAVINGS                                     Objective for
                                                   Fiscal 2018
                                                 and each year after
                                                                                                              ~220

53   Sodexo Group Presentation, April 2018
H1 FISCAL 2018 EXCHANGE RATES                                                                                         Appendix 4

                                                                                 Change average rates       Closing rate
      1€ =                                   Average rate H1   Reference rate              H1 Fiscal 18    H1 Fiscal 18    Change 28/02/18
                                                   Fiscal 18        Fiscal 17   vs. Reference Fiscal 17   at 28/02/2018        vs. 31/08/17

      U.S. Dollar                                      1.195            1.099                     -8.1%            1.221              -3.2%

      Pound Sterling                                   0.885            0.867                     -2.0%            0.884              +4.0%

      Brazilian Real                                   3.864            3.526                     -8.7%            3.961              -5.6%

54   Sodexo Group Presentation, April 2018
NUMBER OF SHARES                                                                      Appendix 5

       Company’s share capital                     February 28, 2018   August 31, 2017   February 29, 2017

       Company’s share capital, number of shares     150,830,449        150,830,449        153,741,139

       Treasury shares                                 2,529,632          2,205,010           5,814,876

       Number of shares for EPS calculation
       (Basic weighted average number of shares)     148,535,880        148,998,961        149,936,978

55   Sodexo Group Presentation, April 2018
ALTERNATIVE PERFORMANCE MEASURE DEFINITIONS                                                                                              Appendix 6

     Blended cost of debt                                                          Organic growth
     The blended cost of debt is calculated at period end and is the weighted      Organic growth corresponds to the increase in revenue for a given period
     blended of financing rates on borrowings, (including derivative financial     (the "current period") compared to the revenue reported for the same period
     instruments) and cash pooling balances at period end.                         of the prior fiscal year, calculated using the exchange rate for the prior fiscal
                                                                                   year; and excluding the impact of business acquisitions and divestments, as
     Free cash flow                                                                follows:
     Please refer to Consolidated Financial position.
                                                                                   ▪ for businesses acquired (or gain of control) during the current period,
                                                                                     revenue generated since the acquisition date is excluded from the organic
     Growth excluding currency effect
                                                                                     growth calculation;
     Change excluding currency effect calculated converting H1 2018 figures at
     FY 2017 rates, except for countries with hyperinflationary economies. As a    ▪ for businesses acquired (or gain of control) during the prior fiscal year,
     result, for Venezuelan Bolivar, H1 2018 and H1 2017 figures in VEF have         revenue generated during the current period up until the first anniversary
     been converted at the exchange rate of USD 1 = VEF 35,280 vs. VEF 3,250         date of the acquisition is excluded;
     for FY 2017.
                                                                                   ▪ for businesses divested (or loss of control) during the prior fiscal year,
                                                                                     revenue generated in the comparative period of the prior fiscal year until the
     Issue volume                                                                    divestment date is excluded;
     Issue volume corresponds to the total face value of service vouchers, cards
     and digitally-delivered services issued by the Group (Benefits and Rewards    ▪ for businesses divested (or loss of control) during the current fiscal year,
     Services activity) for beneficiaries on behalf of clients.                      revenue generated in the period commencing 12 months before the
                                                                                     divestment date up to the end of the comparative period of the prior fiscal
     Net debt                                                                        year is excluded.
     Group gross borrowings at the balance sheet less operating cash.              For countries with hyperinflationary economies all figures are converted at
                                                                                   the latest closing rate for both periods.
                                                                                   As a result, for the calculation of organic growth, Benefits & Rewards figures
                                                                                   for H1 2018 and H1 2017 in Venezuelan Bolivar, have been converted at the
                                                                                   exchange rate of USD 1 = VEF 35,280 vs. VEF 3,250 for FY 2017.

56   Sodexo Group Presentation, April 2018
ALTERNATIVE PERFORMANCE MEASURE DEFINITIONS                                                                                           Appendix 6

     Underlying Operating profit                                                    Underlying Net Profit
     Operating profit excluding other operating income and other operating          Underlying Net profit presents a net income excluding significant unusual
     expenses. Other operating income and expenses include gains or losses          and/or infrequent elements. Therefore, it corresponds to the Net Income
     related to perimeter changes and on changes of post-employment benefits,       Group share excluding Other Income and Expense and significant non-
     restructuring and rationalization costs, M&A costs, amortization and           recurring elements in both Net Financial Expense and Income tax Expense.
     impairment of client relationships and trademarks and impairment of non-
     current assets.                                                                In the first half of Fiscal 2018, the Underlying net profit excludes from
                                                                                    the Net Income Group share the following items and the related tax impact
     Underlying Operating margin                                                    where applicable:
     Underlying Operating profit divided by Revenues.
                                                                                    ▪ Other Income and Expense for -73M€
     Underlying Operating margin at constant rate                                   ▪ Interests received in France on tax reimbursements for 7M€
     Margin calculated converting H1 Fiscal 2018 figures at FY 2017 rates, except
     for countries with hyperinflationary economies.                                ▪ Reimbursement of the 3% tax on dividends received for 43M€
                                                                                    ▪ One-off impacts resulting from changes in the US tax regulation for -23M€.

57   Sodexo Group Presentation, April 2018
APM - FINANCIAL RATIOS                                                                                         Appendix 6

                                                                                                H1 2018   H1 2017

                                                   Gross borrowings1 - operating cash2
     Gearing ratio                                                                                49 %       34%
                                                          Shareholders’ equity
                                                       and non-controlling interests
                                                   Gross borrowings1 - operating cash2
     Net debt ratio                           Earnings before Interest, Taxes, Depreciation         1.1       0.9
                                                      and Amortization (EBITDA)3

                                                                                                H1 2018   H1 2017

                                             Non-current borrowings                               2,978     3,079
                                             + current borrowings excluding overdrafts            1,095      685
      1 Gross borrowings
                                             - derivative financial instruments
                                               recognized as assets                                (12)       (6)
                                                                                                  4,062     3,758
                                             Cash and cash equivalents                            1,519     1,698
                                             + financial assets related to the
      2 Operating cash                         Benefits and Rewards Services activity               960      862
                                             - bank overdrafts                                     (81)      (36)
                                                                                                  2,399     2,524

      3 Earnings before Interest, Taxes,     Operating profit (last 12 months)                    1,157     1,060

         Depreciation and Amortization       + depreciation and amortization (last 12 months)       296      272
         (EBITDA)                                                                                 1,453     1,332

58   Sodexo Group Presentation, April 2018
REVERSE FACTORING                                                                                                                        Appendix 7

     Our reverse factoring program has been put in place as part of                 For the reverse factoring programs that have been implemented
     a “supplier support Program” which was implemented in the context              in the context of our supplier support program:
     of the standardization of our P2P process. The objectives of this supplier
                                                                                    ▪ Suppliers have the choice but not the obligation to sell, invoice by invoice,
     support program were to:
                                                                                      their approved receivables before the maturity date.
     ▪ have the opportunity to work with suppliers which in the past
                                                                                    ▪ Sodexo has no power over the supplier’s decision to sell or not sell its
       had not accepted our terms and conditions;
                                                                                      receivables. This is not a tri-partite agreement;
     ▪ allow our suppliers to gain access to a way to be paid in a fast
                                                                                    ▪ In instances where payment terms were modified, terms changed for all
       and secured manner at a low cost of financing;
                                                                                      supplier invoices irrespective of whether supplier financing was or was not
     ▪ improve the perception of Sodexo as a “buyer”;                                 utilized;
     ▪ standardize our payment terms in each significant region of the Group;       ▪ Sodexo does not receive any fees or payment from the factor nor do we
                                                                                      make any payment to the factor other than the payment of the original
     ▪ gain in efficiency in Shared Services Centers with an automatic processing
                                                                                      invoice;
       of supplier invoices validated by the Group;
                                                                                    ▪ Suppliers invoices continue to be paid according to the payment terms
                                                                                      negotiated with the suppliers. Whether the bills are in the program or not,
                                                                                      the payment date remains the same.
                                                                                    ▪ Such programs have not changed our liabilities towards our suppliers,
                                                                                      which is the reason why these liabilities remain as trade payables
                                                                                      and are not reclassified as financial debt under IFRS.

59   Sodexo Group Presentation, April 2018
BREAKDOWN OF GROSS FINANCIAL DEBT:                                                         Appendix 8
     €4,062 million
     € millions

      BY CURRENCY                                    BYBY
                                                        MATURITY
                                                          MATURITY
                     51% €
                                                      < 1 year                1,086*
              3% other                       46% $

                                                     1-2 years   131
      INTEREST RATE

                                                     2-5 years         852
                      23%                    77%
                  Variable                   Fixed                                                      2,481
           Blended cost of debt 2.2% at 28/02/2018   > 5 years                                                1,992

60   Sodexo Group Presentation, April 2018                              * Including commercial paper for an amount of €923m
FINANCIAL CALENDAR                                                             Appendix 9

     Nine month revenues, Fiscal 2018                       July 5, 2018

     Capital Markets Day                             September 6, 2018

     Annual results, Fiscal 2018                     November 8, 2018

     Annual Shareholders’ Meeting 2019                January 22, 2019

     These dates are purely indicative, and are subject to change without notice.
     Regular updates are available in the calendar on our website www.sodexo.com

61   Sodexo Group Presentation, April 2018
INVESTOR RELATION CONTACT

                                                  www.sodexo.com
     Head of Investor Relations
     ▪ Virginia JEANSON
     Tel: + 33 1 57 75 80 56
     virginia.jeanson@sodexo.com

     Investor Relations Manager
     ▪ Sarah JAMALI-KLEIN
     Tel: + 33 1 57 75 83 68
     sarah.jamali@sodexo.com

     Investor Relations Coordinator
     ▪ Cynthia CATTY
     Tel: + 33 1 57 75 80 54
     cynthia.catty@sodexo.com

     Sodexo
     255 Quai de la Bataille de Stalingrad
     92130 Issy-Les-Moulineaux

     Email: communication.financiere@sodexo.com

62   Sodexo Group Presentation, April 2018
Thank you!
You can also read