FIB REPORT 2019 ANALYSIS OF FOREIGN INSURANCE BUSINESS OF AUSTRIAN INSURANCE GROUPS - FMA
←
→
Page content transcription
If your browser does not render page correctly, please read the page content below

FIB REPORT 2019

ANALYSIS OF FOREIGN
INSURANCE BUSINESS OF
AUSTRIAN INSURANCE GROUPS

Division II/4 – Team Supervision of Insurance Groups
CONTENT
Management Summary.......................................................................................................... 4
Structure of the Report........................................................................................................... 7
1     Cross Market Analysis .................................................................................................... 8
    1.1     Scope of business ................................................................................................... 8
    1.2     Macroeconomic Overview CESEE-Region .............................................................. 8
    1.3     Insurance Markets ................................................................................................. 10
      1.3.1        Market Structure and Characteristics .............................................................. 10
      1.3.2        Market Development....................................................................................... 12
      1.3.3        Market Position ............................................................................................... 14
2     Foreign Insurance Business ......................................................................................... 16
    2.1     Premium Development .......................................................................................... 16
      2.1.1        Share of Foreign Business.............................................................................. 16
      2.1.2        Allocation of Premiums ................................................................................... 17
    2.2     Cross-border business via Branches and Free Provision of Services .................... 18
    2.3     Group Solvency ..................................................................................................... 18
3     Analysis of Key Markets................................................................................................ 19
    3.1     Czech Republic ..................................................................................................... 20
      3.1.1        Insurance Market Overview ............................................................................ 20
      3.1.2        Austrian Insurance Groups ............................................................................. 22
    3.2     Poland ................................................................................................................... 23
      3.2.1        Insurance Market Overview ............................................................................ 23
      3.2.2        Austrian Insurance Groups ............................................................................. 25
    3.3     Slovakia ................................................................................................................. 26
      3.3.1        Insurance Market Overview ............................................................................ 26
      3.3.2        Austrian Insurance Groups ............................................................................. 28
    3.4     Romania ................................................................................................................ 29
      3.4.1        Insurance Market Overview ............................................................................ 29
      3.4.2        Austrian Insurance Groups ............................................................................. 31
    3.5     Hungary ................................................................................................................. 32
      3.5.1        Insurance Market Overview ............................................................................ 32
      3.5.2        Austrian Insurance Groups ............................................................................. 34
    3.6     Croatia ................................................................................................................... 35

                                                                                                                                 SEITE 2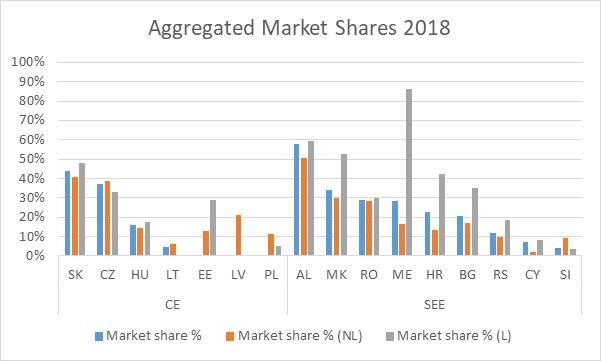
3.6.1      Insurance Market Overview ............................................................................ 35
    3.6.2      Austrian Insurance Groups ............................................................................. 37
ANNEX 1: Risk Map Insurance and Macroeconomic Indicators ........................................... 38

                                                                                                                 SEITE 3
MANAGEMENT SUMMARY
The Foreign Insurance Business Report provides information on the foreign insurance
business of Austrian insurance groups which is either generated by subsidiaries (this is the
main focus of the report) or by branches or free provision of services.
There are 5 Austrian insurance groups having insurance subsidiaries abroad: Vienna
Insurance Group, UNIQA Group, GRAWE Group, Merkur Group and Wüstenrot Group. At the
end of 2018, the scope of business of these groups comprised 87 foreign insurance and 4
foreign reinsurance companies in 27 countries, mainly in Central, Eastern and South Eastern
Europe. For the purpose of the analysis, 4 geographical segments are defined: Western
Europe (WE), Central Europe (CE), South Eastern Europe (SEE) and Eastern Europe (EE).
Cross-Market Analysis (Market Perspective)
Macroeconomic overview of CESEE region
The macroeconomic development of the CESEE region was positive, but economic growth is
slightly slowing down. This economic wellbeing is due to solid increasing wages, stable
investment dynamics (due to the low interest rate environment and high EU-Transfers) and
strong export performances. In the Western Balkans, the growth slow-down is less severe and
mainly concentrated in Serbia, where an exceptionally good harvest could not be repeated.
The midterm outlook is less optimistic which is mainly due to the worsening of the global
economic environment. Nevertheless, the positive trend of rising wages and of attracting
investments is very likely to continue for at least some time, even though the effect might
weaken.
Insurance Markets
Market characteristics of insurance markets relevant for Austrian insurance groups vary
considerably regarding size, concentration and level of maturity. The most mature insurance
markets as measured by insurance density (i.e. premiums per capita) and insurance
penetration (i.e. premiums in % of GDP) are found in Western Europe (Germany, Switzerland,
Liechtenstein). Insurance markets in Central Europe are generally more mature than most of
the markets in Eastern Europe and South Eastern Europe. As in the previous years, Slovenia
and Cyprus are outliers in the SEE segment, showing significantly higher insurance market
indicators than the other countries in this geographical segment.
The size of an insurance market is measured by gross written premiums. In absolute figures,
the insurance markets in Western Europe are by far the biggest ones, followed by Eastern
European markets. However, from Austrian perspective and without consideration of
reinsurance companies, the aggregated premium volume generated by Austrian insurance
groups in these two geographical segments is not significant in relation to total foreign
business. The core of foreign insurance business activity of Austrian insurance groups are the
insurance markets of Central Europe and South Eastern Europe.
Regarding insurance market developments, in Central Europe, life insurance lost
momentum in most markets where the sector holds a large share of the GWP portfolio such
SEITE 4as the Czech Republic, Hungary or Slovakia. The most significant drop in life insurance
premiums was observed in Poland. On the non-life side, a positive premium development is
observable, also with Poland being the market leader in the non-life segment of the CESEE
region. Increasing car sales, mostly in the passenger cars segment, and rising tariffs
(especially for MTPL), were the main growth drivers of the motor lines across the region.
In the insurance markets of South Eastern Europe a different trend in life insurance can be
observed, especially, as the emergent life insurance markets of the Western Balkans recorded
remarkable growth rates. However, it has to be considered that much of this growth is related
to the increasing lending activity in the banking system, thus more or less to an obligation set
by lending terms and not by an increasing awareness and appetite for life insurance. In the
non-life segment, especially Bulgaria, Albania and Croatia show significant growth rates,
mainly driven by increasing passenger car sales in the motor lines.
In some countries in Central Europe and South Eastern Europe, Austrian insurance groups
have a high market share and therefore a dominant position on the local insurance market. In
Central Europe, Slovakia and the Czech Republic are still the countries with the highest market
shares of Austrian groups with the particularity of significant market positions in life and non-
life insurance. However, in the recent years the Baltic countries become more and more
important concerning market positions of Austrian insurance groups.
In South Eastern Europe, Austrian insurance groups generally show higher market shares in
life insurance than in non-life insurance. This results from the fact, that life insurance markets
are still less developed and Austrian insurance groups entered into it rather early.
In Western Europe Austrian insurance groups do not play a significant role on the local
markets. In Eastern Europe, Austrian insurance groups hold significant market shares,
however, neither in Russia nor in Turkey which are by far the biggest markets in this region.
Foreign Insurance Business (Group Perspective)
Premium Development
Austrian insurance groups generated an aggregated written premium volume (domestic and
foreign business) of 14,3 Bn. EUR in 2018, this means a slight increase of 3% compared to
the previous year. Foreign business via subsidiaries accounts for a foreign business share of
40,3% (2017: 39,8%).
Vienna Insurance Group and UNIQA Group generate business in all geographical segments,
but Central Europe is their dominant region regarding written premium volume. GRAWE Group
and Merkur Group are focusing on South Eastern Europe. The foreign business of Wüstenrot
Group mainly relies on its subsidiary in Slovakia.
A break-down of written premiums according to countries shows that about 70% of total foreign
premium volume is generated in 6 countries: Czech Republic, Poland, Slovakia, Romania,
Hungary and Croatia. These countries are classified as so-called key markets for Austrian
insurance groups. However, with some limitation there is a further candidate in the row to
become a key market from Austrian perspective: Solely for the purpose of the analysis,
Estonia, Lithuania and Latvia has been considered as one country – the “Baltics”. Written
SEITE 5premiums generated in the Baltics already reached a significant level, accounting for a
premium share (i.e. the relation of written premiums generated in a country to the total foreign
written premium volume of Austrian groups) over 6,1% which means a higher premium share
than Hungary and Croatia.
Group Solvency
All Austrian insurance groups recorded sufficient group solvency ratios for 2018 ranging
between 195% and 272%.
Cross-border Business via Branches and FPS
Austrian insurance groups not only operate abroad via subsidiaries but also use the system of
free provision of services and/or branches to generate business. This part of the business is
included in the financial statements of the domestic insurance undertaking.
Considering the 5 Austrian insurance groups, premium volume of about 1,01 Bn. EUR results
from operations via branches and/or free provision of services. With a share of nearly 93%,
the major part of premiums accounts for Free Provision of Services. The major part of cross
border business via free provision of services is achieved in three countries: Germany, Italy
and Latvia.
Analysis of Key Markets
In order to define key markets, FMA categorizes all relevant insurance markets according to
its premium share (i.e. the relation of gross written premiums generated in a market to total
foreign gross written premium volume of Austrian insurance groups). Insurance markets with
a premium share above 4% are defined a key market. Based on the figures at the end of 2018,
six key markets for Austrian insurance groups were defined: Czech Republic, Poland,
Slovakia, Romania, Hungary and Croatia. Together, over 70% of total foreign premium volume
of Austrian insurance groups has been generated in these key markets. The list of key markets
has not changed compared to the previous year.
SEITE 6STRUCTURE OF THE REPORT
Austrian insurance groups do foreign business in two different ways: via subsidiaries or -
following the EEA single licensing principle - via free provision of services or branches. Since
this year, both types of business models are addressed in this report.
To clarify the data base and figures used in the analyses, at the beginning of each chapter
references to the source of information and definitions of the key indicators are included.
The first chapter contains an overview of the macroeconomic framework as well as the
development of insurance markets in the CESEE region relevant for Austrian insurance
groups. This chapter also includes information on market characteristics and the market
position of Austrian insurance groups on local insurance markets (market perspective).
The second chapter focuses on the foreign insurance business of Austrian insurance groups
with an analysis of premium volume and group solvency (group perspective). Moreover, one
part of this chapter is dedicated to the business generated by free provision of services and/or
branches.
The third chapter provides a more detailed analysis of so-called “key markets”. Insurance
markets with a premium share (i.e. the relation of gross written premiums generated in a
market to total foreign gross written premium volume of Austrian insurance groups) above 4%
are defined a key market.
SEITE 71 CROSS MARKET ANALYSIS
1.1 Scope of business
Five Austrian insurance groups (i.e. Vienna Insurance Group, UNIQA Group, GRAWE Group,
Merkur Group and Wüstenrot Group) are active via subsidiaries on foreign insurance markets.
At the end of 2018, the scope of business of these groups comprised 87 foreign insurance and
4 foreign reinsurance companies in 27 countries, mainly in Central, Eastern and South Eastern
Europe. Reinsurance companies are excluded in the following analyses.
For the purpose of streamlining the analysis, the relevant countries are clustered into 4
geographical segments:
Western Central Europe South Eastern Eastern Europe
Europe (WE) (CE) Europe (SEE) (EE)
Germany Czechia Albania Belarus
Liechtenstein Estonia Bosnia Herzegovina Georgia
Switzerland Hungary Bulgaria Moldova
Latvia Croatia Russia
Lithuania Cyprus Turkey
Poland Kosovo Ukraine
Slovakia Montenegro
North Macedonia
Romania
Serbia
Slovenia
Table 1: Countries divided into clusters (Western, Central, South Eastern and Eastern Europe)
1.2 Macroeconomic Overview CESEE-Region1
In general, the economic growth in the CESEE Region is slowing down to 3,9% in 2019. In
comparison to the remaining European Union, however, the CESEE Region has a 2,4 Pp
higher growth rate. This economic wellbeing is due to solid increasing wages, stable
investment dynamics (due to the low interest rate environment and high EU-Transfers) and
strong export performances. In the Western Balkans, the growth slow-down is less severe and
mainly concentrated in Serbia, where an exceptionally good harvest could not be repeated. In
addition, the Western Balkans are becoming a more favorable option in comparison to the
CESEE Region due to the still lower price level. In general, the outlook is less pessimistic than
originally forecasted in the beginning of the year. All country data were revised positively,
besides Turkey, Russia and Serbia.
In Romania, Poland, Hungary and Bulgaria signs of overheating economies are seen,
indicated by an increased inflation rate. Nevertheless, the policy focus is continuing to stay on
economic growth rather than on price stability, which is realized by both, a strong expansive
1
See www.wiiw.ac.at (Astrov, Grübler: Osteuropa trotzt dem globalen Gegenwind, Juli 2019)
SEITE 8fiscal and monetary policy. In most countries, however, there is no cause for concern with the
exception of Romania. In Romania, the export growth could not keep up with the rising
domestic demand, which led to an increased trade deficit even though there was a currency
depreciation during the year.
One surprising development in the CESEE region is that export performance stayed robust in
the face of the slowing global economy. Moreover, in most countries the exports were rising
more than the imports so that the trade balance is now contributing a bigger size to the
economic growth. This development is mainly owed to the improved competitive advantage
and the therefore rising market shares in the Euro-Area. This development, however, cannot
be observed in the Western Balkans, where the exports are declining.
The main driver for continuing growth in the region is the rising domestic demand. In the
CESEE this is driven by the high employment rates which results in rising wages due to a
stronger negotiating position for the employees. Due to the increasing demand also the
prospect sales for the companies are increasing, which is leading to more investments and
subsequently to higher growth. On the downside, the competitiveness could be suffering due
to the rising costs regarding the higher wages, but this development cannot be observed until
this point. The wages were also increasing in the Western Baltics, but there it was due to
increasing minimum wages.
Especially in the Visegrad Countries (Czechia, Hungary, Poland and Slovakia), the labor
shortage is particularly intense. One reason is the declining share of population in working age.
There are two indicators for the growing shortage of labor: Firstly, the unemployment rate is
very low and the countries are close to full employment and secondly, the share of open
positions rose drastically from 0,9% in 2013 to 6,5% in the beginning of 2019. The biggest
danger of this development is that the attractiveness of these countries worsens, especially
regarding new big Greenfield investment projects. Until now, this could be counteracted with
rising automation and robotization in particular because the degree of robotization in these
countries is still relatively low in an international comparison.
The midterm outlook is less optimistic which is mainly due to the worsening of the global
economic environment. Even though the slowing of the Euro-Area did not have a large impact
on that region until now, this is very likely to change if the global economic slowdown continues.
Another possible threat is the arising protectionism, especially the potential import tax on cars
in the US. Nevertheless, the positive trend of rising wages and of attracting investments is very
likely to continue for at least some time, even though the effect might weaken.
SEITE 9Table 2: Macroeconomic indicators (Sources: SNL; no data for Kosovo, Liechtenstein and Montenegro availabe;
data: left-axis = unemployment rate, right-axis = growth rates)
1.3 Insurance Markets
1.3.1 Market Structure and Characteristics
Insurance markets relevant for Austrian insurance groups differ significantly regarding size,
concentration and level of maturity. The indicators to be used to assess these market
characteristics are the number of market participants, gross written premium volume,
insurance penetration (i.e. premiums in % of GDP) and insurance density (i.e. premiums per
capita).
The following graph shows insurance density and insurance penetration for life and non-life
business for each country.
Table 3: Insurance Density and Insurance Penetration (life & non-life) per segment (Sources: X Primm; SNL; Swiss
Re sigma) in 2018
SEITE 10The picture hasn’t changed a great deal compared to the previous year. Insurance markets in
Central Europe are still more mature, showing a significantly higher insurance density and
insurance penetration than most of the markets in Eastern Europe and South Eastern Europe.
As in the previous years, Slovenia and Cyprus are outliers in the SEE segment, showing
significantly higher insurance market indicators than the other countries in this geographical
segment.
In order to illustrate the CESEE insurance landscape, the size of the insurance markets
measured by gross written premium volume is linked to the indicators insurance density and
insurance penetration.
Table 4: Insurance Density, Insurance Penetration and GWP per Country in 2018 (Segment CE, EE, SEE)
(Sources: X Primm; SNL; Swiss Re sigma)
As can be seen from the graph, insurance markets in the CESEE region are quite heterogenic.
Regarding the market size (illustrated by the size of the bubbles), Russia, Turkey, Poland and
the Czech Republic are by far the biggest markets. Insurance markets in Central Europe are
already much more developed than insurance markets in Eastern Europe. The insurance
markets of South Eastern Europe are mostly in the middle.
Insurance markets in Austria and Western Europe are much more developed with an insurance
penetration of 4,5% for Austria (EU-average: 8,6%) and an insurance density over 2.000 EUR
in Austria and the EU.
In comparison to the previous year, no significant shifts in the CESEE landscape have been
observed.
SEITE 111.3.2 Market Development
Information on insurance markets used in this chapter are mainly taken out of market reports
published by X-Primm which is a media brand, incorporating several companies specialized in
providing media products to the global re/insurance industry with the main focus on the CESEE
and CIS regions.
The following table provides information on insurance market premiums of the relevant
insurance markets, aggregated according to geographical segments:
Total Insurance Market Gross Written Premiums
(in Mio. EUR) 2018 2017 ∆ in %
AUSTRIA 18.527 18.134 2,17%
FOREIGN MARKETS 277.053 269.473 2,81%
WE 209.337 201.722 3,78%
CE 28.064 27.914 0,54%
SEE 9.696 9.021 7,48%
EE 29.955 30.817 -2,80%
TOTAL 295.580 287.606 2,77%
Table 5: GWP Development 2017-2018 per Segment (Sources: FMA Reporting Local GAAP per 31.12.2018 for
Austrian business; X Primm and Swiss Re sigma for foreign business)
From an Austrian perspective and without consideration of reinsurance companies, the
geographical segment Western Europe only includes the insurance markets of Germany and
Liechtenstein. Even if it’s by far the biggest segment regarding market size, it is not of
significant importance for Austrian insurance groups.
The second largest geographical segment is Eastern Europe which also includes the huge
insurance markets in Russia and Turkey. Even though Austrian insurance groups are
represented in these markets, the business generated there is of less significance for Austrian
insurance groups.
The insurance markets of Central Europe and South Eastern Europe are the most important
ones for Austrian insurance groups. Central European markets show a slight increase in overall
gross written premiums of 0,5% compared to the previous year, a more significant growth rate
of 7,5% can be observed for South Eastern Europe.
In order to analyze trends of the more important insurance markets in more detail, the following
table shows the development of gross written premiums per segment and per line of business
including annual change:
Total Insurance Market 2018 2017
CHANGE GWP 2018/2017
(in Mio. EUR) Gross Written Premiums Gross Written Premiums
Life Non-Life Total Life Non-Life Total Life Non-Life Total
AUSTRIA 5.540 12.987 18.527 7.887 10.247 18.134 -29,75% 26,75% 2,17%
FOREIGN MARKETS 103.497 173.448 277.053 107.896 161.559 269.473 -4,08% 7,36% 2,81%
WE 83.712 125.516 209.337 87.879 113.844 201.722 -4,74% 10,25% 3,78%
CE 10.233 17.832 28.064 11.170 16.744 27.914 -8,39% 6,50% 0,54%
SEE 2.525 7.172 9.696 2.377 6.644 9.021 6,20% 7,94% 7,48%
EE 7.027 22.928 29.955 6.470 24.328 30.817 8,60% -5,75% -2,80%
TOTAL 109.037 186.435 295.580 115.783 171.806 287.606 -5,83% 8,51% 2,77%
Table 6: GWP Development 2017-2018 per Segment and per line of business (Sources: FMA Reporting Local
GAAP per 31.12.2018 for Austrian business; X Primm and Swiss Re sigma for foreign business)
SEITE 12For Central Europe, life insurance lost momentum in most markets where the sector holds a
large share of the GWP portfolio such as the Czech Republic, Hungary or Slovakia. With a
drop of 14% of life insurance premiums, Poland – which is the market leader in the region -
shows the most significant decrease in life insurance business. However, looking at each of
these markets, it is hard to find common trends, as the reasons behind the negative change is
the result of a combination of different factors, such as a tighter regulatory environment in
multiple areas (e.g. consumer protection, distribution, fiscal treatment) and an overall negative
sentiment around insurance investment products created by the low interest rate environment.
Non-life insurance lines fared better, recording a positive evolution in GWP volume. The Polish
market also is the market leader in the non-life segment, a position supported in many respects
by the higher level of market development and the country’s bigger size.
Increasing car sales, mostly in the passenger cars segment, and rising tariffs (especially for
MTPL), were the main growth drivers of the motor lines across the region. Countries like
Lithuania, Romania and Hungary saw increases in passenger car sales of over 10%, while for
other CEE markets car sales increased at lower paces. In addition, some of the national fleets
have also seen second hand car registrations in big numbers, adding several hundred
thousand cars to the insurance portfolio. The individual market dynamics were positive, except
for Poland and Romania, each saw slightly negative growth rates in the MTPL line. The
property insurance segment also saw an increase in gross written premiums.
In the insurance markets of South Eastern Europe a different trend in life insurance can be
observed, especially, as the emergent life insurance markets of the Western Balkans recorded
remarkable growth rates (e.g. Kosovo 20%, North Macedonia 15,5%, Slovenia 9,7%, Croatia
8,0%). However, it has to be considered that much of this growth is related to the increasing
lending activity in the banking system, thus more or less to an obligation set by lending terms
and not by an increasing awareness and appetite for life insurance. In the non-life segment,
especially Bulgaria (+18,9%), Albania (+13%) and Croatia (+11%) show significant growth
rates, mainly driven by increasing passenger car sales in the motor lines.2
2
See X-Primm Insurance Report FY 2018 (Ghetu: The CEE Insurance Market in 2018, page 9-11)
SEITE 131.3.3 Market Position
In some countries in Central Europe and South Eastern Europe, Austrian insurance groups
have a high market share and therefore a dominant position on the local insurance market. In
Western Europe Austrian insurance groups do not play a significant role on the local markets,
therefore these countries are not considered in the following graph:
Table 7: Aggregated market shares of Austrian Insurance Groups for CE and SEE segment 2018 (Sources:
Information Exchange Templates 2018 – reporting within the supervisory college)
In general, market positions differ significantly between the life and non-life insurance segment.
In Central Europe, Slovakia and the Czech Republic are the countries with the highest market
shares of Austrian groups with the particularity of significant market positions in life and non-
life insurance. The Baltic countries where only Vienna Insurance Group is represented by
subsidiaries, show a quite diversified picture: In Estonia, Vienna Insurance Group reaches a
market share of nearly 30% in life insurance, but in Latvia it’s the non-life market share which
accounts for 21%.
In South Eastern Europe (SEE), Austrian insurance groups, in general, have much stronger
positions on the life insurance market. This results from the fact, that life insurance markets
are still less developed and Austrian insurance groups entered into it rather early. Especially,
the aggregated life insurance market share of 86% in Montenegro is noticeable. This results
from strong market positions of 3 Austrian groups: GRAWE Group, VIG and UNIQA Group. In
Albania, Austrian insurance groups dominate the insurance market in both lines of business.
In North Macedonia and Romania market positions also are quite strong showing aggregated
market shares near or beyond 30% in life and non-life insurance.
For the Non-EEA countries in Eastern Europe (EE), data on market shares are taken from the
X-Primm Report3. Relevant markets in this geographical area are Turkey, Ukraine, Russia,
3
See X-Primm Insurance Report FY 2018
SEITE 14Moldova, Georgia and Belarus. For these markets, information is only available for the TOP 5
life insurance and non-life insurance companies of the market.
In Turkey, Russia and Belarus Austrian insurance groups do not play a significant role on the
local markets. There are no subsidiaries of Austrian insurance groups among the TOP 5
players, neither in life nor in non-life insurance.
In the Ukraine, the subsidiaries of UNIQA Group hold a significant market share: With a market
share of 4,49%, the non-life subsidiary of UNIQA is the market leader. However, the Ukrainian
non-life market is strongly fragmented, the TOP 5 non-life insurers unite an aggregated market
share of only 20%. The situation on the life insurance market is different with an aggregated
market share of the TOP 5 companies of nearly 78%. UNIQA Life holds the second position
on the Ukrainian life insurance market with a market share of 4,16%.
In Moldova, the life insurance market consists of only two insurance companies. GRAWE Carat
Asigurari which is a subsidiary of GRAWE Group is the absolute market leader having a market
share of 98,87%. On the non-life market, the subsidiary of Vienna Insurance Group - Donaris
VIG – has a market share of 13,54%, holding the second position on the Moldavian non-life
insurance market.
In Georgia, the subsidiaries of Vienna Insurance Group hold significant market positions: In
life insurance GPI Holding has a market share of 6,26% which means the fourth place on the
market. On the non-life market, GPI Holding is the market leader with a market share of
20,53%.
SEITE 152 FOREIGN INSURANCE BUSINESS
The analyses in this section include figures on premiums of all domestic and foreign insurance
undertakings being part of one of the five Austrian insurance groups.
Premiums reported are written premiums (direct and indirect business) net of reinsurance
ceded. All data refer to local financial statements using local GAAP or IFRS accounting.
2.1 Premium Development
2.1.1 Share of Foreign Business
In 2018, Austrian insurance groups achieved an aggregated written premium volume
(domestic and foreign business) of 14,3 Bn. EUR (2017: 13,9 Bn. EUR). Foreign business via
subsidiaries accounts for a share of 40,3% (2017: 39,8%).
Table 8: Share of Foreign Business (Source: FMA Reporting per 31.12.2018)
SEITE 162.1.2 Allocation of Premiums
As already presented in Chapter 1.1. of this report, Austrian insurance groups are active in
various countries with a strong focus on the CESEE region. This is also reflected by an
allocation of the aggregated premium volume according to geographical segments.
Written premiums Premium Share
In EUR
(net of reinsurance ceded) in % of Total Premiums
Austria 8.528.690.774 59,7%
Foreign Business 5.762.239.028 40,3%
CE 3.824.793.279 26,8%
EE 367.760.228 2,6%
SEE 1.276.427.039 8,9%
WE 293.258.483 2,1%
TOTAL 14.290.929.802 100,00%
Table 9 Written premiums (net of reinsurance ceded) in EUR and foreign business ratio according to geographical
segments (Source: FMA Reporting per 31.12.2018)
Going one step further, written premiums not only are allocated to geographical segments but
to country level. It can be seen that nearly 70% of total foreign premium volume is generated
in 6 countries: Czech Republic, Poland, Slovakia, Romania, Hungary and Croatia. These
countries are classified as key markets for Austrian insurance groups.
Table 10 – Premium Share in % per foreign country (left graph with Austria; right graph: without Austria); (Source:
FMA Reporting per 31.12.2018)
In addition to these six countries, the premium development in the Baltic countries has to be
monitored. For the purpose of the analysis, Estonia, Lithuania and Latvia are considered as
one country – the “Baltics”. Written premiums generated in the Baltics amounted to 351,3 Mio.
EUR in 2018, which means a premium share of 6,1% of total foreign premium volume.
SEITE 172.2 Cross-border business via Branches and Free Provision of
Services
Austrian insurance groups not only operate abroad via subsidiaries but also use the system of
free provision of services and/or branches to generate business.
Business generated via branches or free provision of services is included in the financial
statements of the domestic insurance undertaking.
Considering the five Austrian insurance groups, premium volume of about 1,01 Bn. EUR
results from operations via branches and/or free provision of services. With a share of nearly
93%, the major part of premiums accounts for Free Provision of Services.
Written premiums generated by free provision of services amounted to 939,9 Mio. EUR in total
in 2018. However, it has to be considered that the major part of this premium volume is
attributed to the reinsurance business of one insurance group, therefore only direct business
is considered which in total amounts to about 163 Mio. EUR.
The distribution of written premiums according to countries shows that the most significant part
of cross border business via free provision of services is achieved in three countries.
Table 11: TOP 5 countries - written premiums by free provision of services (Source: QRT Reporting 31.12.2018)
2.3 Group Solvency
All Austrian insurance groups recorded sufficient group solvency ratios for 2018 ranging
between 195% and 272%.
SEITE 183 ANALYSIS OF KEY MARKETS
All insurance markets relevant for Austrian insurance groups are categorized according to their
premium share, i.e. the relation of written premiums generated in a country to the total foreign
written premium volume of Austrian groups. Insurance markets with a premium share above
4% are defined a key market.
Based on the figures at the end of 2018, six key markets for Austrian insurance groups were
defined: Czech Republic, Poland, Slovakia, Romania, Hungary and Croatia.
The list of key markets has not changed compared to the previous year. Over 70% of total
foreign premium volume of Austrian insurance groups was generated in these key markets in
2018 (2017: 73%).
The analysis of key markets not only deals with the structure and recent developments of the
individual insurance markets but also with a risk assessment, taking into consideration
macroeconomic conditions, important political, legal and regulatory changes as well as the
level of supervisory cooperation.
In the following sections, the results of the key markets analyses are presented in order of the
premium share.
SEITE 193.1 Czech Republic
Population (mil) 10,67
Real GDP Growth 2,94%
Real GDP Growth Forecast 2019 2,60%
Unemployment rate 2,23%
S&P Credit Rating AA-
Table 12: Macroeconomic Key Indicators 2018 Czech Republic (Source: SNL)
Performance in 2019-2020 will conform to the recent moderate growth pattern. Private
consumption is dissociated from the rapidly rising household incomes pushed upward by fast
rising wages. The EU funds supporting high infrastructural investment are largely exhausted.
The business sector is not keen on undertaking massive investment. Responding to higher
(but still moderate) inflation, the National Bank cautiously raises its policy rate. Fiscal policy
remains stability-oriented.4
3.1.1 Insurance Market Overview
3.1.1.1 Development and Results 2018
At the end of 2018, gross written premiums amounted to about 6.027 Mio. EUR, which is an
increase of 2,1% compared to the previous year. The market results denominated in local
currency show a slightly higher market growth rate of 2,8%.
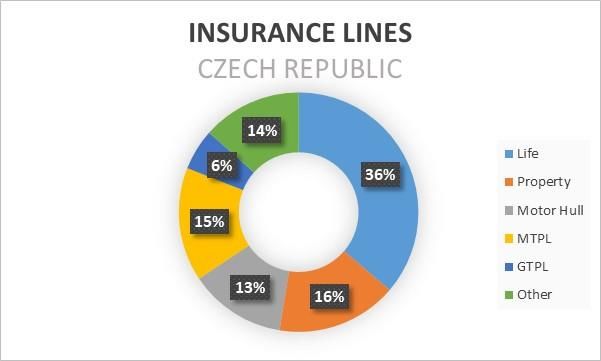
Table 13: Insurance Lines in Czech Republic 2018 (Source: X Primm Report 2018)
About 36% of gross written premiums account for life insurance and about 28% for motor lines
(MTPL and Motor hull). Life insurance saw an apparently stagnant evolution. Motor insurance
lines show the highest growth rates, providing for most of the extra premium volume. The
4
See WIIW Country Expertise Overview (https://wiiw.ac.at/czech-republic-overview-ce-5.html)
SEITE 20sector’s balance, however, is still volatile with average losses growing faster (around 7%) than
average premiums (3%).
3.1.1.2 Update Half Year 2019
The first HY/2019 results provided by the Czech National Bank show a positive market
dynamic, with overall GWP increasing by 9,14%, to 3,3 Bn. EUR, a volume that includes the
premium production of all Czech players, regardless the risk domicile, as well as the results
achieved by the branches of foreign insurers operating on the local market. The slightly y-o-y
appreciation of the Czech currency against Euro leads to improved growth rates for the market
data denominated in European currency.
The life insurance segment (Life and health insurance, incl. reinsurance, total) totaled GWP of
1,2 BN. EUR, 10,25% up y-o-y, recording a better dynamic than in 2018. One of the most
significant changes in the sector’s evolution was the growth recorded by the single payment
products, which according to CAP (i.e. Czech Insurance Association) data saw an almost 32%
y-o-y increase in premiums, after the double digit negative rate of 2018.
However, the number of newly concluded life insurance contracts is still decreasing, and thus
the total number of active policies also fell by about 2,2% y-o-y. The good news is that also the
number of surrendered policies has significantly decreased by comparison with the previous
years, showing a somehow stabilizing trend.
On the non-life side, among the lines with a significant share in the portfolio, motor insurance
classes have recorded the best growth rates, mostly supported by the increasing cars sales.
The property insurance line saw a 3,4% increase in GWP, to 525,5 Mio. EUR. On the other
side, claims paid went by about 21%, to 204,8 Mio. EUR, driven by the extreme weather events
that have affected the country.5
The Czech Republic intends to change tax law related to insurance. On the basis of the current
proposal, the difference between local GAAP and SII technical provisions should be subject to
a new tax, leading to a onetime tax effect. This proposal was already approved by government
but not yet by the parliament.
5
See X-Primm Report HY 2019
SEITE 213.1.1.3 Market Structure
The biggest company on the Czech insurance market is Česká pojišťovna followed by
Kooperativa pojišťovna (subsidiary of Vienna Insurance Group) and Allianz pojišťovna. The
market shares of these three companies remained almost unchanged and accounted together
for half of total market premiums in the reporting period in the Czech Republic.
Insurance Undertaking Market Share 2018 in %
TOP 3 - Life insurance
Ceska Pojistovna 17,13%
Pojistovna Ceske Sporitelny 15,88%
Kooperativa Pojistovna 15,13%
TOP 3 – Non Life insurance
Ceska Pojistovna 23,70%
Kooperativa Pojistovna 21,22%
Allianz Poijstovna 11,92%
Table 14: TOP 3 market shares in the Czech Republic 2018 (Source: X Primm Report 2018)
For 2019, the merger of the Kooperativa Pojistovna and Pojistovna Ceske Sporitelny was
performed which will also led to shifts in the market shares.
In March 2019, Bulgaria-based Euroins Insurance Group (EIG) has made a purchase
agreement with Germany-based ERGO International AG, to take over both the life and non-
life subsidiaries.
Ceska pojist'ovna announced it will merge with the Czech branch of Generali, thus creating
the largest local insurer in terms of total market share. By the end of 2019, Generali's insurance
portfolio should be transferred to Ceska pojist'ovna.6
3.1.2 Austrian Insurance Groups
UNIQA Group and Vienna Insurance Group operate with insurance subsidiaries in the Czech
Republic which account for an aggregated market share of 37%. In absolute figures premiums
in the amount of nearly 1.620 Mio. EUR are generated by Austrian groups, making the Czech
Republic the most important foreign insurance market with a premium share of nearly 25% of
total foreign business.
6
See X-Primm Report 1HY 2019
SEITE 223.2 Poland
Population (mil) 38,25
Real GDP Growth 5,15%
Real GDP Growth Forecast 2019 4,00%
Unemployment rate 6,08%
S&P Credit Rating A-
Table 15: Macroeconomic Key Indicators 2018 Poland
The fast GDP growth shows no signs of abating. Expanding public consumption financed by
high and rising public debt is one component of the present (‘populist’) economic policy.
Upward pressure on wages is considerable, reflecting tight labour markets. Investments by the
private business sector remain of critical importance, in particular because EU co-financing of
national investment outlays may be less generous (especially from 2020 on) than it used to
be.7
3.2.1 Insurance Market Overview
3.2.1.1 Development and Results 2018
Poland is the “flagship market” of the CESEE region. At the end of 2018, gross written
premiums amounted to about 14.458 Mio. EUR, which indicates a decrease of about 3,3%
compared to the previous year.
Table 16: Insurance Lines in Poland 2018 (Source: X Primm Report 2018)
7
See WIIW Country Expertise Overview (https://wiiw.ac.at/poland-overview-ce-8.html)
SEITE 23About 35% of gross written premiums account for life insurance and nearly 38% of premiums
for motor lines (MTPL and Motor hull).
Life insurance maintained a negative trend, with GWP decreasing by 14,3% to 5.048 Mio. EUR
in 2018. PPK, a new form of private pension product is expected to help reversing the negative
trend.
On the non-life side, the property insurance segment saw the best dynamic with an increase
in GWP of about 5,8% to 1.578 Mio. EUR. Regarding motor lines, with 5,2% Motor Hull shows
the most significant increase in gross written premiums. However, similar increase rates were
also seen on the paid claims side, in part as a result of Supreme Court Ruling, asking insurers
to pay compensation for permanent disability not only to the victim, but also to his/her close
relatives.8
3.2.1.2 Update Half Year 2019
At the end of 1HY 2019, Poland ended with only a modest increase in GWP, of 2,65%, to 7,56
Bn. EUR. The positive trend was entirely due to the GWP growth on the non-life side of 5,36%
up to 5,07 Bn. EUR. The life insurance sector remained on the downside path it follows already
since some years, with GWP decreasing by 2,45% y-o-y, a trend established mostly because
of the massive decline witnessed on the Unit-Linked line.
On the non-life side, most business lines saw a positive dynamic. Motor insurance lines
provided for the largest contribution to the higher premium volume. The increasing cars sales
had an important role to play in the market’s positive evolution, considering that at least on the
MTPL side, prices were stable. In fact, the most visible impact was recorded on the Motor Hull
line, for which GWP increased by 7,23% to 1,04 Bn. EUR. Property insurance saw an overall
positive evolution (3,3% increase in GWP). However, in 1HY 2019 the country was confronted
with several episodes of extreme weather events. Therefore, claims paid for the fire insurance
line increased by over 20% y-o-y.9
3.2.1.3 Market Structure
The domestic insurance company PZU with a market share of more than one third clearly
dominates the Polish insurance market. On the life insurance market, AVIVA achieved the
second rang in 2018.
Insurance Undertaking Market Share 2018 in %
TOP 3 - Life insurance
PZU Zycie 38,13%
AVIVA 8,81%
Open Life 7,26%
TOP 3 – Non Life insurance
PZU 32,13%
ERGO Hestia 15,05%
WARTA 13,79%
Table 17: TOP 3 market shares in Poland 2018 (Source: X Primm Report 2018)
8
See X-Primm Report FY 2018
9
See X-Primm Report 1HY 2019
SEITE 24In June 2018, Vienna Insurance Group signed an agreement to buy the Polish non-life insurer
Gothaer T.U.
3.2.2 Austrian Insurance Groups
Poland is the second largest foreign insurance market for Austrian groups with roughly 899
Mio. EUR of written premiums. Vienna Insurance Group and UNIQA Group are active via
various subsidiaries on the Polish Insurance Market. In 2018, Vienna Insurance Group merged
Polisa Zycie TU into Vienna Life TU na Zycie.
SEITE 253.3 Slovakia
Population (mil) 5,45
Real GDP Growth 4,11%
Real GDP Growth Forecast 2019 3,50%
Unemployment rate 5,42%
S&P Credit Rating A+
Table 18: Macroeconomic Key Indicators 2018 Slovakia
Slovakia’s growth decelerated sharply in the second quarter of 2019 due to declining exports
and investments. Growth in the key automotive industry turned negative in June. Growth will
slow down in the coming years, with forecasts for this and next year amounting to 2,3% and
2,2%10.
3.3.1 Insurance Market Overview
3.3.1.1 Development and Results 2018
At the end of 2018, gross written premiums amounted to about 2.208 Mio. EUR, which
indicates an increase of 3,42% compared to the previous year.
Table 19: Insurance Lines in Slovakia 2018 (Source: X Primm Report 2018)
The life insurance segments which accounts for about 47% of the total market, experienced a
decrease in premiums of 4,3% to 1.027 Mio. EUR, mostly driven by a decrease reported by
policies with profit participation. The Unit-linked line saw a positive development, but not
enough to compensate for the business premium shrinkage in the other lines.
10
See WIIW Country Expertise Overview (https://wiiw.ac.at/slovakia-overview-ce-12.html)
SEITE 26The non-life classes show an increase in GWP by 7,9%, mostly driven by the motor insurance
lines and income protection insurance (permanent health insurance). Motor insurance classes
account for about 30,5% of the market GWP portfolio, a share rather equally divided between
Motor Hull and MTPL lines.
The new 8% Insurance Premium Tax (IPT) came into force in January 2019 replacing the 2017
Premium Levy and applies to the following conditions:
□ Non-life insurance segments only, excluding MTPL which is taxed differently (also
reinsurance is not subject to tax)
□ The risk related to Slovak territory (e.g. insured properties located inside the country’s
borders, vehicles registered in Slovakia, or insured persons/entities with residence in
Slovakia)
The tax rate’s level is 8% of the tax base. The cost of the tax is supported by the final consumer
(insurer collects the IPT and directs it to the authorities).11
3.3.1.2 Update Half Year 2019
The Slovak market finished the first semester of 2019 with a GWP volume of 1.166 Mio. EUR,
which means an increase of 2,6% y-o-y. (+2.6%). Life sector held a share of 43,2% in total
GWP, while the rest of 56,2% of GWP was brought by non-life business lines.
Life sector at the end of first half of 2019 reached a GWP volume of 504 Mio. EUR (+1,5%).
Ranked by their GWP volume, the largest life segment, “Insurance with profit participation”,
amounted to 254 Mio. EUR (+2,7%), while the second largest line of life insurance GWP,
“Indexlinked and unit-linked”, was of 126 Mio. EUR (+1,2%) - an exception considering the
Unit-linked landscape in CEE, which decreased substantially in volume in 1HY 2019.
The non-life portfolio structure remained almost unchanged year-on-year, regarding the market
weights of main business lines, with an exception on GTPL, who shrunk by 9,5%, down to 44
Mio. EUR (1HY 2018: 49 Mio. EUR). Non-life paid claims amounted to 315 Mio. EUR (+11,1%),
most of the claims coming from the two main Motor lines which paid 227 Mio. EUR combined
together.12
3.3.1.3 Market Structure
The subsidiaries of Austrian insurance groups play an important role on the Slovakian
insurance market. In the last two years, no more data on market shares where publicly
available. On the basis of Austrian insurance groups’ reporting, the subsidiaries of Austrian
groups achieved an aggregated market share of 44% of the total market (non-life market: 41%,
life market: 48%) in 2018.
Some M&A highlights from the first half of 2019 include the selling of AEGON units to NN and
ACHMEA (UNION) and the GENERALI’s purchase of ERGO business.
11
See X-Primm Report FY 2018
12
See X-Primm Report 1HY 2019
SEITE 273.3.2 Austrian Insurance Groups
Three Austrian insurance groups carry out business via subsidiaries on the Slovakian
insurance market. Those entities generate premiums in the amount of 818 Mio. EUR making
Slovakia ranked third of foreign business markets.
Concerning Vienna Insurance Group, the merger of Poistovna Slovenskej Sporitelne and
Kooperativa Poistovna took place in 2018.
SEITE 283.4 Romania
Population (mil) 19,51
Real GDP Growth 4,10%
Real GDP Growth Forecast 2019 4,00%
Unemployment rate 4,10%
S&P Credit Rating BBB-
Table 20: Macroeconomic Key Indicators 2018 Romania
Economic growth is even stronger than last year, and could reach 4,2% in 2019, driven by
household consumption and investment. Monetary and fiscal policy remains loose. Expanding
deficits can be easily financed due to abundant international liquidity, albeit at a relatively high
cost, constituting a burden for the future. Weaker external demand is already feeding through
to industrial production, and will act as a barrier to growth in the future. We expect the interim
government to take steps to curtail the fiscal deficit in 202013.
3.4.1 Insurance Market Overview
3.4.1.1 Development and Results 2018
At the end of 2018, gross written premiums amounted to about 2.174 Mio. EUR, which
indicates an increase of 4,4% compared to 2017.
Table 21: Insurance Lines in Romania 2018 (Source: X Primm Report 2018)
The market remained focused on non-life insurance. The gross written premiums related to
non-life insurance amounted to 17,72 Mio. EUR in 2018, increasing by 4,6% compared to the
previous year. In the non-life portfolio, motor insurance lines account for almost 75% of the
13
See WIIW Country Expertise Overview (https://wiiw.ac.at/romania-overview-ce-9.html)
SEITE 29GWP with MTPL dominating the portfolio. The total amount of MTPL written premiums
decreased by 2,2% y-o-y, mostly as a result of decreasing tariffs. The adverse development is
obvious: The annual MTPL average premium decreased by about 12% y-o-y, reaching 612
RON. At the same time, the average claim paid increased by about 9% to 7.812 RON.
The life insurance segment accounts for only 21% of market GWP. During the last two years
(2017-2018) the life insurance segment gained some momentum, especially in 2017, when it
increased y-o-y by 21% in GWP terms. In 2018, life insurance premiums increased by only 4%
y-o-y.
3.4.1.2 Update Half Year 2019
The Romanian insurance market advanced by 6,1% in the first half of 2019, reaching a value
of about 1,15 Bn. EUR. It remains oriented towards the activity of non-life insurance, which
holds a share of 79% of the total gross written premiums.
Life insurance GWP amounted to about 237,5 Mio. EUR, up 3% up y-o-y. Also, a high degree
of concentration was maintained in the first semester of 2019, so that the first 2 companies in
terms of volume of GWP for the life insurance activity have a cumulative market share of 54%.
The bad news came from the paid claims side, where almost all insurance classes have seen
double-digit growth rates in the claims expenses, up to a total of 17,5% up y-o-y. Overall, there
is a discrepancy between the premiums and claims growth rates. For example, on the MTPL
line, while the average premium went by about 2% y-o-y, the average claim increased by
11,7%.
The Romanian insurance supervision authorities reported on the recent legislative projects.
Besides the transposition of the IDD, a new regulation for mutuals has been established.
The number of insurance companies decreased by about 25% in the last years. The local
MTPL market is characterized by a strong price competition and increasing market
concentration: EURINS and CITY Insurance considered together have a market share of
nearly 70%.
SEITE 303.4.1.3 Market Structure
The insurance market of Romania is characterized by a medium to high degree of
concentration. In 2018, approximately 89% of total gross written premiums were achieved by
10 insurance companies out of 29 companies performing insurance/reinsurance activity.
In life insurance as well as in non-life insurance, a subsidiary of Vienna Insurance Group is
among the TOP 3 market players.
Insurance Undertaking Market Share 2018 in %
TOP 3 - Life insurance
NN Asigurari de Viata 36,73%
BCR Asigurari de Viata VIG 17,39%
BRD Asigurari de Viaa 8,71%
TOP 3 – Non Life insurance
CITY Insurance 18,47%
OMNIASIG VIG 14,58%
ALLIANZ Tiriac 14,58%
Table 22: TOP 3 market shares in Romania 2018 (Source: X Primm Report 2018)
3.4.2 Austrian Insurance Groups
In 2018, the Romanian subsidiaries of Austrian insurance groups generated written premiums
of about 383 Mio. EUR (2017: 448 Mio. EUR). The sharp decrease in non-life premiums is
linked to the difficult situation on the MTPL market.
SEITE 313.5 Hungary
Population (mil) 9,71
Real GDP Growth 5,14%
Real GDP Growth Forecast 2019 4,40%
Unemployment rate 3,73%
S&P Credit Rating BBB
Table 23: Macroeconomic Key Indicators 2018 Hungary
Hungarian economic growth was strong in the first half of 2019, but the signs of a deceleration
are already discernible. In Q2 compared to Q1, investment growth slowed notably, while the
external environment deteriorated. From next year, EU transfers will drop by a substantial
degree, further weighing down investment. Labor shortages will remain problematic, and
increase the upward pressure on wages. A significant slowdown of economic growth over the
forecast horizon is expected, from 4,3% this year to 3,1% in 2020 and to 2,6% in 2021.14
3.5.1 Insurance Market Overview
3.5.1.1 Development and Results 2018
At the end of 2018, gross written premiums amounted to about 3.185 Mio. EUR which indicates
an increase of about 4,19%. In local currency, gross written premium volume reached 1.024
Bn. HUF, surpassing the 1.000 Bn-threshold for the first time. Given the almost 5% y-o-y
depreciation of the Hungarian Forint against the Euro, the market growth rate reached a higher
level of 7,1% of total GWP.
Table 24: Insurance Lines in Hungary 2018 (Source: X Primm Report 2018)
14
See WIIW Country Expertise Overview (https://wiiw.ac.at/hungary-overview-ce-6.html)
SEITE 32The life insurance sector lost about 1,5 percentage points of its weight in the market portfolio.
While premiums for endowment life insurance policies increased by 16% y-o-y, the unit-linked
lines saw a strong decline, losing almost 4pp of its weight in the market portfolio. In the non-
life sector the mandatory MTPL insurance line had the strongest dynamic with GWP increasing
by 10%. In motor insurance, the number of contracts grew by about 265.000 units, mostly as
a result of the increasing car sales of new passenger cars as well as the record sales of
second-hand cars.
With regard to claims development, there were fewer extreme weather events, therefore claims
paid for property insurance decreased by 18 y-o-y. With a coverage rate over 70%, Hungary
is one of the countries with the highest coverage rates in residential properties. However, to
further improve it, the Central Bank of Hungary intends to adopt some measures that may
increase competition in this market segment leading to cheaper prices or higher standards of
service for the same expense.
3.5.1.2 Update Half Year 2019
In the 1HY 2019, GWP rose by 14% y-o-y to about 1,8 Bn. EUR according to the market data
published by the National Bank of Hungary (MNB). Life GWP rose by nearly 8%, while non-life
GWP went up by over 19%.
The sharp increase in non-life premium income reflects the fact that from 1 January 2019, in
case of MTPL insurance, an insurance tax replaced the previous accident tax, meanwhile
phased out, (at a tax rate of 23%). The new tax is payable as part of the insurance premium,
providing for the increase in premium income, the MNB report explains.
In fact, MTPL was one of the most dynamic insurance classes during 2019, showing an
increase in GWP of nearly 34% y-o-y. The Motor Hull line also saw a 13,6% increase in GWP,
while insurers expectations for year-end are even more optimistic, given that as of July 1,
families with at least three children are getting financial support for the acquisition of a car (no
older than one year and with a price limit of 2,5 Mio. HUF). According to official data, nearly
9.000 families have already taken advantage of the opportunity and another 7.000 subsidized
car purchases are expected in the next two and a half years. Insurers have prepared dedicated
"family-friendly Casco" products. Together with the increasing sales of new cars, this measure
is expected to give some impetus to the specialty market.
3.5.1.3 Market Structure
In the last two years, no more data on market shares where published. On the basis of Austrian
insurance groups’ reporting, the subsidiaries of Austrian groups achieved an aggregated
market share of 16% of the total market (non-life market: 14%, life market: 18%) in 2018.
In 2018 and the beginning of 2019, the Hungarian insurance market experienced two important
structural changes:
□ Vienna Insurance Group merged its three subsidiaries into one company, thus from
1. April 2018 VIG is represented in Hungary solely by the insurance company UNION
Biztosito.
SEITE 33You can also read