Peak Hour Passenger Train Crowding Levels in Sydney and Their Implications for Urban Consolidation
←
→
Page content transcription
If your browser does not render page correctly, please read the page content below
Australasian Transport Research Forum 2010 Proceedings
29 September – 1 October 2010, Canberra, Australia
Publication website: http://www.patrec.org/atrf.aspx
Peak Hour Passenger Train Crowding Levels in
Sydney and Their Implications for Urban
Consolidation
Dr Tim Brooker,
Senior Transport Planner, Arup*, Sydney
Level 10, 201 Kent Street Sydney NSW 2000 Australia
Email for correspondence: tim.brooker@arup.com.au
Abstract
The Sydney Metropolitan Region has a long established Heavy Rail Network, serving mainly
residential suburbs west of the City Centre. Peak hour train service frequencies on most
lines leading to the Sydney CBD are now close to the reliable capacity limits of timetabled
operating headways ( 18 trains per hour ). There is only limited capacity with the existing rail
network (10% at most) to run additional trains into the Sydney City Centre CBD in the actual
morning peak 1 hour period on weekdays. In consequence regional growth in rail passenger
demand now primarily results in increased levels of crowding of the peak hour trains on most
of the rail lines in the vicinity of the Sydney CBD.
This situation has major implications for the locations of new residential in the Inner, Middle
Ring and Outer Suburban areas of Sydney. In the Outer Suburban areas, new rail links and
new rail stations are required to for basic accessibility and equity reasons to give new
residential areas access to the government funded rail network. In the Inner and Middle Ring
suburbs, where the remaining spare capacity in the existing heavy rail network is now almost
exhausted, new rail projects, either metro lines, extensions of the existing Inner West light
rail or significant heavy rail network improvements will need to come rapidly on-stream to
provide the necessary additional rail passenger capacity in peak periods.
*Note: The view and opinions which are expressed in this paper are based on the private
research investigations of the author and do not specifically represent the views of Arup.
1. Sydney’s Road and Rail Networks
The history, development and function of Sydney‟s road and rail systems has some
similarities but also many differences. The road system now serves widely dispersed travel
patterns and needs throughout the daytime and evening on both weekdays and weekends.
The rail system is much more focussed on meeting the morning and afternoon peak
weekday travel demands for commuting trips, in particular trips to and from the Sydney CBD
and other nearby employment districts.
This distinction is illustrated by the ratio of peak hourly to daily travel demand. On most of
Sydney‟s major roads, the peak hour proportion of total daily travel is typically less than 10
percent and can be as low as 6-7% on some routes ( RTA, 2002 ). In contrast, the rail travel
capacity and demand is much more “peak period” focussed and the passenger rail network
is currently able to accommodate 25% of the total daily travel demand in either the morning
or afternoon peak 1 hour periods, ie on trains arriving in the Central CBD area between 8-9
am on weekdays and departing between 5-6 pm ( CityRail, 2006 ).
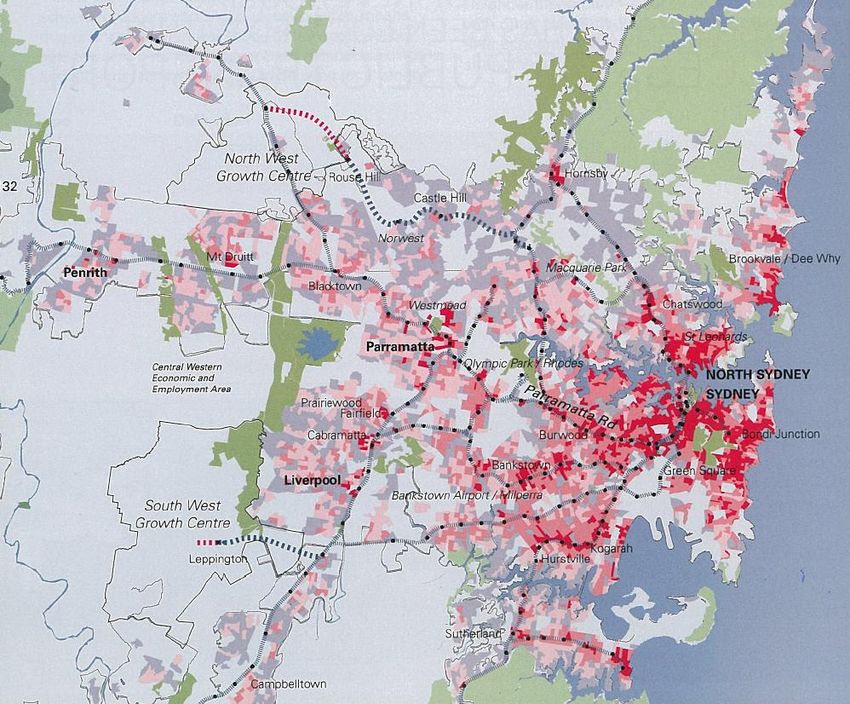
The Greater Sydney Metropolitan Region Rail Network has electric passenger train
operations as far north as Newcastle ( 166 km ) west to Lithgow ( 155 km ) south along the
coast to Kiama ( 120 km ) and south west as far as Macarthur ( 57 km ), see map in Figure 1
1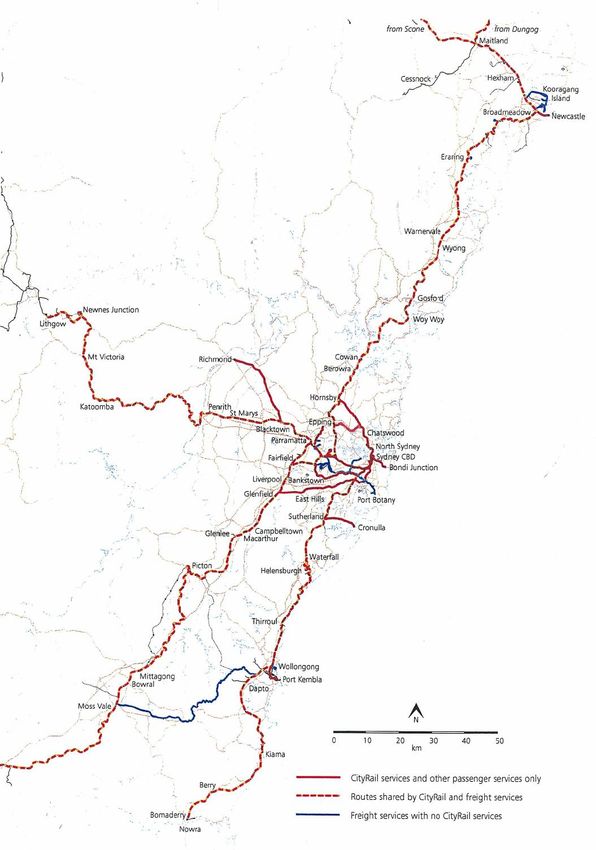
ATRF 2010 Proceedings

Figure 1 Greater Metropolitan Region Rail Passenger Rail Network

Source (State Rail, 2001) An introduction to State Rail planning processes for future rail operations and
infrastructure in the Greater Sydney metropolitan region, December 2001. ( the Epping to Chatswood Line which
opened in February 2009 has been subsequently added in by the Author )

                                                                                                           2
Instructions to authors (paper title)

In the Sydney context, a comparison of the peak hour functional capacity of the heavy rail
network vs road capacity is summarised by the peak hour peak direction capacity of a
standard two track railway, either on the surface or in a tunnel, carrying twelve trains per
hour at five minute intervals ( 1,000 passengers per train = 12,000 passengers per hour)
This is equivalent in capacity to a ten lane freeway carrying 2000 cars per lane per hour in
the peak direction at the current average peak hour commuter car occupancy level of 1.2
persons per car.

2. Existing Passenger Rail Network Operations
Sydney‟s passenger rail network has six defined routes approaching the Sydney CBD, as
illustrated by the route map in Figure 2 below. Some of these six routes combine the trains
from a number of other lines further out, in particular, the train services from the Main South
( via Liverpool ) Main North ( via west Ryde and Eastwood ) and Richmond Lines ( via
Blacktown ) all combine at Strathfield to travel on The Main West Rail Line ( 6 tracks = 43
trains per hour inbound ) to the Sydney CBD.
Figure 2 : Sydney Metropolitan Rail Network and a.m. Peak Hour Loadings 2008

Source ( CityRail, 2008)

The six Sydney CBD rail routes ultimately serve a total of 206 railway stations throughout the
Sydney Metropolitan Region, which according to Metropolitan Strategy definitions ( DoP
2005, DoP 2010 ) includes the outlying Blue Mountains, Hawkesbury, Wollondilly, Gosford
and Wyong Council areas, but not the Hunter, Illawarra and Southern Highlands regions.
Additional railway stations in these three adjoining regions make up the balance of the total
of 305 railway stations of the CityRail network.
The growth in the morning peak hour ( 1 hour actual peak ) “city bound” passenger train
loadings in recent years, based on CityRail train passenger counts which were undertaken in
March 2005, 2008 and 2010, is summarised in Tables 1, 2,3 and 4 below.

                                                                                             3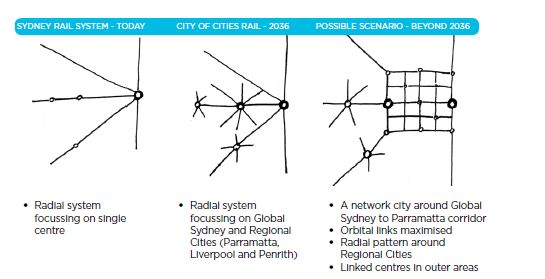
ATRF 2010 Proceedings

Table 1: Morning Peak Hour City Bound Passenger Train Operations (1 Hour Peak –
March 2005 )
Line (Year 2005 ) Trains    Capacity     Utilisation   % Loading Reasonable
                                                                    Spare Capacity
Main Western            42     42,000          34,995         83            7,000
Illawarra               17     17,000          15,270         90            1,700
North Shore             13     13,000          13,280         102           -300
Eastern Suburbs         13     13,000          7,110          55            5,900
Revesby / E Hills       12     12,000          10,670         89            1,300
Bankstown               6      6,000           5,570          93            400
Total All Lines         102    102,000         86,895         85            15,100
Source ( CityRail, 2006 )

Table 2: Morning Peak Hour City Bound Passenger Train Operations (1 Hour Peak –
March 2008 )
Line (Year 2008 ) Trains    Capacity     Utilisation   % Loading Reasonable
                                                                    Spare Capacity
Main Western            43     43,000          43,035         100           -100
Illawarra               18     18,000          18,180         101           -200
North Shore             13     13,000          14,325         110           -1,300
Eastern Suburbs         15     15,000          8,120          54            6,900
Revesby / E Hills       12     12,000          11,605         97            400
Bankstown               6      6,000           6,845          114           -800
Total All Lines         107    107,000         102,110        95            4,900
Source ( CityRail, 2008 )

Table 3: Morning Peak Hour City Bound Passenger Train Operations (1 Hour Peak –
March 2010 )
Line (Year 2010 ) Trains    Capacity     Utilisation   % Loading Reasonable
                                                                    Spare Capacity
Main Western            39     39,000          37,230         95            1,800
Illawarra               17     17,000          17,935         106           -900
North Shore             18     18,000          15,525         86            2,500
Eastern Suburbs         15     15,000          7,375          49            7,600
Revesby / E Hills       12     12,000          11,945         100           100
Bankstown               6      6,000           6,630          111           -600
Total All Lines         107    107,000         96,640         90            10,400
Source ( CityRail, 2010 )

The CityRail inbound passenger counts for the suburban trains are generally undertaken at a
cordon of stations, approaching the CBD outer limits, at King Cross, St Leonards, Redfern
and Sydenham. The only exceptions are for the East Hills via Airport Line Trains ( where the

                                                                                          4
Instructions to authors (paper title)
counts are undertaken at Wolli Creek Junction ) and the inter-city trains where the counts
are undertaken at the last major station before reaching the Sydney Metropolitan Area,
(Glenbrook, Helensburgh and Woy Woy ) as the primary intention of these train services is
to provide capacity for longer distance commuters and other regionally based passengers.
Since the mid 1990‟s, all Sydney region peak hour train services, inner and outer suburban
and inter-city have been operated by 8 car trains, as the practice before that time of
operating combinations of 4, 6 and 8 carriage trains on the same actual track at theoretical 3
minute headways, was found to cause extremely unstable operating conditions and
effectively ceased following a major timetable review in 1995/6.
For the purposes of this paper, the “reasonable operating capacity” of all the types of 8 car
trains currently operating on the Sydney network is defined as approximately 1,000 persons
per train. The actual seated capacity of the individual trains varies between 800-900 seats
and a comfortable operating capacity limit for commuters who use trains on a regular basis,
with all seats occupied and an additional 15% standing passengers as trains approach
closer to the Central Sydney CBD, is approximately 1,000 persons per train.
CityRail train crowding tests undertaken prior to the 2000 Olympics have confirmed that
under special event “crush” loading conditions, an 8 car train can accommodate
approximately 2,000 persons, but such “crush” loading conditions are not likely to be
attractive to regular weekday rail commuters as a lifestyle choice on a regular ongoing basis.
Table 4: Morning Peak Hour City Bound Passenger Train Operations (1 Hour Peak –
March 2010 )
Total All Lines Trains Capacity Utilisation % Loading Reasonable
Spare Capacity
March 2005 102 102,000 86,895 85 15,100
March 2008 107 102,000 102,110 95 4,900
March 2010 107 107,000 96,640 90 10,400
Source ( CityRail, 2006/8/10)
The comparison of the 2005, 2008 and 2010 totals of 1 hour morning peak city bound train
passenger loadings in Table 4 above, confirms very strong commuter rail patronage growth
at +6% per annum occurred from 2005 to 2008, recovering from an earlier decline during the
period 2001-2004. This growth was related to many factors, ie rapid urban consolidation
around key railway stations along the Main West and Illawarra Rail Line Corridors, and also
fuel price increases causing significant shifts from car to rail commuting on other lines.
Despite the decline in peak passenger demand from March 2008 to March 2010, a strong
underlying growth trend of +1,950 passengers per year ( +2.2% per annum from March
2005) was still evident for the five year period from March 2005 to March 2010.
In early 2008 the Sydney CBD based rail services were effectively experiencing strong
passenger growth and heading for a capacity „meltdown” situation by 2010. This was
effectively only averted by the short term consequences of the GFC ( Global Financial
“Industry” Crisis ) leading to a sudden drop in CBD based Financial Services Sector
employment and consequently peak hour rail commuting to the Central Sydney CBD area
immediately after August 2008.
The other key finding from the rail network capacity analysis is Table 1,2 and 3 is the marked
difference between the city bound capacity loadings on the Eastern Suburbs Line and the
other lines. The Eastern Suburbs Line benefits from the “through routing” of most inbound
Illawarra Line train services such that it‟s passenger loadings are still only on average about
50% of “practical operating capacity”, even at the height of the morning peak hour.
5ATRF 2010 Proceedings
Another recent change evident from the latest March 2010 passenger train survey results in
Table 3, is the morning peak city bound passenger crowding levels on the North Shore Rail
Line services have eased significantly with the addition of the Epping to Chatswood Rail Line
Service in February 2009. The excess passenger loadings on trains on this line were
previously among the worst of any lines in the CityRail network in both the 2005 and 2008
surveys but have now, as result of the 5 extra inbound train services in the peak hour, been
reduced to much more acceptable levels. The proposed additional passenger growth from
urban consolidation along this line in areas such as Ku-ring-gai is now more supportable.
In 2010, the most critical capacity line for city bound passenger loadings in the 1 hour actual
peak period is now the Bankstown line. This is the line where increased capacity from
additional peak hour train services, is now most badly needed.
A key finding from the overall analysis of the 2005, 2008 and 2010 passenger train loadings
is the considerable “mis-match” between the lines of the Sydney Metropolitan Region rail
network which currently have “1 hour morning peak period” spare passenger capacity, and
the areas of Sydney in which further urban consolidation is currently proposed or able to be
supported.
This is highlighted by the March 2010 passenger capacity analysis, in Table 3, where
approximately 70% of the current total spare capacity of the Sydney Metropolitan Region rail
network in the 1 hour morning peak period, is effectively only available on the Eastern
Suburbs line. However, this line in its current form, with only three railway stations, has very
little potential to generate significant additional future passenger demand through urban
consolidation, as it already has comparatively the highest population densities in the areas
surrounding it‟s railway stations, of any of the Sydney Metropolitan region rail lines.
3. Sydney Region Population Growth Trends
Historically, Sydney‟s population growth has fluctuated over a series of five to ten year
cycles, but the longer term trend as shown in Figure 2, has remained relative constant at an
average figure of +42,500 persons per annum throughout a 40 year period since the early
1970‟s. There is only a very hesitant trend towards a possible uplift in the average annual
population growth rate over the most recent two year periods, 2006/7 and 2007/8 where
growth has averaged +57,000 persons per annum.
Figure 3 : Sydney Metropolitan Region Long Term Population Growth trend
Source ( DoP, 2010 )
6Instructions to authors (paper title)
The current Sydney Region Metropolitan Growth Strategy (DoP, 2005) which was prepared
in December 2005 is now under review. The December 2005 Metropolitan Strategy was
based on year 2004 updates of population and dwelling numbers in the Sydney Region,
estimated from new dwelling completions since the 2001 census.
The Year 2031 future population and dwellings growth targets for the Sydney Metropolitan
Region which were proposed in 2005 were consistent with the longer term trends since 1962
but also assumed the current trend towards smaller average household sizes will continue
for the foreseeable future. The December 2005 strategy proposed +640,000 new dwellings
to be constructed within the Sydney Metropolitan Region, including the adjoining Central
Coast Region, to accommodate predicted future long term population growth of +1.1 million
persons at +40,740 persons per annum, namely:
( in 2004 ) 1.60 million dwellings with 4.2 million people = 2.63 persons per dwelling
( in 2031 ) 2.24 million dwellings with 5.3 million people = 2.37 persons per dwelling
( Growth Increment 2004 to 2031 =) +640,000 dwellings @ 1.72 persons per dwelling
A draft review of the December 2005 Strategy has now been released as a consultation
document (DoP, 2010), which proposes a substantially higher future population growth
target for the “Sydney Region” of +57,000 persons per annum throughout a 30 year period
from 2006 to 2036.
The corresponding new year 2036 total population target figure of 6.0 million persons ( 5.982
million to be precise) includes the Central Coast Region which has projected future
population growth of 120,000 persons resulting in a future total of over 424,000 persons in
2036.
Also, as yet there are no sub regional forecasts presented but the predicted future dwellings
growth target for the Sydney region overall is a 30 year growth target of +770,000 dwelling
with an accompanying employment growth forecast of +760,000 jobs, ie a future jobs growth
rate of 0.987 jobs per household.
This broadening of the basis of the Sydney Metropolitan Region growth strategy to include
the Central Coast Region is an acknowledgement that Sydney‟s projected future population
growth over a 30 year period can no longer realistically be contained within the traditionally
accepted boundaries of the Sydney Metropolitan Region and will inevitably “spill over” into
the adjoining Central Coast region.
There is also a future change in the future average persons per household estimates,
whereby the previously projected continuing long term decline in the average household size
in the Sydney region, to an average of only 2.37 persons per dwelling by 2031, has now
been revised to predicted average of 2.51 persons per dwelling in 2031. This decline will
presumably level out beyond that time with no significant further decline in 2036.
The future dwellings growth target of +770,000 dwellings from 2006 to 2036, to
accommodate future projected population growth of +1.7 million persons, now represents a
“future growth increment” of +770,000 dwellings at 2.21 persons per dwelling.
4. Proposed Distributions of New Dwellings in Sydney
Region Growth Strategy Targets
In 2005, the Metropolitan Strategy proposed an approximate 70% vs 30% split between the
projected dwellings growth via urban consolidation in existing urban areas, +420,000
dwellings, and the projected dwellings growth on “Greenfield Sites” of +220,000 dwellings,
comprising +160,000 dwellings in the two designated “Growth Centres” and +60,000
dwellings in the remainder of the Land Release Program areas.
7ATRF 2010 Proceedings
This 70% vs 30% split between new dwellings constructed by means of urban consolidation
and new dwellings on Greenfield Sites is proposed to be retained in the latest metropolitan
Strategy Review ( DoP, 2010 ). The future 30 year dwellings growth target of +770,000
dwellings therefore represents;
+231,000 target for new dwellings in Greenfield areas
+539,000 target for new dwellings in Urban Consolidation areas.
The +539,000 new dwellings which are proposed to be constructed, presumably by means
of future urban consolidation according to Transit Oriented Development principles, will all
therefore need a good level of accessibility to the metropolitan rail network by means of
either walking, cycling or good local bus feeder connections.
5. The Potential for Future Urban Consolidation in Sydney
Rail Station Catchments
A map of the existing dwelling density around all the railway stations in the Sydney
Metropolitan Region, Figure 4, was produced for the December 2005 Metropolitan Strategy,
based on the population data from the 2001 Census, which was the most recent census data
which was available at that time.
Figure 4 : Sydney Region Dwelling Densities Showing– Longer Term Urban
Consolidation Potential
Source ( DoP, 2005 ). The red colour indicates the highest residential density level of 25 dwellings per hectare,
the dark and light pink and grey colours represent densities of 12-25, 9-12 and 5-9 dwellings per hectare
respectively
8Instructions to authors (paper title)
The highest dwelling and population densities, in excess of 25 dwellings per hectare, are
currently to be found around the Eastern and Northern Beaches Coastal Suburbs and some
Inner West, Lower North Shore, Bankstown and Illawarra Line railway stations.
Heading further out from the City Centre, there are many suburban railway stations which
still have relatively low base population and dwelling densities, less than 15 dwellings per
hectare typically, which can be considered to have good future potential for urban
consolidation type development ( Transit-Oriented Development ). These railway stations
are listed below in Table 5 in relation to sections of the relevant railway lines.
Table 5 : List of Sydney Region Railway Stations Potentially Suitable for Additional
Residential Development by Urban Consolidation.
Railway Line Stations With Low Dwelling Density in 2001, Number of
Potentially Suitable For Future Long Term Stations
Urban Consolidation
Main West line ( Central to Central, Redfern, Macdonaldtown, Croydon 4
Strathfield )
Main West line ( Homebush to Homebush, Flemington, Lidcombe, Olympic Park, 5
Parramatta ) Granville ( Clyde should be excluded due to
primarily industrial uses )
Main West line ( Main North North Strathfield, Concord West, Rhodes, 17
Section ) Meadowbank, Denistone, Eastwood, Cheltenham,
Beecroft, Pennant Hills, Thornleigh, Normanhurst,
Asquith, Mount Colah, Mount Kuringai, Berowra,
Cowan, Brooklyn
Main West line ( Carlingford Rosehill, Camellia, Rydalmere, Dundas, 5
Branch ) Carlingford
Main West line ( Main South Merrylands, Guildford, Fairfield, Canley Vale, 19
Section ) Warwick Farm, Casula, Glenfield, Macquarie
Fields, Ingleburn, Minto, Leumeah, Campbelltown,
Macarthur, Menangle Park, Menangle, Douglas
Park, Picton, Tahmoor, Bargo ( Yennora should
be excluded due to primarily industrial uses )
Main West line ( Westmead to Westmead, Wentworthville, Toongabbie, Seven 11
Penrith ) Hills, Blacktown, Doonside, Rooty Hill, Mount
Druitt, St Marys, Werrington, Kingswood
Main West line ( Richmond Branch Marayong, Quakers Hill, Schofields, Riverstone, 10
) Vineyard, Mulgrave, Windsor, Clarendon, East
Richmond, Richmond
Main West line ( Blue Mountains Lapstone, Glenbrook, Blaxland, Warrimoo, Valley 14
Section ) Heights, Faulconbridge, Linden, Woodford,
Hazelbrook, Lawson, Bullaburra, Wentworth Falls,
Leura, Katoomba
Illawarra line ( Erskineville to Erskineville, St Peters, Tempe, Arncliffe, Banksia ( 5
Hurstville ) Sydenham should be excluded due to Aircraft
Noise issues)
Illawarra line ( Penshurst to Oatley, Como, Jannali, Sutherland, Loftus, 6
Engadine ) Engadine
Illawarra line ( Cronulla Branch ) Kirrawee, Caringbah, Woolooware 3
North Shore line (Milsons Point to Waverton, Wollstonecraft Artarmon, 3
Chatswood)
9ATRF 2010 Proceedings
North Shore line ( Macquarie line North Ryde, Macquarie Park, Macquarie 3
stations) University
North Shore line ( Roseville to Lindfield, Killara, Gordon, Pymble, Turramurra, 7
Wahroonga) Warrawee, Wahroonga
Eastern suburbs line ( Kings Cross No Stations With Low Density Currently 0
to Bondi Junction )
Airport/ E Hills line ( Green Square Green Square, Mascot, Wolli Creek 3
to Wolli Creek)
Airport/ E Hills line ( Turrella to Turrella, Bardwell Park, Bexley North, Kingsgrove, 8
Holsworthy ) Beverley Hills, Panania, East Hills, Holsworthy
Bankstown line ( Marrickville to Canterbury, Belmore, 2
Bankstown )
Bankstown line ( Yagoona to Birrong, Regents Park 2
Berala)
Bankstown line ( Sefton to Sefton, Villawood, Carramar, (Leightonfield should 3
Carramar ) be excluded due to primarily industrial uses)
Central Coast Line ( Wondabyne to Wondabyne, Woy Woy, Koolewong, Tascott, 13
Warnervale ) Point Clare, Gosford, Narara, Niagara Park,
Lisarow, Ourimbah, Tuggerah, Wyong,
Warnervale
Future South West Rail Link Edmonson Park, Leppington 2
Future North West Rail Link Cherrybrook, Castle Hill, Hills Centre, Norwest, 6
Kellyville, Rouse Hill
As listed in Table 5 above, there are a total of 151 out of the existing 206 railway stations in
the Sydney Metropolitan and Central Coast Regions, which currently have low dwelling
densities ( less than 15 dwellings per hectare typically ) in their surrounding residential areas
within an 800 metre radius walking distance catchment, where future urban consolidation
type “Transit Oriented Developments” should be feasible.
Where these railway stations are located in existing or proposed major commercial centres,
eg Westmead, Blacktown, Macquarie Park and Sutherland, future urban consolidation by
means of High Rise High Density residential development in areas close to the railway
station should clearly be feasible. However, the existing low density suburban nature of
many of the other railway stations, means that high rise high density residential development
is not really desirable as the basis of a future urban consolidation strategy for these railway
stations. At the majority of the stations which are in existing low density residential
catchments, more compatible medium density type townhouse or maximum 3 storey
residential flat development should preferably form the major component of the future urban
consolidation strategy. For this type of railway station a target of increasing the average
dwelling density from typically 15 dwellings per hectare or less ( throughout the 800 metre
radius walking distance catchments) to approximately 25 dwellings per hectare in the future,
should generally be feasible over a 25-30 year future period.
The overall future Sydney plus Central Coast Region “urban consolidation” growth strategy
target of +539,000 dwellings represents an average of approximately +3,570 dwellings per
existing railway station for approximately 151 potential future urban consolidation railway
stations on the Sydney Metropolitan rail network, as listed in Table 5. Some of the major
railway stations such as Blacktown which will clearly be able to accommodate a significant
amount of future residential development in and around the town centre, to accommodate
this general level of future residential growth. However, many other smaller railway stations,
10Instructions to authors (paper title)
in outlying areas adjacent to National Parks, such as Linden in the Blue Mountains, will
clearly not be able to support significant levels of residential growth.
In practice the upper limit to the amount of future urban consolidation type development
which is potentially able to be accommodated within the 151 identified railway station
catchments on the Sydney Metropolitan Region Rail Network, would be a maximum of 4,000
additional dwellings per railway station, with an overall average figure of 2,000 additional
dwellings per railway station which would represents an overlay of 10 additional dwellings
per hectare ( gross ) over the 200 hectare catchment area within 800 metres walking
distance of the station. In practice, good local bus feeder services will also assist in
extending the effective railway station catchments, significantly beyond the 800 metre radius
at many busy suburban stations.
6. Proposed Sydney Region Rail Network Capacity
Improvements
There are four major proposed improvements to the Sydney Region Metropolitan Rail
network in the Draft Metropolitan Strategy Review and it‟s accompanying Transport Plan,
(NSW Government, 2010) namely.
The South West Rail Link, to Leppington
The North West Rail Link, to Rouse Hill
The Western Sydney Express Rail Services
The Inner West Light Rail Extensions
The first two of these projects have previously been documented, at length, in numerous
other government reports and publications. The other two are more recently proposed
projects which are summarised here by the following extracts from the 2010 Metropolitan
Transport Plan.
6.1 The Western Sydney Express Rail Services
The Western Express Rail Project Figure 5 will see two of the main west tracks which
currently terminate at Central, extended via new track from Eveleigh and new underground
platforms at Redfern to three other new railway stations at, Railway Square, “City West”
below Sussex Street and “Wynyard West” near Barangaroo. This will achieve full future
separation of the express, suburban and local tracks on the Main West line and eliminate the
need for Main West line express trains to merge with suburban tracks at the Illawarra
Junction, near Redfern.
This will deliver improved capacity with faster trains from Sydney‟s west to the CBD
permitting up to six additional trains per hour ( with an increased peak hour capacity of
approximately 6,000 passengers per hour ) to operate to and from the Sydney CBD.
6.1 The Inner West Light Rail Extensions
The Inner West Light Rail Extensions propose extensions at both the Sydney CBD end (
from Haymarket to Barangaroo and Circular Quay ) and the Outer end ( from Lilyfield to
Dulwich Hill including a new heavy rail interchange station at Lewisham on the Main West
Rail Line suburban tracks ) The existing Light Rail services operate with a practical capacity
( including both seated and standing passengers of 200 passengers per train ).
With the proposed extensions, the peak hour frequency of the services can improve from
about 8 minutes currently ( 7 trains per hour ) to a theoretical maximum of about 2.5 minutes
in the future ( 24 trains per hour ). The peak 1 hour city bound passenger capacity of the
system will increase from about 1,400 passengers per hour currently to 4,800 per hour after
the proposed extensions are completed, as illustrated by the map in Figure 6.
11ATRF 2010 Proceedings
Figure 5: Concept Details of Western Sydney Express Rail Project
Source: NSW Government, 2010 Metropolitan Transport Plan
Figure 6 : Map of Proposed Extensions to Sydney Inner West Light Rail Routes
Source: NSW Government, 2010 Metropolitan Transport Plan
12Instructions to authors (paper title)
A recent discussion paper prepared by Dr Garry Glazebrook of The University of
Technology, Sydney, ( Glazebrook, 2008) estimated that with no additional rail network
extensions or improvements, the limit of the Sydney Region Rail network to accommodate
more city bound trains heading inbound towards the Sydney CBD in the actual 1 hour
morning peak period, is probably an additional 7 trains per hour inbound, distributed across
various lines ( but mostly on the Bankstown line ). This potentially increases the overall
capacity of all inbound train services to the Sydney CBD from 107 trains currently ( in March
2010 ) to a future potential maximum of 114 trains per hour, before any of the currently
proposed rail network improvements are implemented.
If the three currently proposed heavy rail network extensions/ improvements which are
identified in the latest NSW Government Planning and Transport Strategies ( DoP, 2010 )
and ( NSW Government, 2010 ), namely the NWRL, SWRL and WSER train services, are
constructed in the future, these projects would each independently add a further six trains
per hour (eighteen additional trains per hour in total) in the actual morning peak hour on a
variety of rail lines heading inbound towards the Sydney CBD.
The future rail lines, by which these eighteen additional trains per hour would most likely
approach the Sydney CBD, and their consequent effects in improving the overall Sydney
Region rail network capacity are summarised by Table 6 below.
Table 6: Maximum Future Potential Morning Peak City Bound Passenger Train
Operations (1 Hour Peak ) with Additional NWRL, SWRL and WSER Train Services
Line (Year 2010 ) Trains Capacity Current Utilisation Reasonable Spare
(Year 2010 ) Capacity
Main Western 48 48,000 37,200 10,800
Illawarra 21 21,000 17,900 3,100
North Shore 18 18,000 15,500 2,500
Eastern Suburbs 18 18,000 7,400 10,600
Revesby / E Hills 15 15,000 11,900 3,100
Bankstown 12 12,000 6,600 5,400
Total All Lines 132 132,000 96,500 35,500
Source: ( Glazebrook, 2008 ) with minor modifications by the author
With the eighteen additional future trains per hour provided by the NWRL, SWRL and WSER
train services, the future spare capacity on the Metropolitan Rail Network to accommodate
additional morning peak hour commuter rail passenger growth, from future urban
consolidation throughout the Sydney and Central Coast Regions, would be 35,500 city
bound passengers per hour. This is a 37% increase above the current March 2010 morning
peak 1 hour city bound rail passenger demand level.
However, approximately 10,600 passengers per hour of this future spare capacity is
effectively “locked up” on the Eastern Suburbs rail line corridor where it is unable to serve
future urban consolidation in the wider Sydney region, unless there is an extension of the
existing heavy rail line beyond Bondi Junction, eg potentially to continue via Randwick and
Kingsford and “loop around” to connect with the remainder of the Sydney Metropolitan
Region rail network at Sydneham.
Also, the published CityRail passenger loading levels on the morning peak hour city bound
Inter City train services, which are measured at outlying stations as these trains approach
the edge of the Sydney Metropolitan area ( Helensburgh, Glenbrook and Woy Woy ),
exclude any additional passengers who have boarded these trains at stations closer to
13ATRF 2010 Proceedings
Sydney, such as Sutherland, Blacktown, Parramatta, Epping and Hornsby. These estimated
additional inbound passengers are a total of 3,100 passenger in the peak 1 hour period.
When the theoretical spare capacity estimate of 35,500 inbound passengers per hour is
adjusted to account for these two losses, the effective spare capacity of the Metropolitan
Region heavy rail network to serve future urban consolidation throughout the Sydney Region
is a much less impressive total of approximately 21,800 peak hour city bound passengers.
To this figure can however be added, the potential additional capacity of the proposed Inner
West Light Rail System extensions (3,400 additional city bound passengers per hour),
assuming the necessary feasibility studies receive the appropriate NSW Government
endorsement when they are completed later this year. This would give an overall future
Sydney Metropolitan Region rail network spare capacity limit, to support future urban
consolidation, of 25,200 peak hour city bound passengers.
7. Provisional Limits to Future Urban Growth in Sydney
Supported by The Rail Network
7.1 The Predict and Provide Model of Transport Planning
Throughout the period from the 1960‟s onwards, in most developed countries such as
Australia, the “Predict and Provide” model of Transport Planning has been applied to new
road network development in conjunction with new urban development.
In this process, a great deal of research effort, including the development of highly complex
and detailed transport network models, is expended in predicting the future travel demands
of the new residents and workforces of new urban areas and ensuring that an adequate road
network is provided, or at least planned to be provided, to meet their future travel needs,
often with extensive government subsidy.
In principle this philosophy is commendable and the only possible problem is really that a
similar level of research effort and planning has not been expended on predicting and
providing for the future public transport access needs, eg by bus or rail, for such
communities.
The current design benchmarks for passenger rail commuter usage of the Sydney Region
rail network, for existing urban residential development at a range of distances from the
Sydney CBD, is illustrated by the most recent Year 2006 Census data, by the chart in Figure
7 below.
For a future sustainable transport outcomes for the Sydney region, in terms of energy
consumption and a whole range of other social, economic and environmental factors, it is
important that the current benchmark level of public transport journey to work usage are at
least maintained, if not generally improved, with future urban development.
From the chart in Figure 7, the current benchmark levels can be determined separately for
both Urban Consolidation and future Greenfield site developments in the Sydney region, as
follows.
20% Journey to work travel by rail for new Urban Consolidation type development
located between 0-40 kilometres from the Sydney CBD ( mid range figure for typical
development located 20 kilometres from the Sydney CBD )
8% Journey to work travel by rail for new Greenfield type development located
between 40-80 kilometres from the Sydney CBD ( mid range figure for typical
development located 60 kilometres from the Sydney CBD )
14Instructions to authors (paper title)
Figure 7 : Sydney Region %Rail Usage for Journey To Work Travel, by Distance From
The Sydney CBD
Source 2006 Census, ABS, data for 64 Sydney Region Statistical Local Areas ( SLAs )
7.2 Future Growth in Journey To Work Rail Travel Demand From
New Urban Development
The future projected Sydney Region and Central Coast strategy for new urban growth
proposes a total of 770,000 additional dwellings which will generate future morning peak 1
hour rail commuter travel demand as follows
Future Urban Consolidation Component = +539,000 Dwellings
Future Growth in Journey to Work Trips by Employed Persons = +532,000 per day
Future Growth in Journey to Work Rail Trips ( 20%) = 106,400
Future Proportion Travelling to or Through the Sydney CBD ( 70%) = 74,500
Future Proportion Travelling in Actual 1 hour peak ( 50%) = 37,250
Future Greenfield Site Component = +231,000 Dwellings
Future Growth in Journey to Work Trips by Employed Persons = +228,000 per day
Future Growth in Journey to Work Rail Trips ( 8%) = 18,200
Future Proportion Travelling to or Through the Sydney CBD ( 70%) = 12,740
Future Proportion Travelling in Actual 1 hour peak ( 50%) = 6,370
The combined future 1 hour morning peak demand for additional rail commuter journeys
travelling inbound towards the Sydney CBD, from both these components of the future
Metropolitan Growth Strategy, is a total of +43,620 additional city bound peak hour rail
passengers. This is a future growth rate of +1,450 city bound peak hour rail passengers per
year, over a 30 year period from 2006 to 2036.
15ATRF 2010 Proceedings
However the maximum potential spare capacity of the Sydney Metropolitan Region Rail
Network to accommodate this growth, with all the currently identified rail network capacity
improvements completed, including the three Heavy Rail Line extensions and the proposed
Inner West Light Rail extensions, is a total of only +25,200 additional peak hour city bound
rail passengers.
This situation is however mitigated to a certain extent because by mid 2010, we are already
4 years into the future 30 year ( +770,000 dwellings ) growth strategy from 2006 to 2036, so
the projected actual growth in peak hour city bound rail passenger demand from the year
2010 onwards is actually only 86.6% of the overall 30 year target, ie +37,800 trips.
Nevertheless the current Sydney Metropolitan Rail System, with all proposed improvements,
is effectively only able to accommodate 67% of peak hour city bound rail passenger growth
from the year 2010 onwards, ie 17 years growth from the year 2010 to the year 2027.
The four currently identified projects of the of “Metropolitan Rail Expansion Strategy” will
therefore only provide sufficient additional capacity to meet a 17 year future growth strategy
and will provide additional peak hour city bound rail passenger capacity to meet projected
growth in demand, approximately as follows.
Existing Spare Rail Network Capacity (7 extra trains) = 3 years growth to 2013
Inner West Light Rail Extensions, needed by 2013 = 2 years growth to 2015
South West Rail Link Completion, needed by 2015 = 4 years growth to 2019
North West Rail Link Completion, needed by 2019 = 4 years growth to 2023
Western Sydney Express Rail Services, needed by 2023 = 4 years growth to 2027
Under a future Metropolitan Rail Network development strategy such as this, the future
timing of each project is potentially interchangeable, but the overall combined 13 year time
horizon to the year 2023, for the completion of all projects, is fixed. Beyond the year 2027, at
least one other additional, as yet unidentified future rail network expansion project will then
be required to permit the continuing growth in metropolitan rail commuter passenger
capacity to support the full extent of the proposed +770,000 dwellings urban growth strategy
which is proposed in the Year 2036 Sydney Region Metropolitan Strategy.
7.3 Longer Term Potential for Future Rail Network Development
Beyond the year 2036 a more schematic future rail network development strategy for the
Sydney Region is very crudely and schematically identified in the Draft Planning Strategy
(DoP, 2010) as shown below in Figure 8, but there is no indication as to how any of the
potential new rail network extensions, to be considered beyond the year 2036, may actually
be identified as “real projects”.
In principle rail projects such as
An additional North South Heavy Rail Crossing of Sydney Harbour in the vicinity of
the Sydney CBD, generally as proposed by the Sydney Morning Herald Long Term
Public Transport Plan, ( SMH Public Transport Inquiry, 2010 )
The approved but not yet built Parramatta to Epping extension of the Epping to
Chatswood Rail line
A potential extension of the Eastern Suburbs Railway Line via Charing Cross,
Randwick, Kingsford, Eastlakes and Mascot to Sydenham
An potential new underground Hurstville to Strathfield Rail Line
could all potentially meet the requirements for new rail projects under the longer term
strategy objectives as outlined in Figure 8.
16Instructions to authors (paper title)
However, although these rail projects all significantly improve the overall connectivity of
the Sydney Region rail network, they do not all actually improve the peak hour rail
capacity for journeys to and from the Sydney CBD.
Figure 8: Future Schematic Graphic Illustrating Possible Longer Term Rail Network
Extensions
Source: NSW State Government 2010 Draft Metropolitan Transport Plan
7.4 The Implication of Unsustainable New Urban Development
Research on the typical amount of household car travel which has recently been published
by Dr Gary Glazebrook of the University of Technology in Sydney shows that the total
variation in the amount of car travel per household in the Sydney Region, varies by as much
as a factor of four between the typical inner city households (16,000 km per year on
average) and households in the outer suburbs (61,000 km per year on average), Figure 9.
In addition to the implied additional fuel consumption, vehicle insurance and maintenance
cost liability component of this additional motor vehicle usage, over a four and a half year
period, the total amount of additional car travel undertaken by each new outer suburban
household also generally corresponds to the current total life expectancy of a typical new
motor vehicle ( 210,000 kms approximately ) being consumed by each outer suburban
household.
8. Summary and Conclusions
The Sydney Metropolitan Region Rail Network Currently Provides a total of 107 inbound
morning peak hour train services to the Sydney CBD. This could potentially increase to 114
train services per hour without any major new rail lines or network improvements. This
however represents approximately three years spare capacity, for the calculated future peak
hour city bound passenger demand growth rates of the draft Year 2036 Metropolitan
Development Strategy ( +770,000 dwellings over a 30 year period ) to be constructed in
Sydney and the adjoining Central Coast Regions.
There are significant doubts about the realistic capacity of the projected future urban
consolidation component (70%) of the year 2036 Metropolitan Development Strategy
(+539,000 dwellings ) being able to be accommodated in areas with reasonably good access
to the light rail or heavy rail networks in Sydney. The maximum probable capacity is probably
17ATRF 2010 Proceedings
more like 300,000 additional dwellings being able to be accommodated, primarily through
new townhouse and low rise residential development, in the walking distance catchments of
typical suburban railway stations, with a lesser proportion of high rise high density type
residential development, in the major commercial centre railway station precincts.
Figure 9 : Sydney Region Annual Household Vehicle Kilometres of Car Travel
Source: A Plan for Sydney‟s Transport by Dr Garry Glazebrook, UTS, October 2008
The projected future Metropolitan Strategy growth increments for both Urban Consolidation (
+539,000 dwellings ) and Greenfield site residential development ( +231,000 dwellings ) will
together generate an additional demand for morning peak hour travel to the central Sydney
CBD area of approximately +37,800 city bound rail passenger trips per hour from the year
2010 onwards.
The future spare capacity of the Heavy Rail Network, with the proposed SWRL, NWRL and
WSER project train services, and the Inner West Light Rail Extensions to both Circular Quay
and Dulwich Hill, will be approximately +25,200 city bound rail passenger trips per hour. This
will only be able to accommodate the additional rail travel demand from projected residential
growth for a maximum 17 year future period ( to the year 2027 ) and all these rail projects
will need to be completed sequentially before this time, ie by the year 2023 at the latest.
Beyond the year 2027 further new Heavy Rail or Light Rail Projects will need to be formally
identified and constructed in order to maintain the regional rail network capacity to service
18Instructions to authors (paper title)
the future Urban Consolidation and Greenfield development components of the overall
Sydney Metropolitan Region urban growth Strategy.
Already some potential projects are evident, eg a new North South rail crossing of Sydney
Harbour,( SMH Public Transport Inquiry, 2010 ) and a potential extension of the Eastern
Suburbs Rail Line underground via Randwick and Kingsford, to connect with the Illawarra
Rail Line at Sydenham, which is recommended by the Author, but it will be difficult to find
other projects which meet the twin longer term objectives of improving connectivity in the rail
network, while also providing improved capacity for peak hour rail commuter travel to and
from the Sydney CBD.
9. References
(ABS Census, 2006) Journey to work travel summary data for the 64 Statistical Local Areas (
SLA‟s ) of the Sydney Region.
(CityRail, 2006) A Compendium of CityRail Travel Statistics, 5th Edition, April 2006
(CityRail, 2008) A Compendium of CityRail Travel Statistics, 6th Edition, June 2008
(CityRail, 2010) A Compendium of CityRail Travel Statistics, 7th Edition, 2010 Date TBA
(Dop,2005) City of Cities, A Plan for Sydney‟s Future, NSW Government‟s Metropolitan
Strategy, November 2005
(Dop,2010) Sydney Towards 2036, Metropolitan Strategy Review Discussion Paper, March
2010 and the accompanying Draft Metropolitan Transport Plan
(Glazebrook, 2008) A Plan for Sydney‟s Transport, Presentation by Dr Garry Glazebrook of
The University of Technology, Sydney, to The Fabian Society, Glebe, 18 October 2008.
(NSW Government, 2010) Metropolitan Transport Plan, February 2010
(RTA, 2002) Traffic Volumes and Supplementary Data, Sydney Region 2002
(SMH Public Transport Inquiry, 2010 ) http://www.transportpublicinquiry.com.au/
(State Rail, 2001) An introduction to State Rail planning processes for future rail operations
and infrastructure in the Greater Sydney metropolitan region, December 2001
19You can also read