Australian Real Estate Quarterly Review - Q1 2019 - REIT AsiaPac
←
→
Page content transcription
If your browser does not render page correctly, please read the page content below
Australian
Real Estate
Quarterly
Review
Q1 2019
Australian Real Estate Quarterly Review | Q1 2019 Page 1 of
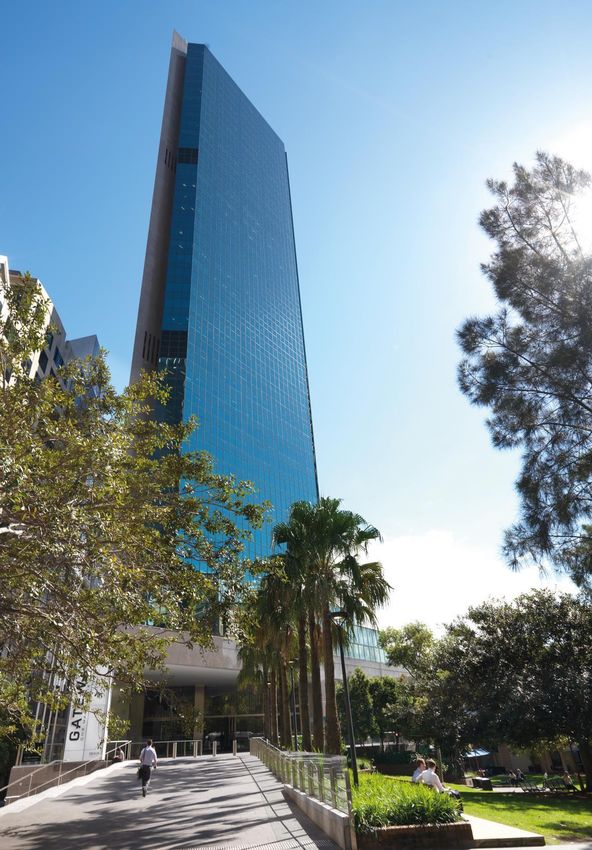
13 Gateway, Sydney, owned by Dexus Wholesale Property Fund.
Inside

   Page 03                 Investment climate

   Page 05                 Transactions

   Page 06                 Performance

   Page 07                 Office markets

   Page 08                 Office market wrap

   Page 09                 Industrial

   Page 11                 Retail

   Page 12                 Dexus Research

Australian Real Estate Quarterly Review | Q1 2019   Page 2 of 13
Investment climate

Growth outlook faces headwinds                            Figure 1. Business and consumer confidence
While the global economy grew at the reasonable
pace of 3.8% in 2018, there is considerable
uncertainty about whether that growth can be
maintained - centred around the effect of interest rate
rises on the US economy, the impact of the trade war
on the Chinese economy and a slowing in Europe
complicated by Brexit. While noting the risks, our
assumption is for orderly moderation of growth in the
US and China as the Federal Reserve reviews the
pace of monetary tightening and progress is made
on trade talks.
                                                          Source: Westpac-Melbourne Institute, NAB
Recent data releases point to a moderating growth
story for the Australian economy:
                                                          Figure 2. Employment growth
▪   Consumer confidence levels dipped and are now
    back in the pessimistic zone in January
▪   House prices declined further in the December
    quarter and building approvals have started
    falling. The correction in housing is expected to
    lead to a fall in investment and consumption,
    dragging on GDP by up to 0.9% p.a. over
    FY19/20
▪   Business conditions fell sharply in December with
    declines across most industries and states. We’re
    hopeful the fall is more based on sentiment than
                                                          Source: ABS
    reality, and expect business investment will
    remain supportive (albeit slowing)
                                                          Table 1. Australian economic forecasts: Q4 2018
The Australian economy is well positioned to handle
                                                                                             Jun-18        Jun-19       Jun-20
the housing slowdown:
                                                          Real GDP %pa                         2.8%         2.0%             2.0%
▪   The labour market still appears solid, with           Final demand %pa                     3.5%          1.5%            1.8%
    employment growing at 2.2% y/y and the                Employment %pa                       3.1%         2.0%             1.1%
    unemployment rate is low at 5.0%                      Goods imports %pa                    7.1%         0.0%             1.9%
▪   Population growth is running at 1.5% p.a. and         Retail sales %pa (real)              2.6%          1.9%            2.0%
    public spending on infrastructure is adding to        CPI %pa                              2.0%          1.4%            1.8%
    growth                                                90 Day bill %                        1.8%          1.8%            1.3%

On balance, we expect Australian real GDP growth          10yr Bond %                          2.7%          2.1%            2.0%
to moderate from 2.8% in FY18 to a below trend level      AUD/USD                               0.77         0.65            0.60
of 2.0% y/y in FY19 and FY20. Our base case               Source: Deloitte Access Economics base, Dexus adjusted forecasts
assumes two more rate cuts by the RBA, bringing
the cash rate down to 1.0% by FY20. Interest rates
are forecast to remain low for a considerable time.

Australian Real Estate Quarterly Review | Q1 2019                                                             Page 3 of 13
Key themes for 2019
Figure 3. Australian house prices vs consumption
1. Risk aversion vs growth appetite
While our base case is for a moderation of growth
rather than a sharp slowdown, investors clearly
remain cautious about the risks. The prospect of
heightened market volatility bodes well for capital
flows into A-REITs, direct property and unlisted
property funds as investors turn to defensives. Core
CBD assets also stand to benefit. Australian property
is well positioned in the event of a sudden demand
shock. In Australia’s largest office markets, Sydney
and Melbourne, vacancy is at historic lows, making
Source: ABS, CoreLogic, Dexus Research
these markets well-placed to handle any moderation
in occupier demand. Similarly, the pipeline of
industrial supply is limited and demand will remain
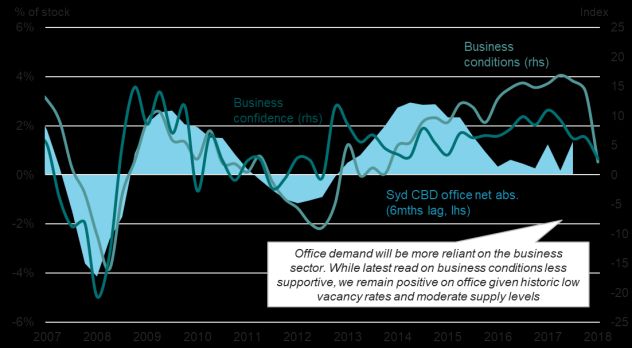
supported by ongoing e-commerce and supply chain Figure 4. Sydney office demand vs business
management trends which are less dependent on the conditions and confidence
economic cycle.
2. Householders holding back
Our base case view assumes house prices will fall
nationally by 15%-20% (peak-to-trough) and building
activity by 23%, bottoming in FY20. It’s important to
remember that housing markets are cyclical and
subject to regular slowdowns. In addition, in the long
run a correction will help to rebalance the economy
in relation to affordability and household debt. The
key is to manage the transition. Residential exposed
Source: JLL Research, NAB, Dexus Research
A-REITs are likely to underperform, while a weaker
consumption outlook will keep the pressure on the
retail sector. Sectors such as office, industrial and
healthcare will tend to outperform under these Figure 5. Sydney CBD office cap rates vs interest
conditions. However, there is a risk that over time, yields
consumption growth and a negative news cycle
takes its toll on business investment.
3. Lower for longer interest rate outlook
A slower growth scenario without inflation pressure
will keep downward pressure on Australian interest
rates and bond yields. With US rates appearing close
to peaking, the risk of importing higher lending rates
is moderating. We’re factoring in the possibility of two
more rate cuts by the RBA, bringing the cash rate
down to 1.0% by FY20, and for Australian 10-year
Source: RBA, Bloomberg, JLL Research, Dexus Research
bond yields to drift down towards 2.0% (a big
turnaround from last year’s outlook). A steady cost of
capital and low interest rate outlook will keep
property yields looking relatively attractive and
continue to support investment demand for direct
and listed property in 2019.
Australian Real Estate Quarterly Review | Q1 2019 Page 4 of 13
Transactions

A record year for investment activity                    Figure 6. Transaction volumes by sector
Transaction volumes in 2018 were the highest on
record, reaching a total of $31.4bn. Activity was
driven by an increasing amount of Merger &
Acquisition activity, confidence in Australia’s main
office markets and portfolio restructuring within the
retail sector.
Oxford Property Group, a subsidiary of OMERS (one
of Canada’s largest pension plans), acquired Investa
Office Fund’s $3.4bn portfolio in December.
                                                         Source: JLL Research, Dexus Research Transaction Database
The IOF acquisition reflects the weight of foreign
capital seeking exposure to Australian commercial
real estate. Foreign investment volumes accounted        Figure 7. Average prime yield by sector
for nearly 50% of volumes in Q4, being one of the
largest on record. These transactions indicate that
foreign investors continue to value Australian real
estate even at lower yields due to its relative value
compared to global markets, sound supply/demand
fundamentals and the underlying growth drivers of
population growth and infrastructure investment.
It is likely investment demand will remain strong in
2019. As we move forward into a period of global
uncertainty, Australia’s political and economic
stability and the defensive nature of property
investments will remain key strengths.                   Source: JLL Research, Dexus Research
Yields (Figure 7) have remained flat over the past six
months at 4.75% for office, whilst industrial saw 50     Table 2. Q4 2018 top transactions
basis points of compression to 5.25%. The spread of
industrial yields over office is now at the narrowest    Price    Asset/portfolio                 Buyer
level on record, reflective of both a long running       ($m)
structural decline in industrial risk premiums and the   3350     Investa Office Fund             Oxford Properties
current positive sentiment towards the sector and its    804      10 & 12 Shelley Street          Charter Hall
growth prospects.                                        646      Hine Global REIT                Centuria Metropolitan
                                                                                                  REIT (50%) / Lederer
Pricing is a trend to watch for retail. Valuation                                                 Group (50%)
evidence from some of the major players indicates        573      Vicinity to SCA Portfolio       SCA
that there has been expansion of cap rates on lower      420      Metcentre                       Blackstone
quality retail centres. Shopping Centre Australia’s      275      61 Mary Street                  Charter Hall Core
(SCA’s) acquisition of Vicinity’s portfolio for $573m                                             Plus Office Fund
reflected a 5.1% discount to book values - implying a                                             (CPOF)
35 basis point cap rate expansion. Vicinity              250      100 Skyring                     Growthpoint
announced a small $37m revaluation loss on its                                                    Properties
portfolio, comprising a 4 to 15 basis point cap rate     182      Burwood One                     Undisclosed
expansion on its regional, sub-regional and              180      183-185 Clarence Street         TH Real Estate
neighbourhood centres offset by valuation gains on
                                                         Source: Dexus Research Transaction Database, JLL Research
its city retail and outlet centres. The transaction
market for poorer centres is likely to remain weak in
the year ahead as investors reposition portfolios.

Australian Real Estate Quarterly Review | Q1 2019                                                          Page 5 of 13
Performance

Rise of the defensives                                    Figure 8. Total returns: A-REITs vs ASX200
In a surprising turn of events, A-REITs made a last-
minute comeback in the December quarter to
outperform the broader Australian equity market in
2018 by +5.8% (Figure 8). Over the quarter, A-REIT
pricing benefitted from declining bond yields and
investors moving back into defensives on the back of
heightened market volatility and a more cautious
macro backdrop.
Performance in the direct property market remains
robust with strong investor demand, especially for
Sydney, Melbourne office and industrial assets. This
                                                          Source: IRESS, Dexus Research
saw direct property +11.1% (PCA/MSCI Index, Sep-
18) and unlisted property funds +10.3%
                                                          Figure 9. IPD Wholesale funds index returns
(MSCI/Mercer Index, Dec-18) lead listed property
returns +2.9% over the year.
Sector returns continued to diverge across both
listed and direct property markets. The residential
and retail sectors lagged as fundamentals have
deteriorated, while Sydney/Melbourne office (robust
rental growth) and industrial (e-commerce trade)
have outperformed. This is most evident in the latest
MSCI/Mercer Wholesale Funds Index results, which
clearly shows an increasing divergence between
sectors (Figure 9). While industrial and office returns
have been helped by rental growth, retail returns are
being affected by weaker income growth, rising            Source: Mercer/IPD (NAV Pre-Fee), Dexus Research
incentives/capex and write downs in values of poorer
assets.                                                   Table 3. Index returns to 31 December 2018

Our key predictions for 2019 include:                                       Qtr.%         1 yr       3 yr
                                                                                         %p.a.      %p.a.
▪   Defensive investments will be on trend due to         Unlisted              2.4        10.3        11.8      MSCI Mercer
    continued uncertainty                                 property*                                              Aust. Unlisted
                                                                                                                 Wholesale PFI*
▪   A-REITs to outperform equities as Australian          Australian            2.2         4.5         3.7      BACM0 Index
    10-year bond yields drift down towards c2.0% and      fixed
    volatility continues to plague equity markets         interest
                                                          Australian            0.5          1.9        1.9      BAUBIL Index
▪   Direct property and unlisted property funds will
                                                          cash
    continue to outperform, but returns will move into
                                                          A-REITs              -1.9         2.9         7.2      S&P/ASX 200
    single digits as capital growth starts to wane                                                               A-REIT
                                                                                                                 Accumulation
▪   Industrial sector to outperform (boosted by cap
                                                                                                                 Index
    rate compression and rising rents), followed by
                                                          Australian           -8.2        -2.8         6.7      S&P/ASX 200
    office.                                               shares                                                 Accumulation
▪   Retail is likely to underperform the other sectors                                                           Index
    at an index level, however, aggregate numbers         The indices are copyrighted by and proprietary to the relevant Source issuers:
                                                          MSCI Mercer Aust. Core Wholesale Monthly PFI; Standard and Poor’s
    will hide a growing divergence between better         Australian Securities Exchange Accumulation Index; Bloomberg/UBS
    and poorer quality centres                            Composite and Bank Bill Indices. *NAV Pre-Fee

Australian Real Estate Quarterly Review | Q1 2019                                                                Page 6 of 13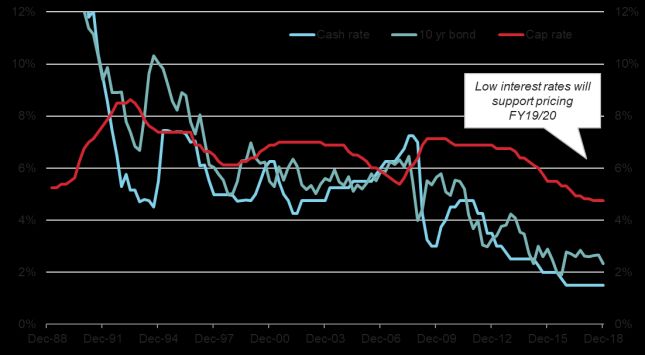
Office markets

Core CBD markets well positioned                           Figure 10. Quarterly net absorption by market
Office markets continue to enjoy positive leasing          ‘000sqm                    Syd CBD     Melb CBD     Bris CBD      Perth CBD
conditions on the back of solid employment growth          150
nationally (Figure 10). Looking forward we expect
positive absorption to continue, however we have           100

tempered our view, noting that business confidence
                                                            50
has moderated in response to risks around the
Australian and global economic outlook.                      0

Australia’s main office markets are well-positioned
                                                            -50
however these risks play out. Vacancy rates
tightened during 2018 (Figure 11) and in most              -100
markets short-term supply is at modest levels with
solid levels of pre-commitment.                            -150
                                                              Dec-08      Dec-10      Dec-12       Dec-14          Dec-16        Dec-18
The vacancy rate of 4.1% in Sydney CBD is the
                                                           Source: JLL Research, Dexus Research
lowest it has been in 18 years and very little supply is
due to be added in FY20. Sydney is experiencing an         Figure 11. Vacancy by market
extended cycle with planned projects spread out over
the period FY21-24. Anecdotal evidence is that a lack                   Syd CBD        Melb CBD        Bris CBD             Perth CBD
of available space is causing companies to squeeze         30%
into their existing accommodation, creating pent-up
demand.                                                    25%

The vacancy rate in Melbourne CBD of 3.7% is at a          20%
10-year low and demand for office space is
benefitting from the strongest population growth in        15%

the country. The significant amount of supply
                                                           10%
currently under construction for FY20 delivery is
likely to lead to a rise in vacancy, however the effect     5%
on the market will be muted by the low starting
vacancy rate, the positive 167,000sqm of absorption         0%
                                                              Dec-08      Dec-10      Dec-12       Dec-14          Dec-16        Dec-18
in the year just gone and an 81% pre-commitment
level.                                                     Source: JLL Research, Dexus Research

Brisbane and Perth ended 2018 on a strong note             Table 4. Q4 2018 office snapshot
recording falling vacancy rates on the back of broad-
based service sector growth. A flight to quality has                               Vacancy         Prime net           Prime net
                                                                                        %         face rental          eff. rental
lead to prime vacancy in Perth and Brisbane falling                                                   growth              growth
well below total vacancy - to 16.0% and 7.2%                                                           % p.a.              % p.a.
respectively. In both markets planned supply in            Parramatta                3.9%               8.4%                  13.1%
FY20-22 is below average.                                  Macquarie Park             7.0%              5.0%                  8.9%
The major CBD markets recorded solid effective rent        Melbourne CBD              3.7%              5.2%                  8.0%
growth over the past year (Table 4). We forecast           North Sydney              8.6%               4.4%                  6.8%
further growth in Sydney and Melbourne over the            Sydney CBD                 4.1%              6.4%                  6.4%
next year, however the rate of growth is tapering.         Perth CBD                 21.1%                  1.1%              4.3%
Perth and Brisbane have continued to improve               Adelaide CBD              13.7%              2.2%                  4.2%
mildly.                                                    Brisbane CBD              13.2%              2.4%                   3.7%
Centralisation of tenants, valuing the amenity of the      Canberra                  10.9%              0.4%                  -0.1%
CBD, remains a key theme in core markets.                  Source: JLL Research
Examples of moves back into the CBD from a fringe
or metro market location included IBM and Pfizer
(Sydney), Civil Aviation Safety Authority (Brisbane)
and P&N Bank (Perth).

Australian Real Estate Quarterly Review | Q1 2019                                                              Page 7 of 13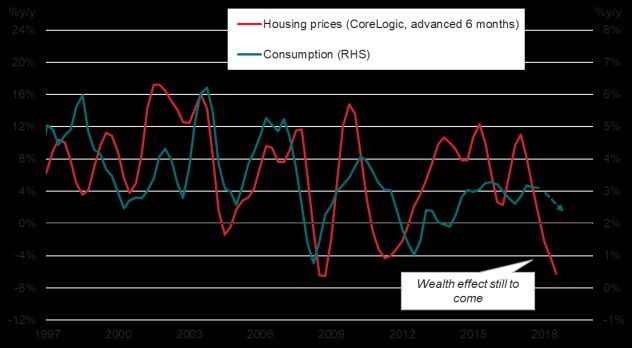
Office market wrap
Market Comments Direction of
trend for next
12 months
Sydney Approaching inflection point. Net absorption remained solid in Q4 with 36,926sqm recorded, Vacancy
ending a strong 2018, however demand indicators are showing signs of moderating. The market
is well-placed to weather uncertainty with the majority of new supply still not expected to hit until Rents
FY22-24. The vacancy rate reduced further in Q4 to 4.1% and is projected to fall further,
supporting rents in the year ahead. Incentives appear to be stabilising. Incentives
Yields
North Sydney Rent growth continues. The North Sydney office market recorded positive net effective rent Vacancy
growth of 2.4% for the quarter and 6.8% for the year, despite negative net absorption of
-19,990sqm in Q4 2018, due to some large moves out of the market. The vacancy rate increased Rents
to 8.6%. The outlook for demand is positive as the market benefits from a strong NSW economy
and overflow of demand from the Sydney CBD, which should help support a further uplift in Incentives
rental growth in the year ahead.
Yields
Macquarie Park Demand eases further. Demand slowed further in Macquarie Park in Q4, recording negative Vacancy
net absorption of -6,201sqm for Q4 2018. Stock withdrawals have kept the vacancy rate low at
around 7.0% and prime effective rents have improved with a fall in incentives along with Rents
increased face rents. Demand is projected to be mild, and with a relatively subdued supply
pipeline over FY19 there is likely to be some upward pressure on rents. Incentives
Yields
Parramatta Continues to outperform. The vacancy rate in Parramatta decreased further to 3.9% in Q4 Vacancy
2018 and there is limited supply risk in the short term. Rental growth has slowed but remains
strong up +13.1% p.a. (net effective) and incentives have reduced further for prime assets to Rents
below 17%. There is medium term supply risk due to backfill and mooted projects, however the
next stages of Parramatta Square are largely pre-committed from outside the market and new Incentives
projects will require pre-commitment. How Parramatta performs over the medium-term will
depend on its ability to attract tenants from outside the market. Yields
Melbourne Vacancy reaches historical low. Melbourne vacancy hit 3.7% in Q4 2018 following very strong Vacancy
net absorption in 2018 (almost +170,000sqm) despite new supply coming online. Additional
supply is due to complete over the coming years and as such, the vacancy rate is likely to Rents
increase in the medium-term, however the majority of new projects are pre-committed and
continued solid demand will support market conditions. Rental growth is strong with prime net Incentives
effective rents increasing by 8.0% over the year.
Yields
Brisbane Steady recovery. Net absorption remained positive at +7,389sqm in Q4 2018, largely supported Vacancy
by mid-sized occupiers. While the total vacancy rate reduced slightly to 13.2%, prime vacancy is
just 7.2%. Accordingly, prime net effective rent growth improved further (+3.7%p.a) as face rents Rents
increased. Demand is projected to improve steadily over the next year or two, particularly for
prime stock with a flight to quality. However, growth may be tempered by the three projects Incentives
under construction.
Yields
Perth The Perth market is expected to continue to recover aided by a three-year lull in supply Vacancy
from FY20-22. Perth recorded +16,628sqm of positive net absorption in Q4 2018. The vacancy
rate fell to 21.1% following a jump in Q3 due to backfill from Woodside's move to Capital Square. Rents
Prime vacancy is just 16% due to a flight to quality. Prime net effective rents have experienced
further growth (+4.3%p.a.). Rental growth is expected to improve with scope for incentives to Incentives
decline from current high levels.
Yields
Canberra Office demand improving. Canberra recorded positive net absorption of +16,833sqm in Q4 Vacancy
2018. The vacancy rate has declined to 10.9% as a result. Despite limited rent growth in the past
12 months the modest availability of prime space (prime vacancy is currently 6.2%) should help Rents
to support some mild rental growth in prime assets in the short term.
Incentives
Yields
Australian Real Estate Quarterly Review | Q1 2019 Page 8 of 13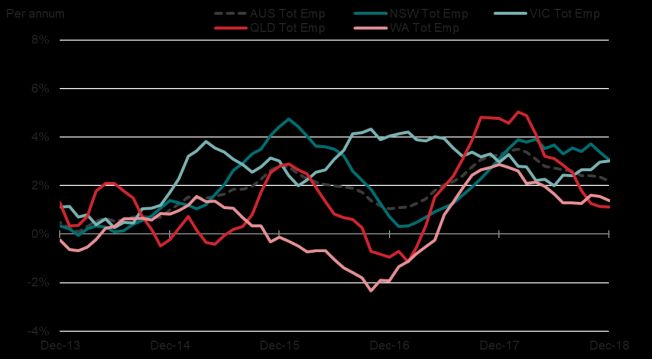
Industrial

In the midst of a strong growth phase                        Figure 12. Average existing prime industrial rents
The latest data supports our view that the industrial
sector is in the midst of a strong growth phase. While
demand may ease a little with the economic cycle, it
remains leveraged due to solid population growth
and infrastructure investment in Sydney and
Melbourne, supplemented by double digit growth in
e-commerce and continued supply chain investment.
Strong tenant demand and rising development costs
are putting upward pressure on rents in parts of
Sydney and Melbourne, especially in supply-
constrained (inner-city) markets (Figure 12, Table 5).
Further rental growth is expected over the next few
years, especially in Sydney and Melbourne markets,
helped by limited land supply and stock withdrawal           Source: JLL Research, Dexus Research

for alternative uses.
                                                             Figure 13. Average industrial land values (1ha)
Conditions in Brisbane are projected to continue to
improve over the short-term as the economy
rebounds and infrastructure investment improves,
while Perth is still feeling the pain with the latest data
suggesting rents have dropped -4.8% in Q4-2018.
This positive outlook for industrial is supporting
strong investor sentiment and heightened interest in
industrial assets. With limited buying opportunities,
yields have continued to compress across most
industrial markets, falling 25-50 basis points over the
past six months. Given the good rental growth
prospects for the sector and positive investment
demand, we expect yields to tighten further.
Key events this quarter:                                     Source: JLL Research, Dexus Research

▪   In an event which could be seen as symbolic of           Table 5. Q4 2018 industrial snapshot
    the e-commerce trend, Goodman Group overtook
    Scentre Group to become the largest most                                            Ave prime cap       Existing prime
                                                                                     rate change from       net face rental
    capitalised player in the Australian listed property                                      Q4 2017        growth % p.a.
    sector (24th Jan 2019)
                                                             Outer West Sydney                      -0.75                  3.3
▪   As evidence of the rising importance of                  Southern Brisbane                      -0.13                  4.3
    automation, Coles entered into agreements for            East Perth                             -0.37                  -4.8
    the development of two new automated                     South Sydney                           -0.87                  6.0
    distribution centres at Redbank in south-west            West Melbourne                         -0.50                  4.8
    Brisbane and Kemps Creek in western Sydney
                                                             Source: JLL Research, Dexus Research
    (24th Jan 2019)
▪   Dexus announced the establishment of the Dexus
    Australian Logistics Trust (DALT) in partnership
    with GIC seeded with $1.4bn of core logistics
    properties from the Dexus balance sheet and a
    further $138m of development land (30th Nov
    2018)

Australian Real Estate Quarterly Review | Q1 2019                                                           Page 9 of 13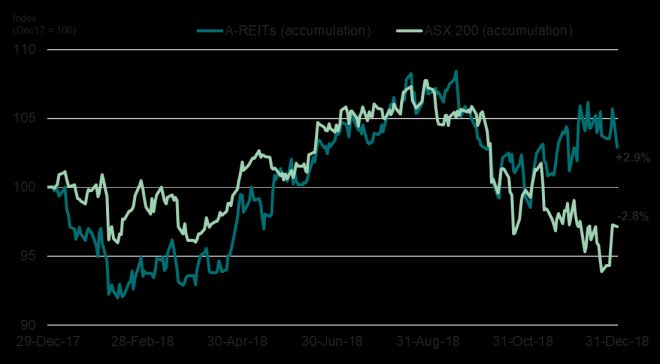
Industrial

Outer West Sydney                                          Figure 14. Outer West Sydney gross take-up
Demand remains robust in Outer West Sydney with
above average take-up of c389,900sqm recorded in
2018 – marking the strongest levels of take-up post
GFC. Positive economic conditions and rising
demand from e-commerce-related tenants are likely
to support demand in the medium to longer term.
Supply completions have been strong with
approximately 447,300sqm of stock added in 2018,
nearly double the 10 year average of 262,900sqm.
Current projections suggest supply has peaked and
should trend down over 2019.
Rental growth is likely to remain positive in the short-
term with demand expected to outpace supply.               Source: JLL Research (gross take-up), Dexus Research.

The largest lease deal in Q4 2018 was a pre-lease to
Snacks Brands Australia (30,255sqm) at Erskine             Figure 15. West Melbourne gross take-up
Park.
West Melbourne
Take-up rates in West Melbourne picked up in Q4
2018 with approximately 60,300sqm recorded.
Demand is projected to improve as population
growth continues and key infrastructure projects
such as the West Tunnel project add further support
to economic conditions.
There is a relatively limited amount of land that is
currently zoned and serviced in West Melbourne,
and as a result, there has been upward pressure on
rents, up 4.8% over the last six months (JLL
Research).                                                 Source: JLL Research (gross take-up), Dexus Research.

The outlook is for continued rental growth in the short    Figure 16. South Brisbane and ATC gross take-up
term as below average levels of supply is projected
over the next 1-2 years.
The largest lease deal in Q4 2018 was by Arrow
Logistics (29,000sqm) in Altona.
Brisbane
Take-up in Brisbane increased further in Q4 2018,
with approximately 97,700sqm recorded. Improved
economic conditions including employment growth
and infrastructure investment points to a more
positive outlook in the year ahead after several years
of weakness.
Supply completions in 2018 were manageable and
well below the long term average of 280,000sqm,            Source: JLL Research (gross take-up), Dexus Research.
with approximately 207,000sqm added to stock,
providing scope for some upward pressure on rents.

Australian Real Estate Quarterly Review | Q1 2019                                                            Page 10 of 13
Retail

Conditions to remain subdued in 2019                      Figure 17. Retail sales growth vs house prices
The outlook for the retail sector remains challenging.     %p.a.
                                                                         Turnover YoY            Dwelling Price Growth YoY (RHS)
On the positive side, employment growth is above          14%                                                                          30%

2%, the unemployment rate is low at around 5% and                                                                                      25%
                                                          12%
mortgage rates, despite inching up, are relatively
                                                                                                                                       20%
stable. Turnover growth is on a firming trend.            10%
                                                                                                                                       15%
On the negative side, consumer confidence has              8%
                                                                                                                                       10%
eased and the slowing housing market is likely to          6%
dampen consumer spending over the next 18 months                                                                                       5%

(see Figure 17).                                           4%
                                                                                                                                       0%

Turnover growth improved slightly in the second half       2%                                                                          -5%

of 2018, increasing by 0.4% in the month of                0%                                                                           -10%
November 2018 based on ABS data, which was                  Nov-98      Nov-02          Nov-06        Nov-10        Nov-14         Nov-18

slightly above market expectations (and likely            Source: ABS, CoreLogic, Dexus Research
reflected impacts from online events such as Click
Frenzy and Black Friday). The annual pace is now
tracking at 2.8% year-on-year.                            Figure 18. Online retail sales growth

By industry, apparel and household goods had a             $bn
                                                                               NAB Online Retail Sales
                                                                                                                                     %p.a.
strong month while pharmaceuticals, cosmetics and          35
                                                                               NAB Online Retail Trade Growth Rate (RHS)
                                                                                                                                       30%
food categories continued to perform well.
                                                           30                                                                          25%
Supermarkets still lead other anchor tenants and we
expect non-discretionary categories to perform better      25                                                                          20%

than discretionary in the months ahead.                    20                                                                          15%

Online retail sales continue to increase with growth of
                                                           15                                                                          10%
10.7%p.a. to November and comprising a share
around 9.0% of spending at traditional bricks and          10                                                                          5%

mortar retailers (NAB Online Retail Sales Index
                                                            5                                                                         0%
November 2018).                                             Nov-12    Nov-13     Nov-14      Nov-15      Nov-16      Nov-17      Nov-18

The outlook is for specialty rent growth to remain        Source: NAB Online Retail Sales Index, Dexus Research
subdued in the short to medium term. After a period
of negative re-leasing spreads, occupancy cost ratios     Table 6. Q4 2018 retail snapshot
are now declining, indicating that rents are steadily
                                                                                     Specialty            Cap rate           State retail
re-basing and becoming more affordable for retailers.                                   rental             change                  sales
Key events this quarter include:                                                       growth             from Q4                growth
                                                                                        % p.a.               2017                 % p.a.
▪   Coles pushed further into convenience,                Sydney                                                                       2.9
    announcing a trial partnership with Uber Eats to      Regional                           0.17              -0.25
    deliver ‘ready to eat’ range of products              Sub-regional                       0.68                 0.25
▪   Ed Harry has been placed into administration          Neighbourhood                      0.93                 0.00
    while Crabtree & Evelyn have announced they           Melbourne                                                                    5.2
    will wind down the Australian business with only      Regional                           0.71              -0.38
    an online presence
                                                          Sub-regional                       0.38                 0.00
▪   Coles and Woolworths have both recently rolled        Neighbourhood                      1.20                 -0.13
    out smaller, high-end concept stores, offering
                                                          SE QLD                                                                       2.0
    organic ‘market’ style offerings at Coles Local in
                                                          Regional                           0.18                 -0.13
    Surrey Hills (VIC) and Woolworths with ‘The
    Kitchen’ at Double Bay (NSW).                         Sub-regional                      -0.23                 0.00
                                                          Neighbourhood                      0.39                 0.38
                                                          Source: JLL Research, ABS, Dexus Research

Australian Real Estate Quarterly Review | Q1 2019                                                                 Page 11 of 13
Dexus Research Peter Studley Kimberley Slow Head of Research Research Manager d: +61 2 9017 1345 d: +61 2 9080 1572 e: peter.studley@dexus.com e: kimberley.slow @dexus.com Lee Cikuts Karl Sarich Research Manager Research Associate d: +61 2 9017 1268 d: +61 2 9017 1299 e: lee.cikuts@dexus.com e: karl.sarich@dexus.com IMAGE CAPTION Australian Real Estate Quarterly Review | Q1 2019 Page 12 of 13
Disclaimer
This report makes reference to historical property data
sourced from JLL Research (unless otherwise stated),
current as at ‘Q4/2018’. JLL accepts no liability for
damages suffered by any party resulting from their use
of this document. All analysis and views of future
market conditions are solely those of Dexus.
Issued by Dexus Funds Management Limited ABN 24
060 920 783, Australian Financial Services Licence
holder. This is not an offer of securities or financial
product advice. The repayment and performance of an
investment is not guaranteed by Dexus Funds
Management Limited, any of its related bodies
corporate or any other person or organisation. This
document is provided in good faith and is not intended
to create any legal liability on the part of Dexus Funds
Management Limited.
This economic and property analysis is for information
only and Dexus Funds Management Limited
specifically disclaims any responsibility for any use of
the information contained by any third party. Opinions
expressed are our present opinions only, reflecting
prevailing market conditions, and are subject to
change. In preparing this publication, we have obtained
information from sources we believe to be reliable, but
do not offer any guarantees as to its accuracy or
completeness. This publication is only intended for the
information of professional, business or experienced
investors.

                                                                                         dexus.com

                                                                                   Responsible Entity
                                                                   Dexus Funds Management Limited
                                                                                   ABN 47 006 036 442
                                                           Australian Financial Services Licence Holder
                                                                              (Licence Number 238166)
                                                                                     Registered Office
                                                                           Level 25, 264 George Street
                                                                                    Sydney NSW 2000
                                                                                              Australia
                                                                                        PO Box R1822
                                                                            Royal Exchange NSW 1225
                                                                                              Australia
You can also read