Australian Real Estate Quarterly Review - Q2 2020 - Dexus
←
→
Page content transcription
If your browser does not render page correctly, please read the page content below
Australian
Real Estate
Quarterly
Review
Q2 2020
Australian Real Estate Quarterly Review | Q2 2020 Page 1 of
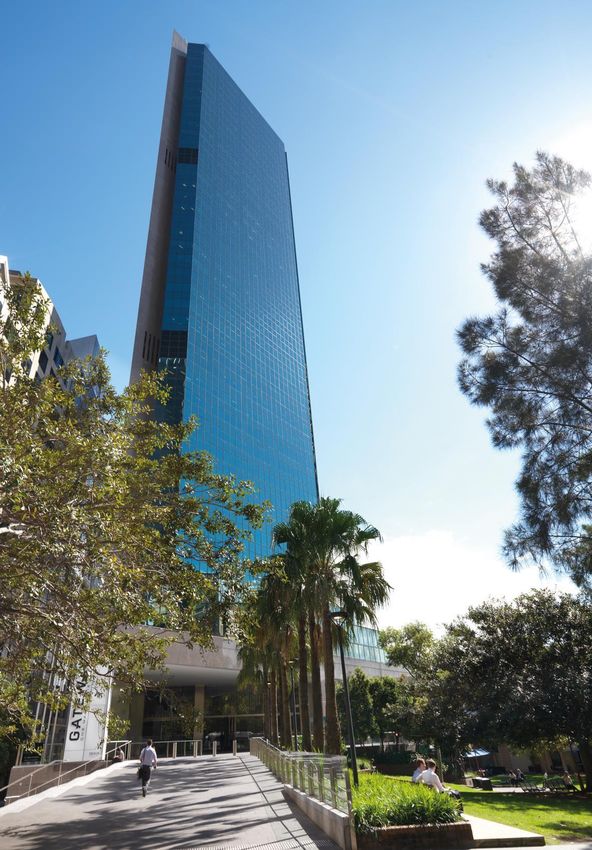
12 Gateway, Sydney, owned by Dexus Wholesale Property Fund.
Inside

   Page 03                 Investment climate

   Page 04                 Transactions

   Page 05                 Performance

   Page 06                 Office

   Page 07                 Office market wrap

   Page 08                 Industrial

   Page 09                 Industrial by region

   Page 10                 Retail

   Page 11                 Dexus Research

Australian Real Estate Quarterly Review | Q2 2020   Page 2 of 12

Investment climate

Global and Australian slowdown likely                                Figure 1: Australian GDP growth is forecast to slow over the
                                                                     next quarter or two, improving in 2021
The COVID-19 crisis has generated significant
uncertainty in relation to the economic outlook. As in                % per annum

other countries around the world, Australian economic                  6%
growth is expected to slow with Deloitte forecasting a -
5.2% contraction in GDP growth in 2020. However, the                   4%

unprecedented nature of this event makes it hard to                    2%
accurately predict the depth of the downturn and the
timing of recovery.                                                    0%

The eventual rate of recovery will depend on infection                -2%
rates and the speed with which social distancing
measures and travel controls are relaxed. Infection                   -4%

rates now appear to be declining in Australia and many                -6%
economists predict a recovery in growth in Q4 2020.                         1989 1992 1995 1998 2001 2004 2007 2010 2013 2016 2019 2022 2025

Much will depend on the extent to which business
closures and rising unemployment hinder confidence                   Source: DAE

and consumption.
The outlook is improved by sizable fiscal stimulus                   Figure 2: Stimulus measures globally have been substantially
packages amounting to 16.4% of GDP, designed to help                 higher than in previous crises
businesses and workers. A reduction in the official cash
rate to a record low of 0.25% by the Reserve Bank of
Australia and an easing in the Australian dollar will
provide further stimulus. Australia’s ongoing
infrastructure pipeline should also assist the growth
outlook.
Real estate occupier markets are likely to feel the
impacts of social distancing measures. A month into the
crisis, an ABS survey shows that two-thirds of
Australian businesses are experiencing reduced
turnover. Small to medium businesses have been the
hardest hit, with 41% of businesses with 20-199
employees temporarily reducing staff work hours.
                                                                     Source: Reuters; Bloomberg; Dexus Research; *Calculated in USD at year end: 2008
The outlook varies significantly between industries.                 for GFC and 2019 for Covid-19; Fiscal Stimulus as at 30/03/20
Business stress is estimated to be highest in the
socially interactive industries like retail trade, tourism
and education. However, the outlook is significantly                 Figure 3: Business stress is not spread evenly, with some large
brighter for some other large industries such as                     industries able to recover more quickly than others
professional services, mining, logistics and
IT/telecommunications.

Table 1: Australian economic forecasts: Q1 2020
                                 Jun-20        Jun-21       Jun-22
Aus GDP (QoQ %)                   -4.9%         1.8%         0.7%
Aus GDP (YoY %)                   -3.7%        -0.7%          4.1%
Emp Gth (YoY %)                   -6.4%        -0.3%         5.6%
Unemployment (%)                  12.2%         8.1%         6.7%
Exports (YoY %)                   -1.7%         1.0%         0.3%
Imports (YoY %)                   1.5%         -0.3%         -0.4%
90 Day Rate (%)                   0.3%          0.0%         0.4%
10yr Bond (%)                     0.5%          0.5%         0.7%
                                                                     Source: ABS; Dexus Research
Source: Deloitte Access Economics base, Dexus adjusted forecasts

Australian Real Estate Quarterly Review | Q2 2020                                                                          Page 3 of 12
Transactions
Transaction data yet to show an impact Figure 4: Transactions volumes in Q1 2020 were similar
to levels for the same period last year
Transaction volumes and cap rate data for Q1 2020
are unlikely to reflect much impact of the COVID-19
crisis. Social distancing and mobility restrictions Office Industrial Retail
40
imposed in March slowed the rate of property
inspections and anecdotally led to some withdrawal 35
from and renegotiation of deals. However, with most 30 8.6 8.1
6.3
deals already exchanged, any slowing of transaction 25
7.3 7.4
8.9
5.2
volumes will manifest in Q2 2020.
5.3
6.7
20 7.4 5.0 5.8
7.1
Transaction volumes across all sectors were down
6.4
15 4.4 3.7
on Q4 2019, but about the same as the same quarter
2.6 22.5
10 4.4 4.4 3.4 19.9
17.7 17.9 16.4
1.9 2.0 14.7
last year. 5 7.9
1.8
1.3
2.3
1.6 10.3
12.9
6.4 6.7 0.6
0.5
3.6 3.9 2.4
Industrial volumes were similar to Q1 2019 levels as a 0
2007 2008 2009 2010 2011 2012 2013 2014 2015 2016 2017 2018 2019 Q1
result of continued strong foreign demand and 2020
onshore private buyers competing for stock. For Source: JLL Research, Dexus Research Transaction Database
example, a domestic private buyer purchased the
vacant possession of a 40,000sqm distribution facility
in West Melbourne for $55m.
Figure 5: Levels of foreign investment continued to run
Retail transaction volumes were up mildly on Q1 2019 solidly in early 2020
levels, with private domestic buyers the most active,
capitalising on softening yields. A private investor Domestic Foreign Unknown Foreign %
acquired sub-regional asset Armadale Shopping City 40 50%
for $110m. 35 45%
40%
Office transaction volumes were down 18% on the 30
35%
same quarter last year. Foreign interest has been 25 30%
relatively strong with Deka Immobilien acquiring 20 25%
Central Plaza Two in the Brisbane CBD for $380m at 15 20%
a tight equivalent yield of 5.13%. 10
15%
10%
Cap rates in the Sydney office and central west 5 5%
industrial sectors flattened in Q1 2020 after rapid 0 0%
compression over the past year. They remain at 2007 2008 2009 2010 2011 2012 2013 2014 2015 2016 2017 2018 2019 Q1
2020
historic lows of 4.88% and 4.50% respectively.
Source: JLL Research, Dexus Research
According to JLL research, Sydney regional cap
rates remained stable in the quarter with a rise in
Sydney sub-regional assets by 25bps. Figure 6: Office and industrial yields flatten, with retail
Table 2: Top transactions of Q1 2020 rising
Sydney CBD office
Price Asset/portfolio Buyer
($m) Sydney Central West industrial
%
Sydney Regional retail
440 Chevron HQ. Invesco 9%
380 Central Plaza Two Deka Immobilien
328 200 Victoria Parade ARA Asset 8%
Management/Quad-
Real Property Group
7%
270 59 Goulburn Street Poly Group
160 100 Walker Street Pro-invest Group
6%
120 Tower 1, 475 Victoria Avenue BlackRock
114 20 Berry Street Holdmark Property 4.9%
5%
Group 4.8%
4.5%
110 Armadale Shopping City Nick DiMauro 4%
102 East Sydney Private Hospital Centennial Property Mar-10 Mar-12 Mar-14 Mar-16 Mar-18 Mar-20
Group
Source: Dexus Research Transaction Database, JLL Source: JLL Research, Dexus Research
Australian Real Estate Quarterly Review | Q2 2020 Page 4 of 12Performance
Flight to defensive assets and cash Figure 7: Uncertainty weighs on A-REIT pricing relative to
bond pricing
Fixed interest investments, unlisted property and
cash lead the performance table this quarter as ASX 200 A-REIT Index (LHS) 10 year bond rate (RHS)-inverted
investors adopted a more cautious stance. 1,800 0.50%
1,700 1.00%
After a solid run over the past five years the
ASX200 A-REIT index turned down in March 2020 1,600 1.50%
with a 39% decline in price as uncertainty about the 1,500 2.00%
impact of COVID-19 on tenancies and real estate 1,400 2.50%
markets weighed negatively on sentiment. Within 1,300 3.00%
the A-REIT sector, growth over the past five years 1,200 3.50%
was driven by the office and industrial sectors with 1,100 4.00%
retail A-REITs underperforming on the back of
1,000 4.50%
challenging retail trading conditions. 01-Mar-14 01-Mar-15 01-Mar-16 01-Mar-17 01-Mar-18 01-Mar-19 01-Mar-20
The 11-year bull market for 10 year bonds has Source: IRESS, Dexus Research
continued, with falls in the official cash rate and
quantitative easing contributing to a low bond yield
of 0.76%. A divergence in the traditional Figure 8: Returns remain positive for industrial A-REITs
relationship between A-REIT pricing and bond
yields may indicate a degree of upside to A-REIT Diversified A-REIT Retail A-REIT Office A-REIT Industrial A-REIT
pricing once conditions improve. 100 index =Feb 15
240
Unlisted returns were driven by the office 220
200
(+11.7%pa) and industrial sectors (+12.5%pa). 180
Industrial and office returns have been supported 160
140
by capital growth generated by tightening yields 120
and income growth. Retail funds continue to feel 100
80
the squeeze on values of lower quality assets. 60
Looking forward, the outlook for capital growth will 40
be more subdued due to COVID-19 related risks on 20
01-Mar-15 01-Mar-16 01-Mar-17 01-Mar-18 01-Mar-19 01-Mar-20
the income side.
Source: UBS,Dexus Research
Table 3. Index returns to February 2020 Figure 9: Listed office and industrial remain stable
Qtr.% 1 yr 3 yr % return Office Retail Industrial Diversified
%p.a. %p.a. 20
Australian +3.0% +6.8% +5.7% BACM0.Index
15
12.46%
fixed
interest 10
11.74%
Unlisted +0.7% +6.2% 9.8% MSCI.Mercer.Aust.
7.05%
Unlisted
property Wholesale* 5
Australian +0.3% +1.2% +1.7% BAUBIL.Index 0
-1.07%
cash
Australian -23.1% -14.4% -0.6% S&P/ASX.200. -5
Feb-14 Feb-16 Feb-18 Feb-20
Accumulation Index
shares
A-REITS -34.4% -31.7% -5.1% S&P/ASX.200.A- Source: Mercer/IPD (NAV pre-Fee), Dexus Research
REIT.
Accumulation Index
The indices are copyrighted by and proprietary to the relevant Source
issuers: MSCI Mercer Aust. Core Wholesale Monthly PFI; Standard
and Poor’s Australian Securities Exchange Accumulation Index;
Bloomberg/UBS Composite and Bank Bill Indices.
*NAV Pre-Fee
Australian Real Estate Quarterly Review | Q2 2020 Page 5 of 12Office
Indicators point to a more subdued outlook Figure 10. Business and consumer confidence fell
sharply in March 2020
Lead indicators point to a period of uncertainty in the
office markets across Australia, with demand across
the major CBD markets likely to be patchy in the
short term. Business confidence fell to a record low
in March. Similarly, growth in white collar job
advertisements fell 8.2% nationally as falls on the
East Coast more than offset gains in Perth, Canberra
and Adelaide.
Office leasing enquiry levels have fallen and
inspection rates have slowed as businesses exercise
greater caution in decision making, particularly for
small and medium enterprises (SMEs). If sustained,
these trends will likely translate to more subdued
demand from Q2 2020.
Source: JLL Research, Dexus Research.
Sydney CBD and Melbourne CBD recorded below
average net absorption in Q1 2020 at -59,800sqm
and -8,200sqm respectively. In Sydney CBD, much Figure 11. Vacancy rates edged higher in most markets
of the movement was expected given planned other than Melbourne
consolidation and decentralisation by NSW
Government departments.
Vacancy rates edged up in most office markets
nationally in Q1 2020 with the exception of
Melbourne CBD, where the total vacancy rate
remained unchanged at just 3.4%. With below
average vacancy rates, the Sydney and Melbourne
office markets are well placed to weather a period of
slower demand.
Positively for the office sector, businesses in
Professional & Technical Services industry
(traditionally a prominent occupier of office space)
were the least likely to have been directly affected by
Source: JLL Research, Dexus Research
COVID-19, with only 21% reporting negative impacts
as a result of the virus according to a recent survey
by the ABS. Figure 12. Office yields relatively stable in March with a
mild compression for Perth
Table 4. Q1 2020 office snapshot
Prime net Net Prime net eff.
Vacancy eff. rent Increase rent growth
% p.a.
% growth % of stock
% p.a. to FY22*
Sydney CBD 5.8% 1.2% 3.5% 6.2%
North Sydney 8.5% 6.0% 9.0% 7.7%
Sydney Fringe 7.0% -3.4% - 1.4%
Macquarie Park 8.3% 5.7% 17.6% 3.5%
Parramatta 4.1% 6.1% 20.5% 9.8%
SOP / Rhodes 18.7% 3.2% - 10.1%
Melbourne CBD 3.4% 8.7% 8.7% 1.2%
Brisbane CBD 12.1% 6.0% 7.6% 0.5%
Perth CBD 19.5% 2.9% -0.5%
Source: JLL Research, Dexus Research
Source: JLL Research; *Projects under construction and plans approved
Australian Real Estate Quarterly Review | Q2 2020 Page 6 of 12Office market wrap
Market Direction of
Comments trend for next
12 months
Sydney Easing tenant enquiries and further decentralisation weighs on net absorption. Vacancy rates Vacancy
rose 2.1% over the 12 months to March 2020 to 5.8%, though well below the 20-year average of 7.8%.
Annual net absorption was recorded at -118,800sqm, which was largely due to relocations outside of Rents
the CBD and consolidation of space. The Sydney CBD recorded a 1.7% increase in net face rents in
the March quarter, bringing the annual growth rate to 4.9%. Yields remained stable in Q1-2020 due to Incentives
a lack of office transactions and growing caution by investors.
Yields →
North Sydney Rental growth remained a feature of the market. After falling marginally last quarter, vacancy rates Vacancy
rose to 8.5%. Net absorption was recorded at 3,500sqm over the year to Q1 2020. Prime net face
rents increased by 4.1% over the same annual period, with effective growth more pronounced at 6.0%. Rents
Prime yields compressed further, with the sale of prominent North Sydney assets 100 Walker Street
and 20 Berry Street. Incentives
Yields →
Macquarie Park Annual net absorption in line with long-term trends. Total annual net absorption was largely as a Vacancy
result of Transport NSW moving from multiple locations around Sydney to Macquarie Park. The total
vacancy rate rose to 8.3%, as a result of the completion of The Glasshouse (45-61 Waterloo Road) Rents →
which was not fully pre-committed. Net face rents grew by 6.5% over the 12 months to Q1 2020,
though growth on an effective basis was more muted as a result of rising incentives. New supply in Incentives →
2020 will likely place further pressure on vacancy rates in Macquarie Park.
Yields →
Parramatta Annual face rental growth highest nationally. The total vacancy rate in Parramatta fell 1.3% in Q1 Vacancy
2020, due to the withdrawal of 11,000sqm of stock in the quarter. This helped to bring the secondary
vacancy rate down to 3.7% from 12.0% last quarter. The vacancy rate will likely fall further with Rents
withdrawals associated with infrastructure projects planned over 2020. Low vacancy and a level of
precommitment may help insulate the Parramatta market in the face of the COVID-19 crisis. Yields fell Incentives →
by 10 basis points in the March quarter to 5.5% after the 50% sale of the Octagon (110 George Street).
Yields
Melbourne Vacancy rates hold steady in Q1-20. The Melbourne CBD recorded net absorption of -8,200sqm in Vacancy
Q1 2020, with a number of tenants contracting. After strong rental growth during 2019, the first quarter
of 2020 saw rental growth plateau. Net face and effective rents grew by 0.9% and 0.5% respectively in Rents →
the quarter. Whilst much of the new supply has been largely pre-committed, backfill space will likely
put upward pressure on vacancy rates over the short term, particularly as tenant enquiries weakened Incentives
as a result of the COVID-19 crisis. Prime investment yields held steady in Q1 2020.
Yields →
Brisbane Contractions largely offset by expansions. Annual net absorption has been above the long-term Vacancy
average, with expansions by a number of firms in the IT & Telecommunications industry. The vacancy
rate increased 50 basis points in Q1 2020 to 12.1%. Despite elevated incentives, face rents recorded Rents →
growth of 2.8% in the quarter. The outlook for rent growth is benign in the Brisbane CBD office market,
with sticky incentives likely to be an ongoing feature of the market. Prime yields were flat at 5.6% in Q1 Incentives →
2020, although the sale of 66 Eagle Street represented the tightest equivalent yield recorded in the
Brisbane CBD market (5.13%). Yields →
Perth Government consolidation weighs on net absorption. Vacancy rates rose to 19.5% in Q1 2020 as a Vacancy
result of the WA Government consolidating its operations, vacating 11,000sqm of CBD space. In a sign
that the office market is continuing to recover, Perth CBD was one of only two office markets nationally Rents
to record growth in job advertisements for white-collar workers. With a muted supply pipeline, Perth is
in a reasonable position to weather the COVID-19 crisis with potential for rent growth in the short to Incentives
medium-term. Prime yields fell 30 basis points in Q1 2020, driven by Invesco’s acquisition of a 50%
stake in Brookfield’s Chevron HQ. Yields
Canberra Largest quarterly drop in vacancy rates nationally. Expansion by the ABS led to the largest net Vacancy →
absorption figure recorded in nearly two years. Expectations of increased requirements by the
Commonwealth of Australia in the short term, will likely flow through to additional office demand. Rents
Positive net absorption of 22,300sqm in Q1 2020 was also driven by a number of expansions by non-
government tenants. Incentives →
Australian Real Estate Quarterly Review | Q2 2020 Page 7 of 12Industrial
Market underpinned by essential spending Figure 9: Prime rents continue to grow mildly in the east
coast markets
Leasing activity was quite robust in the first quarter across
the eastern seaboard markets, however uncertainty about Outer West Sydney West Melbourne
South Brisbane East Perth
the short term economic outlook saw enquiry levels slow 140
sharply towards the end of March as businesses deferred 130
decision making. 120
Apart from Brisbane where demand was broad based in 110
the first quarter, leasing activity in the other major cities 100
were dominated by three main groups – transport and 90
logistics companies, online retailers, and physical retailers. 80
This activity pre-dated the COVID-19 crisis and reflected 70
structural changes in the supply chain and retail model
60
already underway before the lockdown.
50
While the outlook for demand is looking more subdued, Mar-10 Mar-12 Mar-14 Mar-16 Mar-18 Mar-20
there are pockets of strength, such as firms in the essential Source: JLL Research, Dexus Research
goods, pharmaceutical supplies, medical equipment and
online retail sectors which were all seeking additional
warehouse space at the end of March. Ecommerce sales Figure 10: Land value growth flat over the quarter with a
in non-discretionary categories also benefited. A sharp rise slight uptick in Outer West Sydney
in grocery sales caused by social distancing rules and Outer West Sydney West Melbourne
hoarding saw some of the supermarkets seeking 750
South Brisbane East Perth
temporary space in an environment where vacancies were
650
low after a buoyant three years.
550
Rent growth was recorded in some regions of Sydney, and
in Brisbane’s Trade Coast in Q1 2020. However, the lull in 450
enquiry points to pockets of weakness in rent ahead. There
350
have been reports of requests for rent relief under the
Commercial Tenancy Code of Conduct. 250
After significant falls in 2019, cap rates were stable this 150
quarter in line with the general uncertainty.
50
Mar-10 Mar-12 Mar-14 Mar-16 Mar-18 Mar-20
Industrial property markets are expected to be relatively
resilient given market vacancy is relatively low and the risk Source: JLL Research, Dexus Research
of over-supply will be mitigated by the responsiveness of
supply to adjusting levels of demand. The long- term
Figure 11: Industrial supply will rise across the Australian
growth drivers for the Australian industrial market remain
capital cities this year
intact with continued expansion in ecommerce and
infrastructure investment. ‘000 sqm
2,500
Table 5. Q1 2020 industrial snapshot 2,000
10yr average = 1,460,000 p.a.
Ave prime cap Existing prime
rate change from net face rental 1,500
Q4 2019 growth % p.a.
Outer West Sydney No change 3.1% 1,000
Southern Brisbane No change 2.1%
East Perth No change 0.0% 500
South Sydney No change 4.1%
West Melbourne No change 0.0% 0
2009 2010 2011 2012 2013 2014 2015 2016 2017 2018 2019 2020
Source: JLL Research, Dexus Research
Source: JLL Research, Dexus Research
Australian Real Estate Quarterly Review | Q2 2020 Page 8 of 12Industrial by region
Outer West Sydney Figure 12: Outer West Sydney gross take-up
Low vacancies and modest availability of serviced ‘000 sqm
land have been an issue in this region for a while, 450
limiting take-up and construction levels last year. 400
10yr average = 292,000sqm p.a.
Positively activity rose in the March quarter, JLL 350
Research reported over 60,000sqm of leasing and 300
pre-commitment activity, a rise of almost 50% on Q1 250
2019 activity levels. Activity was predominantly 200
being driven by online retailers, manufacturers and 150
transport companies, as well as the relocation of
100
tenants from inner city urban renewal areas.
50
The recent lift in demand caused rents to rise 0
around 2.5% in the quarter for both prime and Mar-10 Mar-12 Mar-14 Mar-16 Mar-18 Mar-20
secondary space according to JLL Research. Pre-
lease rents rose even more, up almost 4%. Source: JLL Research (gross take-up), Dexus Research.
As per the national trend, enquiries slowed sharply Figure 13: West Melbourne gross take-up
in March.
‘000 sqm
West Melbourne 700
This region has experienced above average take- 600
10yr average = 290,000sqm p.a.
up levels in the past 12 months, and continued the
trend in Q1 with almost 170,000sqm of leases and 500
pre-commitments recorded by JLL Research. 400
The lift in leasing activity has lessened the risk of 300
excessive vacancies caused by speculative
200
development, which at times were accounting for
almost half of the space under construction in 2019. 100
There is now almost 430,000sqm under
0
construction according to JLL, of which almost 80% Mar-10 Mar-12 Mar-14 Mar-16 Mar-18 Mar-20
is committed. The high supply in West Melbourne at
least partly compensates for below average supply Source: JLL Research (gross take-up), Dexus Research.
in the South East.
Brisbane Figure 14: South Brisbane and ATC gross take-up
The Australian Trade Coast (ATC) and South ‘000 sqm Southern Brisbane ATC
Brisbane recorded above average levels of tenant 600
demand in Q1 2020 despite a slow March. Demand 10yr average = 370,000sqm p.a.
was broad based and consistent with an improving 500
Queensland economy.
400
Looking forward however, there are signs of weaker
momentum ahead as all states cope with delays to 300
decision-making caused by the crisis. Construction
is strong with over 400,000sqm underway, but less 200
than half has been pre-leased. This suggests 100
vacancies may rise with some risk to rent growth.
0
The ATC saw rent and land value growth in Q1 Mar-10 Mar-12 Mar-14 Mar-16 Mar-18 Mar-20
2020 according to JLL Research, but the southern
Source: JLL Research (gross take-up), Dexus Research.
industrial areas have been stable.
Australian Real Estate Quarterly Review | Q2 2020 Page 9 of 12Retail
Retail sector faces significant adjustment Figure 19. Discretionary spending growth has been decelerating
since 2015 and will be further impacted by COVID-19
Retail turnover grew by 2.5% over the year to February
2020. ABS retail sales data paints a picture of steady food
and non-discretionary spending, but patchy discretionary
sales growth. This trend widened in March as consumer
behavior shifted as the COVID-19 took hold.
The retail sector is at the forefront of measures taken to
control COVID-19 in Australia with social isolation,
restrictions on non-essential retailing and reduced tourist
flows impacting trade. However, essential services retailers
like supermarkets, fresh food, medical services,
pharmacies and liquor are all experiencing strong sales
growth as people advance-buy. With their greater reliance
on discretionary spending, larger centres are being
impacted more than smaller convenience based centres.
Source: ABS, Dexus Research
Sales growth for discretionary categories has weakened
sharply over the past month. Foot traffic has declined
following government trading restrictions on discretionary Figure 20. National total retail spend index, by channel (retail
retailers. Positively, there are early signs consumers are wallet only) during the COVID-19 crisis – February/March 2020
getting bored in the home and are starting to increase their
discretionary spending online, with the major retailers
reporting significant online sales growth in early April.
A number of retailers are requesting rental assistance,
particularly in discretionary categories like apparel,
jewellery, cafes, restaurants, and non-essential services.
Longer term it is likely that the current situation will increase
the adoption of online retail. We note that majority of online
sales are by retailers that also have a physical presence.
There is a wide gap in capital return between the best and
worst centres as shown by the MSCI data in Figure 21.
Source: Quantium. Analysis based on electronic spend (not incl. cash or buy now pay
later), Week ending on date indicated. I.e. 03-Feb includes spending from 6 preceding
days. Dexus Research
Table 6. Q1 2020 retail snapshot
Specialty Cap rate State retail Figure 21. Widening spread in performance between the best
rent growth change from sales growth
% p.a. Q4 2019 % p.a.
and worst centres – capital return trends over the past year
Sydney 0.8
Regional -1.0 No change
Sub-regional -1.4 +0.25
Neighbourhood -1.1 No change
Melbourne 3.1
Regional -1.0 No change
Sub-regional -5.1 No change
Neighbourhood -0.9 No change
SE QLD 4.9
Regional -1.2 No change
Sub-regional -6.7 No change
Neighbourhood 0 No change
Source: MSCI, Dexus Research
Source: JLL Research, ABS, Dexus Research
Australian Real Estate Quarterly Review | Q2 2020 Page 10 of 12Dexus Research Peter Studley Shrabastee Mallik Head of Research Research Manager d: +61 2 9017 1345 d: +61 2 9017 1320 e: peter.studley@dexus.com e: shrabastee.mallik@dexus.com Matthew Persson Research Analyst d: +61 2 9080 4950 e: matthew.persson@dexus.com IMAGE CAPTION Australian Real Estate Quarterly Review | Q2 2020 Page 11 of 12
Disclaimer
This report makes reference to historical property data
sourced from JLL Research (unless otherwise stated),
current as at ‘Q1/2020’. JLL accepts no liability for
damages suffered by any party resulting from their use
of this document. All analysis and views of future
market conditions are solely those of Dexus.
This report was prepared during the disruption caused
by the outbreak of COVID-19 and the resultant
deterioration in business conditions. It is apparent that
there are implications from the outbreak for the global
and domestic economy, volatility in equity markets,
liquidity in credit markets and impact on the appetite for
and pricing of real estate assets which are uncertain
and unquantifiable at this time. This report should be
read and considered in light of that uncertainty.
Issued by Dexus Funds Management Limited ABN 24
060 920 783, Australian Financial Services Licence
holder. This is not an offer of securities or financial
product advice. The repayment and performance of an
investment is not guaranteed by Dexus Funds
Management Limited, any of its related bodies
corporate or any other person or organisation. This
document is provided in good faith and is not intended
to create any legal liability on the part of Dexus Funds
Management Limited.
This economic and property analysis is for information
only and Dexus Funds Management Limited
specifically disclaims any responsibility for any use of
the information contained by any third party. Opinions
expressed are our present opinions only, reflecting
prevailing market conditions, and are subject to
change. In preparing this publication, we have obtained
information from sources we believe to be reliable, but
do not offer any guarantees as to its accuracy or
completeness. This publication is only intended for the
information of professional, business or experienced
investors.

                                                                                           dexus.com

                                                                                     Responsible Entity
                                                                     Dexus Funds Management Limited
                                                                                     ABN 24 060 920 783
                                                             Australian Financial Services License Holder
                                                                                (License Number 238166)
                                                                                       Registered Office
                                                                             Level 25, 264 George Street
                                                                                      Sydney NSW 2000
                                                                                                Australia
                                                                                          PO Box R1822
                                                                              Royal Exchange NSW 1225
                                                                                                Australia
You can also read