Change in vaccine willingness in Australia: August 2020 to January 2021 ANU Centre for Social Research and Methods - ANU Centre for ...
←
→
Page content transcription
If your browser does not render page correctly, please read the page content below
Change in vaccine willingness – August 2020 to January 2021

Change in vaccine willingness in Australia:
     August 2020 to January 2021

       ANU Centre for Social Research and
                   Methods
Professor Nicholas Biddle1, Associate Professor Ben Edwards1, Professor Matthew Gray1, and
Kate Sollis1

   1 ANU Centre for Social Research and Methods

Australian National University

19th February 2021

                                                                                             i
The ANU Centre for Social Research and Methods
Change in vaccine willingness – August 2020 to January 2021
Acknowledgements
The authors would like to thank a number of people who were involved in the development of
the ANUpoll questionnaires, including Diane Herz, Dr Benjamin Phillips, Dr Paul Myers, Matilda
Page, Diana Nguyen, Anna Lethborg and Charles Dove from the Social Research Centre, and
Professor Ian McAllister from the ANU. Financial support for the ANU COVID-19 Impact
Monitoring Survey Program has been provided by the Australian Institute of Health and
Welfare. For this particular survey, the ANU received funding from the Minderoo Foundation,
for which we are particularly appreciative. We would also like to thank Dinith Marasinghe for
assistance with tables and figures.
Abstract
The ANU Centre for Social Research and Methods ANU COVID-19 Impact Monitoring Survey
Program asked the same group of respondents about their vaccine intentions in August 2020
and January 2021. The paper provides data on the vaccine willingness in Australia as of January
2021 and how this changed since August 2020 both at the national level and for particular
individuals. The paper provides estimates of how vaccine willingness has changed for different
population sub-groups and the individual level characteristics which are associated with
changes in vaccine willingness. We find an overall decrease in vaccine willingness, with the
biggest decline being those who would definitely get a vaccine as of August 2020 but said they
would only probably get a vaccine as of January 2021. We also look at the factors associated
with vaccine willingness, as well as the factors associated with change through time.
ii
The ANU Centre for Social Research and MethodsChange in vaccine willingness – August 2020 to January 2021
Executive summary
• The paper provides data on the vaccine willingness in Australia as of January 2021 and
how this changed since August 2020 both at the national level and for particular
individuals.
• There has been a substantial increase in vaccine resistance and hesitancy and a large
decline in vaccine likeliness between August 2020 and January 2021
o Combined, 21.7 per cent of Australians said they probably or definitely would
not get a safe and effective COVID-19 vaccine in January 2021, a significant and
substantial increase from the 12.7 per cent of Australians who gave the same
responses in August 2020.
• At the individual level, 31.9 per cent of Australians became less willing to get the
vaccine between August 2020 and January 2021 in that they moved from a more to a
less willing category.
o There were still some Australians who became more willing over the period to
get vaccinated (9.9 per cent).
• The largest single flow across willingness categories was the 18.7 per cent of Australians
who went from being definitely willing to get a COVID-19 vaccination to only probably
willing to get one. There was a large decline in vaccine certainty, alongside increases in
vaccine resistance.
• We found three attitudinal factors that were particularly important in explaining the
decline in willingness. Those Australians who think too much is being made of COVID-
19, those who have low confidence in hospitals and the health care system, and those
who are not optimistic about the next 12 months had all decreased in terms of their
willingness to get vaccinated once a vaccine is available.
o In addition to campaigns targeting vaccination directly, those programs that
improve confidence, remind people of the dangers of COVID-19, but
importantly highlight the potential for a much better 2022 all have the potential
to improve vaccination rates.
• Females, Indigenous Australians, those who speak a language other than English at
home and those who have not completed Year 12 have all became less willing to get a
vaccine since August 2020 compared to the rest of the Australian population.
o These population groups are arguably the most urgent focus of any public
health campaigns to improve willingness, both because they have low
willingness to start with, but also because there is the potential opportunity to
bring their willingness back to what it was in August 2020 when there was a
smaller gap with the rest of the Australian population.
o There is a real need to consider a significantly enhanced public health campaign
in languages other than English
o There is a need to convey information to the general public in a way that is
informative, reassuring and salient for those without a degree
iii
The ANU Centre for Social Research and MethodsChange in vaccine willingness – August 2020 to January 2021
1 Introduction and overview
Australians, like much of the world, are hoping and waiting for a successful roll out of a vaccine
for COVID-19 that would allow for a return to a more normal life. While Australia’s rate of
infection and mortality is very low compared to many other countries, this has been achieved
by severely limiting international travel including for Australian citizens wishing to return to
Australia, and compulsory quarantine for arrivals from all parts of the world except for New
Zealand. In addition, state and territory borders have been closed for periods of time and there
have been “lock downs” in different parts of Australia in response to COVID outbreaks.
Significantly easing these restrictions will almost certainly require a sufficient number of
Australians to have been vaccinated (in particular the most vulnerable) and international
arrivals able to show they themselves are vaccinated or from a country with very low infection
rates.
At the time of writing, in mid-February 2021, there were a number of vaccines that appear to
have met the safe and effective threshold, albeit with some uncertainty around the
effectiveness for some of the vaccine candidates for all population groups and for all of the
variants of SARS-CoV-2 (Strizova 2021). A substantial number of countries had commenced
vaccination with Israel having 71.6 COVID-19 doses per 100 population having been
administered (people receive multiple doses so this is not the proportion of the population
vaccinated), United Arab Emirates having 49.6 does per 100 population and the United
Kingdom 21.4 doses per 100 population.1
On the 25 January 2021 the Australian Therapeutic Goods Administration (TGA) provisionally
approved the Pfizer/BioNTech COVID-19 vaccine for people aged 16 years of age and over.
COVID-19 vaccination in Australia is scheduled to start in the second half of February 2021. In
order for this vaccination program to be successful in achieving herd immunity a large enough
proportion of the population need to be vaccinated. This makes monitoring the proportion of
the population that intend to be vaccinated critical public health information. Perhaps even
more importantly understanding how vaccination intentions differ between population sub-
groups and the factors associated with changes in vaccine intentions requires a large dataset
with individuals tracked through time.
The ANU Centre for Social Research and Methods ANU COVID-19 Impact Monitoring Survey
Program asked the same group of respondents about their vaccine intentions in August 2020
and January 2021.2 In addition, the January 2021 survey asked a question on confidence in the
vaccine development process. At the time of the survey in January 2021 a number of countries
had started or were well into the process of vaccinating their populations using one or more
of the recently developed vaccines. While the roll-out of the vaccines had not been completely
smooth, there had at least not been any large-scale incidences of adverse effects from the
vaccines currently being administered. While as noted above provisional approval for the use
of the first vaccine in Australia was made on 25 January, there was a strong community
expectation that approval was imminent.
The paper provides data on the vaccine willingness in Australia as of January 2021 and how
this changed since August 2020 both at the national level and for particular individuals. The
paper provides estimates of how vaccine willingness has changed for different population sub-
groups and the individual level characteristics which are associated with changes in vaccine
willingness.
1
The ANU Centre for Social Research and MethodsChange in vaccine willingness – August 2020 to January 2021
The remainder of the paper is structured as follows. In the next section, we summarise the
international data on vaccine willingness/hesitancy in January 2021. In Section 3 we look at
changes at the national level and in Section 4 we look at the individual trajectories for vaccine
willingness between August 2020 and January 2021. Section 4 looks in detail at the factors that
are associated with that change. Section 5 concludes.
2 International evidence on vaccine hesitancy
Internationally, preliminary evidence suggests that while vaccine hesitancy initially decreased
in the early stages of the pandemic (Caserotti et al. 2021), it has been on the rise in a number
of countries throughout the world, even those experiencing high rates of COVID-19, and those
under lock-down conditions. For example, Wang et al. (2021) found that vaccine acceptance
in Hong Kong was lower during their third COVID-19 wave, compared to the first, and research
by Hacquin et al. (2020) suggests that vaccine refusal steadily rose between May and
September in France, with only 23% of survey participants being willing to take a future vaccine
as reported in September 2020. Similarly, findings from the United States indicate that there
was a steady increase in vaccine hesitancy throughout 2020 (Firdman et al. 2020; Huynh 2020;
Daly & Robinson 2020), however recent research by Pew Research Center (2020) suggests that
this trend might be starting to change, with 60% of Americans reporting that would get a
vaccine for COVID-19 in November 2020, up from 51% in September.
The fact that vaccine hesitancy appears to be rising in countries heavily affected by COVID-19
contradicts previous research which suggests that the increased risk of a disease should result
in improvements to vaccine acceptance (Fridman et al. 2020). Potential explanations for a
rising trend in vaccine hesitancy include greater safety concerns and a perceived rush of
vaccine development (Daly et al. 2020; Huynh 2020; Wang et al. 2021), a lack of trust in
government and pharmaceutical industries, and perceptions that the vaccine isn’t effective
(Hacquin et al. 2020).
3 Vaccine willingness and confidence
The August 2020 ANUpoll included the question ‘If a safe and effective vaccine for COVID-19
is developed, would you…definitely not get the vaccine, probably not get the vaccine, probably
get the vaccine, or definitely get the vaccine? The January 2021 survey included a very similar
question ‘When health officials notify the public that a safe and effective COVID-19 vaccine is
available in Australia, will you…?’, with the same response options as of August 2020. 3
We find a significant increase in vaccine hesitancy. In August 2020, 5.5 per cent of adult
Australians said that they would definitely not get the vaccine, 7.2 per cent said that they would
probably not get the vaccine, 28.7 per cent said that they would probably get the vaccine and
58.5 per cent said that they would definitely get the vaccine (Edwards et al. 2020).
In January 2021, 8.4 per cent of Australians said they would definitely not get the vaccine and
13.3 per cent said they probably would not get a vaccine once health officials notify that a
vaccine is available. This is a substantial increase from the same response options in August
2020. There was also an increase in the per cent of Australians who said they would only
‘probably’ get the vaccine, from 28.7 per cent in August 2021 to 34.7 per cent during the most
recent survey. The only option that has declined, therefore, is those who said they would
‘definitely’ get the vaccine, down from 58.5 per cent in August 2020 to 43.7 per cent in January
2021.
2
The ANU Centre for Social Research and MethodsChange in vaccine willingness – August 2020 to January 2021
There has been a substantial increase in vaccine resistance and hesitancy and a large decline
in vaccine likeliness between the time when a vaccine was still being developed and January
2021 when a number of vaccines were available and being administered internationally, but
not yet available in Australia.
In addition to asking people about their own willingness to take a COVID-19 vaccination once
one is available, we also asked respondents in January 2021 ‘How much confidence, if any, do
you have that the research and development process will produce a vaccine for COVID-19 that
is safe and effective?’. Across the adult Australian population, we estimate that around a
quarter of Australians (25.2 per cent) have ‘A great deal of confidence’ with about half of the
population (49.6 per cent) having ‘A fair amount of confidence.’ The remaining quarter of the
population can be broken down into the 18.5 per cent who have ‘Not too much confidence’
and 6.7 per cent who have ‘No confidence at all.’
Perhaps not surprisingly there is a strong correlation between vaccine willingness and
confidence in the research and development process with the higher the level of confidence
in the research and development process the greater higher the level of vaccine willingness.4
Of those who had a great deal or a fair amount of confidence in the research and development
process, 82.0 per cent said they definitely or probably would get vaccinated. For those who
have not too much or no confidence at all, on the other hand, this declines to 31.9 per cent.
4 Changes in vaccine willingness at the individual level
As reported above, there has been an increase in vaccine resistance and vaccine hesitancy in
Australia since August 2020. One of the strengths of the data used in this paper is that its
longitudinal nature allows change to be analysed at the individual respondent level.
Specifically, there are 2,737 respondents who completed the vaccine question in both August
2020 and January 2021.5
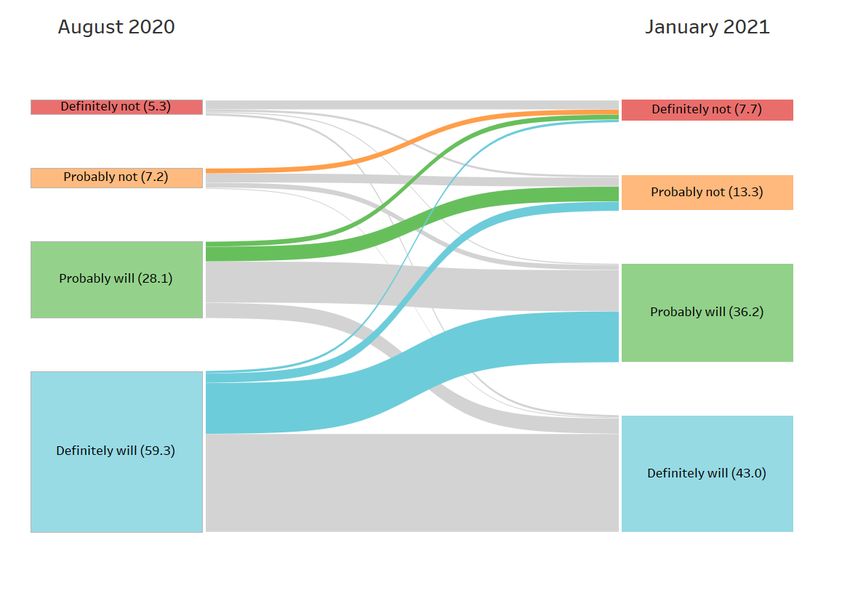
Figure 1 gives the flows between a person’s vaccination intentions when asked in August 2020
and in January 2021 using those who responded to both surveys. The numbers after the
category names give the (weighted) per cent of the longitudinal sample in each of the
categories at that particular point in time, with the size of the individual ‘ribbons’ proportional
to the sizes of the flows.
There are several points to take from Figure 1. First, confirming the repeated cross-sectional
results presented earlier, there is a greater flow from more to less willing (the coloured ribbons
moving upwards in the diagram) than there is movement from less to more willing. At the
individual level, 31.9 per cent of Australians became less willing to get the vaccine between
August 2020 and January 2021 in that they moved from a more to a less willing category. The
second thing to note from the diagram is that there were still some Australians who became
more willing over the period to get vaccinated (9.9 per cent), it is just that this group was far
outweighed by those who moved in the opposite direction.
The final key point to note from the diagram is the largest single flow was the 18.7 per cent of
Australians who we estimate went from being definitely willing to get a COVID-19 vaccination
to only probably willing to get one. Not only is this the largest change in absolute terms, but it
is also the largest change as a per cent of the baseline population. Put simply, one of the biggest
concerns from a herd immunity perspective between mid 2020 and early 2021 is the very large
increase in vaccine uncertainty.
3
The ANU Centre for Social Research and MethodsChange in vaccine willingness – August 2020 to January 2021
Figure 1 Changes in vaccine willingness between August 2020 and January 2021
Source: ANUpoll August 2020, ANUpoll, January 2021.
5 Explaining vaccine willingness and changes
5.1 Vaccine willingness in January 2021
One of the key policy challenges with regards to the roll-out of vaccines is that vaccine
willingness rates are quite different across the country. However, this also creates an
opportunity, in that resources and messaging campaigns can be targeted towards those groups
with lower rates of acceptance.
In order to better understand the demographic, socioeconomic, and geographic factors
associated with vaccine willingness and confidence in the research and development process
regression models have been estimated. These models allow the effects of individual variables
to be estimated while holding constant the effects of other variables.
Given that the dependent variables (vaccine willingness and confidence in vaccine research
and development processes) take one of four mutually-exclusive values each and these have
a natural ordering, an ordered probit regression model is used (Table 1). In these models,
positive values indicate a greater willingness or confidence than the base case which is
described in the note to Table 1 and negative values indicate a lower willingness or confidence.
The direction and the magnitude of the coefficients are very similar for the willingness
regression and the confidence regression. The factors that are associated with a person’s
willingness to get a vaccine (at least as revealed in a social survey) are very similar to the factors
associated with a person’s confidence in the research and development process for developing
a safe and effective vaccine. We therefore focus on the willingness variable in the discussion
4
The ANU Centre for Social Research and MethodsChange in vaccine willingness – August 2020 to January 2021
of the model estimates.
Consistent with other literature, females are less willing to get a vaccine than males. This is
demonstrated by the negative coefficient in the more detailed econometric modelling in Table
1, but is also evident in the simple descriptive statistics (Figure 2). Without controlling for other
characteristics, we estimated that only 39.9 per cent of females think they will definitely get a
safe and effective vaccine, compared to 47.4 per cent of males. There is a larger percentage of
females who think they will probably get the vaccine (36.8 per cent) than males (32.6 per cent),
but even when combined there are fewer females than males in proportionate terms who feel
they are more likely than not to get the vaccine.
There are also significant differences by age. Young Australians (aged 18 to 24 years) and older
Australians (aged 55 years and over) have the highest levels of willingness. To put this gap in
perspective, 85.5 per cent of 18-24 year olds and 90.6 per cent of those aged 75 years and
over say they definitely or probably will get vaccinated. Only 70.2 per cent of those aged 25 to
34 years say they will.
Figure 2 Vaccine willingness between August 2020 and January 2021, by sex and age
August 2020 January 2021
88.4
Male
80.1
86.3
Female
76.6
90.8
18-24 years 85.5
82.9
25-34 years
70.2
88.3
35-44 years 75.3
83.7
45-54 years 73.0
89.6
55-64 years
80.7
89.6
65-74 years
87.9
92.0
75 or more years 90.6
0.0 10.0 20.0 30.0 40.0 50.0 60.0 70.0 80.0 90.0 100.0
Source: ANUpoll August 2020, ANUpoll, January 2021.
Of the other demographic variables, there is no significant difference between Indigenous and
non-Indigenous Australians (although there is a small negative coefficient, that is not
5
The ANU Centre for Social Research and MethodsChange in vaccine willingness – August 2020 to January 2021
statistically significant). This is a promising finding that, although needing to be validated with
more targeted datasets, does give some hope that a relatively vulnerable population sub-group
that may be more susceptible to COVID-19 if infected is at least as willing to get vaccinated as
the general population. There are also no major differences by migration status.
One of the more concerning findings from a public health perspective is that those who speak
a language other than English at home are significantly less willing to get vaccinated than those
who speak English only. Given our surveys are only conducted in English, we are likely to be
missing those with the lowest levels of English language ability. Nonetheless, it does highlight
a real need to target messages to this group and to consider a significantly enhanced public
health campaign in languages other than English.
We find that education levels have a significant and substantial association with vaccine
willingness. Year 12 completion does have a significant association (compared to those who
have completed Year 12, all else being equal), but it is degree qualifications that are the most
predictive of vaccine willingness. Without controlling for other characteristics, 86.9 per cent of
those with a postgraduate degree say they will probably or definitely get vaccinated, alongside
84.6 per cent of those with a bachelor’s degree only. For those without a degree, however,
this declines to 75.6 per cent, highlighting the need to convey information to the general public
in a way that is informative, reassuring and salient for those without a degree.
There is a lower levels of vaccine willingness for those who live outside capital cities compared
to those who live within a capital city. The difference in raw percentages is not as large as it is
for some of the other variables, implying that some of the differences in the econometric
model are due to observed characteristics. Nonetheless, in the econometric model there is a
negative and significant coefficient, and when making bivariate comparisons, only 79.4 per
cent of those in a capital city say they probably or definitely will get the vaccine compared to
76.1 per cent of those in a non-capital city. This may be due in part to a consistently lower level
of infections in less urban parts of the country. Nonetheless, infection risk will still remain for
non-capital cities and regional and remote areas in general, and may even increase as
vaccinated Australians from capital cities and urban areas travel around the country without
having been tested and without symptoms. Once again, a targeted set of information for these
geographic areas is worth considering from a policy perspective.
6
The ANU Centre for Social Research and MethodsChange in vaccine willingness – August 2020 to January 2021
Table 1 Demographic, socioeconomic, and geographic factors associated with vaccine
willingness and confidence in the research and development process
Willingness Confidence
Coeff. Signif. Coeff. Signif.
Female -0.143 *** -0.178 ***
Aged 18 to 24 years 0.300 *** 0.321 ***
Aged 25 to 34 years 0.016 -0.057
Aged 45 to 54 years 0.056 0.012
Aged 55 to 64 years 0.269 *** 0.257 ***
Aged 65 to 74 years 0.524 *** 0.450 ***
Aged 75 years plus 0.785 *** 0.692 ***
Indigenous -0.107 -0.230
Born overseas in a main English speaking country -0.049 -0.048
Born overseas in a non-English speaking country -0.134 -0.061
Speaks a language other than English at home -0.264 *** -0.329 ***
Has not completed Year 12 or post-school qualification -0.280 *** -0.309 ***
Has a post graduate degree 0.457 *** 0.390 ***
Has an undergraduate degree 0.310 *** 0.194 **
Has a Certificate III/IV, Diploma or Associate Degree -0.086 -0.149 *
Lives in the most disadvantaged areas (1st quintile) -0.124 -0.089
Lives in next most disadvantaged areas (2nd quintile) -0.155 ** -0.162 **
Lives in next most advantaged areas (4th quintile) -0.118 -0.041
Lives in the most advantaged areas (5th quintile) -0.117 -0.054
Lives in a non-capital city -0.149 *** -0.164 ***
Cut-point 1 -1.549 -1.763
Cut-point 2 -0.914 -0.875
Cut-point 3 0.081 0.535
Sample size 3,269 3,287
Source: ANUpoll, January 2021.
Notes: Ordered Probit Regression Model. The base case individual is female; aged 35 to 44 years; non-
Indigenous; born in Australia; does not speak a language other than English at home; has completed Year
12 but does not have a post-graduate degree; lives in neither an advantaged or disadvantaged suburb
(third quintile); and lives in a capital city.
Coefficients that are statistically significant at the 1 per cent level of significance are labelled ***; those
significant at the 5 per cent level of significance are labelled **, and those significant at the 10 per cent
level of significance are labelled *.
5.2 Explaining changes in vaccine willingness
The analysis in the previous section is of the demographic, socioeconomic, and geographic
factors associated with vaccine willingness and confidence in January 2021. Some, but not all
of the above associations are similar to those found in previous waves of ANUpoll (Edwards et
al. 2020) and are therefore picking up stable characteristics associated with vaccine willingness
(albeit with different magnitudes).
This section extends this analysis to look at the characteristics of the population that predict
changes through time in vaccine willingness and, in particular, the decrease in vaccine
willingness observed between August 2020 and January 2021. We follow a number of
complimentary approaches to understand what factors are associated with changes in vaccine
willingness.
The first step is to estimate a regression model with the dependent variable being vaccine
willingness in January 2021 including all of the demographic, geographic and socio-economic
characteristics included in the models reported in Table 1 plus a range of other variables
7
The ANU Centre for Social Research and MethodsChange in vaccine willingness – August 2020 to January 2021
related to attitudes, beliefs and circumstances. We then progressively remove variables or sets
of variables that have the lowest level of statistical significance until all explanatory variables
are significant at least at the 10 per cent level of significance.6
With this set of explanatory variables, four complimentary econometric models are run. The
first model is for vaccine willingness including all four categories (i.e., same as in the model
reported in Table 1), but including the broader set of explanatory variables. The second model
adds to the first model vaccine willingness in August 2020 and is thus an estimate of the factors
associated with changes in vaccine willingness between August 2020 and January 2021 (i.e., a
lagged dependent variable model).
The third model is of the factors associated with becoming less willing between August 2020
and January 2021. This model excludes those who said, in August 2020 that they definitely
would not get a vaccine. This model compares those who are become less vaccine willing (i.e.,
the coloured ribbons in Figure 1 or 33.7 per cent of the relevant in scope population) to those
whose vaccine willingness did not change or they become more vaccine willing. The fourth
model looks at those who said that they would definitely or probably get the vaccine in August
2020 and models the factors associated with saying they would probably or definitely not get
the vaccine in January 2021. That is, those who flipped from being on balance willing to on
balance not willing.
5.2.1 Vaccine willingness (January 2021 ANU Poll Survey only)
Beginning with the results presented in the first column (the expanded cross-sectional analysis)
there are a range of more time varying attitudinal and outcome variables that are associated
with vaccine willingness. Those who had been tested for COVID-19 were more likely to say they
would get vaccinated, as were those who had experienced anxiety or worry due to COVID-19.
This highlights the role that a person’s own COVID-related experience plays in their vaccine
willingness. There is a very strong negative relationship between thinking too much is being
made of COVID-19 and vaccine willingness, highlighting the need to remind people (in a careful
and targeted way) of the ongoing potential effects of COVID-19, even if Australia has been
relatively successful in managing infections and mortality.
There was a positive relationship between confidence in the Federal government and an even
stronger association with confidence in State/Territory governments, who are more
responsible for public health delivery in Australia. The institution that has the strongest
association though is hospitals and the health care system. To put these results in perspective,
80.9 per cent of those Australians who say they are confident in hospitals and the health
system say they probably or definitely will get vaccinated, compared to only 63.0 per cent of
those who are not confident.
Those who have experienced financial stress in the last 3 months (as indicated by not being
able to pay their rent or mortgage on time) are much less likely to say they will get vaccinated.
Clearly, people in those circumstances have very pressing immediate concerns, and the short-
term risk of illness from the vaccine may be more salient whereas the medium to long-term
benefit of the vaccine may be of less relevance. Finally, those who are more optimistic about
the future or who have a belief in a strong role of government are more likely to say they will
get vaccinated.
5.2.2 Vaccine willingness – changes from August 2020
In the second column of results in Table 2 we add vaccine intentions from August 2020 so that
now the variables in the model show how these variables are associated with changes through
8
The ANU Centre for Social Research and MethodsChange in vaccine willingness – August 2020 to January 2021
time in vaccination willingness. Fewer variables were statistically significant with being tested
for COVID-19, being anxious or worried due to COVID-19, confidence in Federal or state or
territory governments and being born overseas in a non-English speaking country were not
associated with changes in vaccine intentions. In part, this may be due to the smaller sample
size (due to the use of the longitudinal sample) but also suggests that some variables predict
stable traits, rather than explain short-term changes in intentions.
For those that remained statistically significant, some coefficient values also declined between
Model 1 and Model 2 (the lagged dependent variable model) but were still robustly associated
with changes in intentions since August 2020. These included thinks too much is being made
about COVID-19, confidence in hospital and health care system, financial stress (i.e. paying rent
or mortgage on time), optimistic that life will improve in the next 12 months, belief in strong
government, age and education.
5.2.3 Decrease in willingness (excluding those who definitely would not have got the
vaccine in August 2020)
Focusing on decreases in vaccine willingness (the third model ), a few select variables were
statistically significant, even after controlling for levels of willingness in August 2020. Those
who think too much is being made of COVID-19 have become less willing through time
(perhaps a reflection of the relative success of managing infections since August 2020),
whereas those who have confidence in the hospitals and health care system have become
more willing. Optimism about life in 2022 and a belief in a strong role of government were also
associated with a higher probability of becoming willing to get vaccinated since August 2020.
Of the more stable explanatory variables, females, Indigenous Australians, those who speak a
language other than English at home and those who have not completed Year 12 have all
became less willing to get a vaccine since August 2020.
5.2.4 No longer willing (changed from definitely or probably in August 2020 to probably or
definitely not in January 2021)
Those that switched their vaccine intentions were more likely to be unable to pay their
mortgage or rent in the last 3 months, more likely to be 45-54 years (compared to 35 to 44
years) and had a Certificate III/IV, Diploma or Associate Degree. Those that shifted to vaccine
hesitancy (probably or definitely not in January 2021) were less likely to be:
• confident in the Federal Government;
• confident in hospitals or health care system;
• optimistic about the next 12 months; and
• 65 or more years.
9
The ANU Centre for Social Research and MethodsChange in vaccine willingness – August 2020 to January 2021
Table 2 Factors associated with vaccine willingness and change in vaccine willingness, August 2020 and January 2021
Willingness Willingness Decreased No longer willing
(categorical I) (categorical II) willingness
Coeff. Signif. Coeff. Signif. Coeff. Signif. Coeff. Signif.
Definitely not get vaccine as of August 2020 -2.037 ***
Probably not get vaccine as of August 2020 -1.737 *** -0.534 ***
Probably get vaccine as of August 2020 -0.898 *** -0.481 *** 0.748 ***
Tested for COVID-19 0.121 ** 0.089 -0.081 -0.156
Anxious or worried due to COVID-19 0.234 *** 0.056 -0.017 -0.005
Thinks too much is being made of COVID-19 -0.451 *** -0.293 *** 0.222 ** 0.087
Confident in the Federal government 0.110 * 0.062 -0.042 -0.199 *
Confident in State/Territory government 0.159 ** 0.073 -0.093 -0.017
Confident in hospitals and health care system 0.286 *** 0.231 *** -0.207 ** -0.241 *
Unable to pay rent or mortgage in previous 3 months -0.256 *** -0.255 *** 0.125 0.261 *
Thinks life will be improved in next 12 months 0.195 *** 0.203 *** -0.230 *** -0.225 **
Index of belief in strong role of government 0.025 *** 0.018 ** -0.023 ** -0.021
10
The ANU Centre for Social Research and MethodsChange in vaccine willingness – August 2020 to January 2021
Willingness Willingness Decreased No longer willing
(categorical I) (categorical II) willingness
Coeffic. Signif. Coeffic. Signif. Coeffic. Signif. Coeffic. Signif.
Female -0.258 *** -0.217 *** 0.254 *** 0.012
Aged 18 to 24 years 0.270 ** 0.207 -0.026 0.064
Aged 25 to 34 years -0.051 -0.074 0.101 0.354 **
Aged 45 to 54 years 0.036 0.025 -0.046 0.104
Aged 55 to 64 years 0.306 *** 0.180 ** -0.153 -0.051
Aged 65 to 74 years 0.510 *** 0.329 *** -0.290 ** -0.309 *
Aged 75 years plus 0.794 *** 0.533 *** -0.529 *** -0.463 **
Indigenous -0.128 -0.270 0.452 ** 0.365
Born overseas in a main English speaking country -0.077 0.047 -0.078 0.049
Born overseas in a non-English speaking country -0.168 ** -0.145 0.129 0.252
Speaks a language other than English at home -0.239 *** -0.213 ** 0.255 ** 0.005
Has not completed Year 12 or post-school qualification -0.152 -0.235 ** 0.254 ** 0.215
Has a post graduate degree 0.431 *** 0.255 ** -0.163 -0.215
Has an undergraduate degree 0.288 *** 0.119 -0.089 -0.123
Has a Certificate III/IV, Diploma or Associate Degree -0.044 -0.161 * 0.183 0.264 *
Lives in the most disadvantaged areas (1st quintile) -0.095 0.062 -0.134 0.012
Lives in next most disadvantaged areas (2nd quintile) -0.147 * -0.079 -0.019 0.126
Lives in next most advantaged areas (4th quintile) -0.118 0.139 -0.128 -0.152
Lives in the most advantaged areas (5th quintile) -0.139 * -0.061 -0.014 0.124
Lives in a non-capital city -0.126 ** -0.100 0.066 0.081
Cut-point 1 -0.996 -2.083
Cut-point 2 -0.300 -1.220
Cut-point 3 0.756 0.070
Constant 0.054 -1.167
Sample size 3,184 2,562 2,433 2,279
Source: ANUpoll, August 2020 and January 2021.
Notes: Probit Regression Model. The base case individual is female; aged 35 to 44 years; non-Indigenous; born in Australia; does not speak a language other than English at
home; has completed Year 12 but does not have a post-graduate degree; lives in neither an advantaged or disadvantaged suburb (third quintile); and lives in a capital
city. Coefficients that are statistically significant at the 1 per cent level of significance are labelled ***; those significant at the 5 per cent level of significance are
labelled **, and those significant at the 10 per cent level of significance are labelled *.
11
The ANU Centre for Social Research and MethodsChange in vaccine willingness – August 2020 to January 2021
6 Concluding comments
Australia has been ranked by the Lowy Institute as the 8th most effective country (out of 98) in
terms of COVID-19 policy response, based on confirmed deaths, cases and tests.7 While there
have no doubt been large economic and social costs from that public health response, data
published previously from ANUpoll has shown that life satisfaction and wellbeing in Australia
is now back to levels observed prior to the spread of COVID-19, and that economic outcomes
are close to having converged.
That does not, of course, mean that life in Australia is back to a pre-COVID normality, or that it
will be any time soon. For this to occur, a much higher degree of herd immunity is likely to be
necessary, and this is only likely to occur following an effective vaccination roll-out, reaching
the vast majority of Australians, and the most vulnerable Australians in particular. Australia has
been for the most part a bystander in the vaccine development process, but will have to have
an effective public health response to ensure the faster than expected development of
vaccinations translates into positive outcomes in Australia.
Data presented in this paper has shown that this may be becoming increasingly more
challenging than first thought, as rates of vaccine willingness appear to be declining, with a
particularly large decrease in vaccine certainty. Moreover, other research suggests that
estimates of the time taken to the vaccinate the population may be too optimistic (Hanly et
al., 2021), enabling more time for misinformation which in turn could drive vaccine hesitancy.
We found three attitudinal factors that were particularly important in explaining the decline in
willingness. Those Australians who think too much is being made of COVID-19, those who have
low confidence in hospitals and the health care system, and those who are not optimistic about
the next 12 months had all decreased in terms of their willingness to get vaccinated once a
vaccine is available. In addition to campaigns targeting vaccination directly, those programs
that improve confidence, remind people of the dangers of COVID-19, but importantly highlight
the potential for a much better 2022 all have the potential to improve vaccination rates.
In addition, females, Indigenous Australians, those who speak a language other than English at
home and those who have not completed Year 12 have all became less willing to get a vaccine
since August 2020. These population groups are arguably the most urgent focus of any public
health campaigns to improve willingness, both because they have low willingness to start with,
but also because there is the potential opportunity to bring their willingness back to what it
was in August 2020 when there was a smaller gap with the rest of the Australian population.
12
The ANU Centre for Social Research and MethodsChange in vaccine willingness – August 2020 to January 2021
Appendix 1 About the survey
The primary source of data for this paper is the January ANUpoll. The Social Research Centre
collected data online and through Computer Assisted Telephone Interviewing (CATI) in order
to ensure representation from the offline Australian population. Around 4.9 per cent of
interviews were collected via CATI. The contact methodology adopted for the online Life in
Australia™ members is an initial survey invitation via email and SMS (where available), followed
by multiple email reminders and a reminder SMS. Telephone non-response of panel members
who have not yet completed the survey commenced in the second week of fieldwork and
consisted of reminder calls encouraging completion of the online survey.
The contact methodology for offline Life in Australia™ members was an initial SMS (where
available), followed by an extended call-cycle over a two-week period. A reminder SMS was
also sent in the second week of fieldwork.
A total of 4,055 respondents were invited to take part in the survey, leading to a wave-
specific completion rate of 85.3 per cent. Taking into account recruitment to the panel, the
cumulative response rate for this survey is around 7.3 per cent.
Unless otherwise stated, data in the paper is weighted to population benchmarks. For Life in
Australia™, the approach for deriving weights generally consists of the following steps:
1. Compute a base weight for each respondent as the product of two weights:
a. Their enrolment weight, accounting for the initial chances of selection and
subsequent post-stratification to key demographic benchmarks
b. Their response propensity weight, estimated from enrolment information
available for both respondents and non-respondents to the present wave.
2. Adjust the base weights so that they satisfy the latest population benchmarks for
several demographic characteristics.
The ethical aspects of this research have been approved by the ANU Human Research Ethics
Committee (2014/241).
The previous waves of data collection consisted of a 15-20 minute survey, with the October
2020 survey slightly less than five minutes in length. A full-length survey was conducted in
November 2020 with a further survey scheduled for April 2021.
A high proportion of respondents to the January survey (85.9 per cent) had been interviewed
at least once since January 2020, with a number of new participants added to replace those
who dropped out of Life in AustraliaTM over time and thus to maintain its representativeness
or the Australian population. A slightly lower proportion of the sample (80.9 per cent) were
interviewed in the November 2020 sample specifically, meaning we have a very large sample
of Australians for whom we can track outcomes over the COVID-19 period, as well as over the
two months preceding the survey.
Between the 18th of January and the 1st of February 2021, the Social Research Centre on behalf
of the ANU Centre for Social Research and Methods undertook an ANUpoll as part of the sixth
wave of the ANU’s COVID-19 Impact Monitoring Survey Program.
13
The ANU Centre for Social Research and MethodsChange in vaccine willingness – August 2020 to January 2021
References
Caserotti, M., P., Girardi, E. Rubaltelli,A. Tasso, L. Lotto and T. Gavaruzzi (2021). “Associations
of COVID-19 risk perception with vaccine hesitancy over time for Italian residents.”
Social Science and Medicine (1982), 272, 113688. Advance online publication.
https://doi.org/10.1016/j.socscimed.2021.113688
Daly, M., and E. Robinson (2020). “Willingness to vaccinate against COVID-19 in the US:
Longitudinal evidence from a nationally representative sample of adults from April–
October 2020.” medRxiv, 2020.2011.2027.20239970.
doi:10.1101/2020.11.27.20239970
Edwards, B., N. Biddle, M. Gray and K. Sollis (2020). “COVID-19 vaccine hesitancy and
resistance: Correlates in a nationally representative longitudinal survey of the
Australian population.” MedRxiv, https://doi.org/10.1101/2020.11.13.20231480
Fridman, A., R. Gershon and A. Gneezy (2020). “COVID-19 and Vaccine Hesitancy: A
Longitudinal Study.”
Hacquin, A., S. AltayE. de Araujo, C. Chevallier and H. Mercier (2020). “Sharp rise in vaccine
hesitancy in a large and representative sample of the French population: reasons for
vaccine hesitancy.” https://doi.org/10.31234/osf.io/r8h6z
Hanly, M., T. Churches, O. Fitzgerald, C.R. McIntyre and L. Jorm (2021). “Vaccinating
Australia: How long will it take?: medRxiv preprint:
https://doi.org/10.1101/2021.02.02.21250979
Huynh, H. (2020). “Most (but not all) anti-vaccination attitudes increased alongside the
occurrence and persistence of COVID-19: A snapshot of the trends in the U.S.”
https://doi.org/10.31234/osf.io/yzu9r
Kessler, R.C., G. Andrews, L.J. Colpe, E. Hiripi, D.K. Mroczek, S.L. Normand, E.E., Walters and
A.M. Zaslavsky, (2002). “Short screening scales to monitor population prevalences
and trends in non-specific psychological distress.” Psychological Medicine, 32(6): 959-
976.
Pew Research Center (2020). “Intent to get a COVID-19 vaccine rises to 60% as confidence in
research and development process increases.” Retrieved from
https://www.pewresearch.org/science/2020/12/03/intent-to-get-a-covid-19-vaccine-rises-
to-60-as-confidence-in-research-and-development-process-increases/
Strizova, Z., Smetanova, J., Bartunkova, J. and Milota, T., 2021. Principles and Challenges in
anti-COVID-19 Vaccine Development. International Archives of Allergy and
Immunology, pp.1-11.
Wang, K., E.L.Y Wong, K.F. Ho, A.W.L. Cheung, P.S. Y Yau, D. Dong, S.Y-S. Wong, and E.K. Yeoh
(2021). “Change of willingness to accept COVID-19 vaccine and reasons of vaccine
hesitancy of working people at different waves of local epidemic in Hong Kong, China:
Repeated cross-sectional surveys.” Vaccines, 9(1), 62. doi:10.3390/vaccines9010062
14
The ANU Centre for Social Research and MethodsChange in vaccine willingness – August 2020 to January 2021
Endnotes
1 Data is for up to 12th February and is from https://ourworldindata.org/covid-
vaccinations
2 These surveys are being undertaken on a representative sample of using the Life in
AustraliaTM nationally representative online panel which is collecting data from the
same group of Australians. Surveys had been conducted with the same group of
respondents (apart from the refresh members) in January and February 2020, just
before the COVID-19 pandemic started in Australia and in April, May, August (when
the last vaccination question was asked), October, and November after the pandemic
started to cause major impacts in Australia, as well as during and just after the second
wave of infections that were concentrated on Victoria. Full details of the survey are
given in Appendix 1, with the survey itself soon to be available through the Australian
Data Archive.
3
The change in question wording was required given that by January 2021 COVID-19
vaccinations were taking place in a number of countries due to the assessment of
these countries that a safe and effective vaccination is available.
4 Across the four categories of each, the polychoric correlation is 0.812.
5
Between November 2020 and January 2021 the panel was refreshed with n = 385
panellists being retired and n = 612 new panellists being recruited. The longitudinal
sample comprises 89.7 per cent of the 3,052 individuals that were interviewed in
August 2020 and for whom we have vaccine data. Given this it is appropriate to use
the August 2020 weights for the longitudinal analysis.
6 In order, we tested and then removed the following variables from the model:
• Serious or moderate levels of psychological distress, as measured by the K-6 index and
thresholds (Kessler et al. 2002);
• A person’s own expected likelihood of being infected in the next 6 months;
• Number of hours worked per week in January 2021; and
• Confidence in the public service.
7 https://interactives.lowyinstitute.org/features/covid-performance/
15
The ANU Centre for Social Research and MethodsYou can also read


