Mike Mahoney Chairman and Chief Executive Officer - Boston Scientific Investor Relations

Page created by Gladys Frazier
 
CONTINUE READING
Mike Mahoney Chairman and Chief Executive Officer - Boston Scientific Investor Relations
Mike Mahoney
Chairman and Chief Executive Officer
Mike Mahoney Chairman and Chief Executive Officer - Boston Scientific Investor Relations
Safe harbor for forward-looking statements

This presentation contains forward-looking statements within the meaning of Section 27A of the Securities Act of 1933 and
Section 21E of the Securities Exchange Act of 1934. Forward-looking statements may be identified by words like
“anticipate,” “expect,” “project,” “believe,” “plan,” “estimate,” “intend” and similar words. These forward-looking
statements are based on our beliefs, assumptions and estimates using information available to us at the time and are not
intended to be guarantees of future events or performance. If our underlying assumptions turn out to be incorrect, or if
certain risks or uncertainties materialize, actual results could differ materially from the expectations and projections
expressed or implied by our forward-looking statements.

Factors that may cause such differences can be found in our most recent Form 10-K and Forms 10-Q filed or to be filed
with the Securities and Exchange Commission under the headings “Risk Factors” and “Safe Harbor for Forward-Looking
Statements.” Accordingly, you are cautioned not to place undue reliance on any of our forward-looking statements.
We disclaim any intention or obligation to publicly update or revise any forward-looking statements to reflect any
change in our expectations or in events, conditions, or circumstances on which they may be based, or that may affect
the likelihood that actual results will differ from those contained in the forward-looking statements.

                                                                                                                            2
Mike Mahoney Chairman and Chief Executive Officer - Boston Scientific Investor Relations
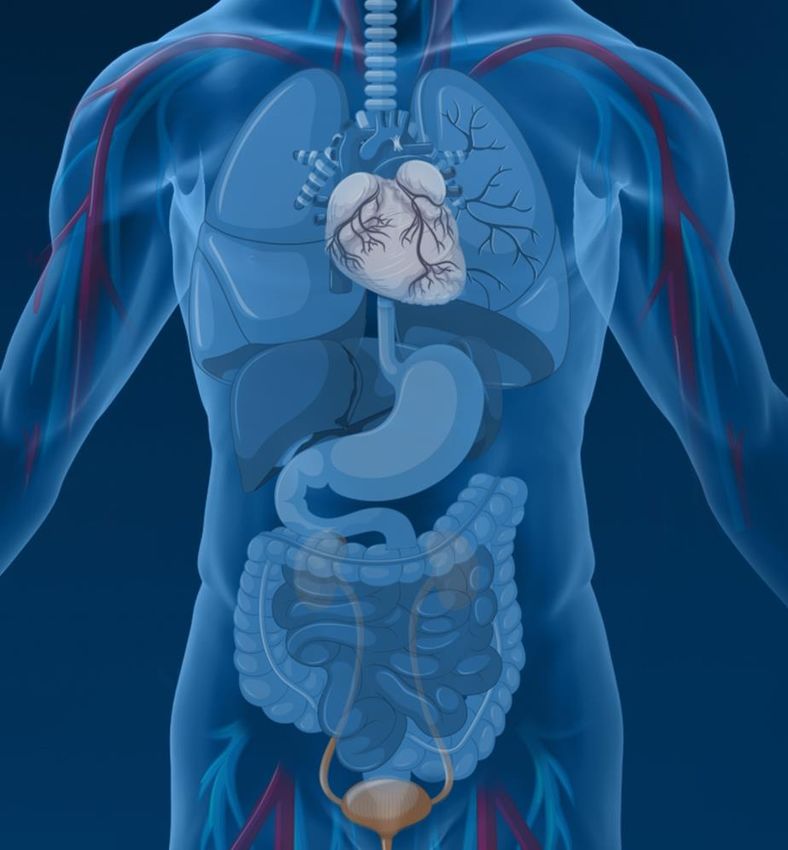
Regulatory disclaimers

Product                                       Regulatory Disclaimer

WATCHMAN FLX™                                 CE Marked. U.S.: Caution: Investigational Device. Limited by Federal (or U.S.) law to investigational use only. Not available for sale.

ACURATE neo2™ Self-Expanding Valve Platform   Pending CE Mark. U.S.: Caution: Investigational Device. Limited by Federal (or U.S.) law to investigational use only. Not available for sale.

Millipede Mitral Repair Technology            Device under development. Not available for use or sale worldwide.

LOTUS Mantra™ Valve System                    Device under development. Not available for use or sale worldwide.

EXALT™ Model D                                Pending CE Mark. Not available for sale outside of the U.S.

SpyGlass™ Discover                            Device under development. Not available for use or sale worldwide.

EXALT™ Model B                                Device under development. Not available for use or sale worldwide.
EXALT™ Model Bx                               Device under development. Not available for use or sale worldwide.

EXALT™ Model TG                               Device under development. Not available for use or sale worldwide.

SpyGlass™ DS III                              Device under development. Not available for use or sale worldwide.

PEG Scope                                     Device under development. Not available for use or sale worldwide.

iNod™ Ultrasound Guided Needle                Device under development. Not available for use or sale worldwide.

                                                                                                                                                                                              3
Mike Mahoney Chairman and Chief Executive Officer - Boston Scientific Investor Relations
Financial disclaimers
Market Estimates:
Unless noted otherwise, all references to market sizes, market share positions, and market growth rates are BSX internal estimates.
Non-GAAP Financial Measures:
This presentation contains non-GAAP measures (denoted with *) in talking about our company’s performance. The reconciliations of those non-GAAP measures to their most
comparable GAAP measures are contained within this document including appendices attached to the end of this presentation.
Revenue Growth:
All growth rates are operational unless otherwise noted. Operational growth rates are non-GAAP measures that exclude the impact of foreign currency fluctuations. Organic growth
rates are non-GAAP measures that exclude the impact of foreign currency fluctuations and the sales from the acquisitions of the electrophysiology business of C.R. Bard Inc., the
Interventional Division of Bayer AG, the American Medical Systems male urology portfolio, EndoChoice Holdings, Inc., Symetis SA, NxThera, Inc., Claret Medical, Inc., Augmenix, Inc.,
Vertiflex, Inc. and BTG plc (BTG) in the periods for which there are no prior period related sales. Organic revenue growth also excludes the impact of the divestiture of our global
embolic microspheres portfolio, a transaction entered into in connection with obtaining the antitrust clearances required to complete the BTG transaction.
Medical Devices:
We have three historic reportable segments comprised of Medical Surgical (MedSurg), Rhythm and Neuro, and Cardiovascular, which represent an aggregation of our operating
segments that generates revenues from the sale of medical devices (Medical Devices). As part of our BTG acquisition, which closed on August 19, 2019, we acquired an
Interventional Medicine business, which is now included in our Peripheral Interventions’ operating segment's 2019 revenues from August 19, 2019 through December 31, 2019.
Specialty Pharmaceuticals:
As part of our BTG acquisition, which closed on August 19, 2019, we acquired a Specialty Pharmaceuticals business (Spec Pharma). Subsequent to acquisition, Spec Pharma is a
stand-alone operating segment presented alongside our Medical Device reportable segments. Spec Pharma net sales are substantially U.S. based. Our chief operating decision
maker (CODM) reviews financial information of our globally managed Spec Pharma operating segment at the worldwide level without further disaggregation into regional results. As
such, Spec Pharma net sales are presented globally, and our Medical Devices reportable segments regional net sales results do not include Spec Pharma.
Emerging Markets:
We define Emerging Markets as the 20 countries that we believe have strong growth potential based on their economic conditions, healthcare sectors and our global capabilities in
our Medical Devices business. Periodically, we assess our list of Emerging Markets; effective January 1, 2019, we updated our list of Emerging Market countries. Our current list is
comprised of the following countries: Argentina, Brazil, Chile, China, Colombia, Czech Republic, India, Indonesia, Malaysia, Mexico, Philippines, Poland, Russia, Saudi Arabia, Slovakia,
South Africa, South Korea, Thailand, Turkey and Vietnam. The revision had an immaterial impact on prior year sales.

                                                                                                                                                                                            4
Mike Mahoney Chairman and Chief Executive Officer - Boston Scientific Investor Relations
Our Mission and Values

                                          Boston Scientific is dedicated to
                                      transforming lives through innovative
                                        medical solutions that improve the
                                        health of patients around the world.

                         Meaningful      High          Global          Diversity &   Winning
                Caring
                         Innovation      Performance   Collaboration   Inclusion     Spirit

                                                                                               5
Mike Mahoney Chairman and Chief Executive Officer - Boston Scientific Investor Relations
What to expect from BSX 2020+

1. Highly engaged and driven team – patient-centric,
   motivated and innovative global culture

2. Continued execution of category leadership strategy
   and portfolio diversification into higher growth,
   adjacent markets

3. Compelling and differentiated pipeline driven by
   meaningful innovation

4. Commitment to corporate social responsibility and
   sustainable business models

5. Consistent, high performance to deliver shareholder value;
   long term financial goals for 6-9% organic revenue growth
   and margin expansion to drive double-digit adj EPS growth

                                                                6
Mike Mahoney Chairman and Chief Executive Officer - Boston Scientific Investor Relations
Category leadership driving growth
                              2019 revenue1 $10.7B, 11.1% op* growth, 7.3% organic* growth

           Interventional Cardiology                                         Cardiac Rhythm
                    (incl. Structural Heart)                                 Management
                        $2.8B, +11%, +10%                                   $1.9B, +1%

                       Structural Heart                                      Electrophysiology
                                High end of                                 $329M, +7%
                       $700-725M guidance2

             Peripheral Interventions                                        Neuromodulation
            (incl. IM, excl. Spec Pharma)
                         $1.4B, +19%, +8%                                   $873M, +13%, +7%

                                         Endoscopy        Urology & Pelvic Health
                                           $1.9B, +9%         $1.4B, +15%, +8%
                                                                                               Growth rates listed are operational*, organic*
+Spec Pharma $81M                                                                                                                      7
                                                                       Endo, CRM and EP operational and organic growth rates are equivalent
Mike Mahoney Chairman and Chief Executive Officer - Boston Scientific Investor Relations
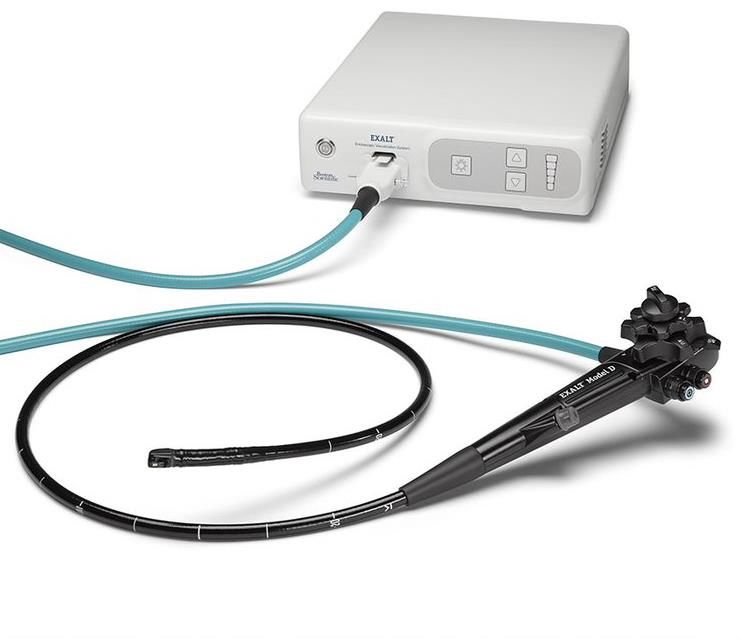
Driving global expansion
                                        Building scale and capabilities

             Strong, balanced growth in every region          Emerging Markets remain a key growth driver 2020+

                                    LACA
                                $0.4B, +7%
                                                                                       +15%

                           APAC
                          $1.9B, +12%

                                                                $1.25B, +19%
                                      2019          US
                                    Revenue1t
                                                $6.1B, +10%
                         EMEA
                      $2.3B, +9%

                                                                    2019 2     2020E     2021E      2022E
t Excludes
         Spec Pharma
Growth rates are operational*
                                                                                                                  8
Mike Mahoney Chairman and Chief Executive Officer - Boston Scientific Investor Relations
Track record of delivering high performance:
                  Organic revenue growth

Driving market share, entering new high growth segments and expanding geographic reach

                                                                                        Est Organic* CAGR
                                                                                              6-9%
                                                                   Organic* CAGR
                                                                        7%
                                     Organic* CAGR
                                          6%

       Organic* CAGR
           (1%)

2011       2012        2013   2014       2015        2016   2017       2018        2019 1    2020E-
                                                                                             2022E

                                                                                                            9
Mike Mahoney Chairman and Chief Executive Officer - Boston Scientific Investor Relations
Track record of delivering high performance:
                                   Operating margin improvement and EPS growth

               Delivering on adjusted operating                                      Consistent double digit adjusted EPS* growth
                   margin* expansion goals                                                       ’15-’19E CAGR: 14%

   Adj. operating margin* goal                                                      Adj. EPS* growth goal
                                                                                                                                                             +DD%
                                                                                                                                                              Y/Y
                                                                       +50-100                                                                      $1.55-
                                                                                                                                                    $1.58
                                                                   26- bps Y/Y
                                                                 26.25%                                                                    $1.47
                                                         25.5%                                                                                      +11-
                                                 25.0%                                                                             $1.26            13%
                                                                                                                                                        5

                                         24.1%                                                                                             +17%
                                                                                                                           $1.11
                                                                                                                                   +13%
                                 22.3%
                                                                                                                    $0.93 +20%
                                                                                                            $0.84
                       20.2%
                                                                                                 $0.73              +11%
19.2% 18.8% 18.9%                                                                  $0.67 $0.66              +15%
                                                                                                 +10%
                                                                                   (3%)   (2%)

2011    2012    2013    2014     2015    2016    2017    2018    2019E 3 2020E     2011   2012    2013      2014    2015   2016    2017    2018 4   2019E 3 2020E
                                                                         - 2022E                                                                            - 2022E

                                                                                                                                                                      10
Consistent portfolio diversification into
                 higher growth markets

                                  BSX portfolio revenue mix

                                                      High growth markets (≥8% CAGR):
                                                      IC (Structural Heart), RM (EP), PI (Drug Eluting, Venous,
                          $11B           ~35%         Therapeutic Oncology), NM, Endo (TIPs, Endoluminal
                                                      Surgery), UroPH (Prostate Health)
                 $8B      ~25%

          $7B    ~15%
          ~10%
                                                      Moderate growth markets (3-7% CAGR):
         ~45%    ~50%     ~45%           ~45%         Endo (Core), PI (Core Arterial + Core Oncology), UroPH
                                                      (Core), IC (Complex PCI), RM (ICM)

         ~45%    ~35%     ~30%           ~20%         Low growth markets (
Multiple sources of innovation
                                            drive compelling pipeline
   Internal adjusted R&D* % of                                        Disciplined and balanced                 Strategic investments &
revenue at the high end of peers                                          approach to M&A                            partnerships

                                             ~10.5%              •   Tuck-ins across multiple          •   Active venture capital portfolio
                          10.5-11%                                   businesses
      10.8%                                                                                                –   40+ investments in mixed stages
                          ~$1.2B                                 •   Strong integration track record           of opportunity
    ~$1.0B
                                                                                                           –   5 of 12 most recently closed deals
                                                                 •   Healthy pipeline augmented by
                                                                                                               from VC portfolio
                                                                     VC portfolio
      2017                  2019E 6           2021E
                                                                                                       •   Employee engagement
                                                                                                           –   “Imagine If” program

                                                                                                       •   Multiple incubators + spin outs +
     LithoVue™ single-use
         ureteroscope                   EXALT™ D single-use                                                strategic partnerships
                                          duodenoscope
                   HeartLogic™ Heart
                     Failure Alert

     WaveWriter™                                                                                                      Tsinghua University
 Spinal Cord Stimulator         Vercise™ Deep Brain Stimulator

                                                                                                                                                 12
Large and compelling high growth markets
                         across the portfolio
                    2019 BSX Sales1       Mkt Growth         Key Products / New Markets
                    Operational* Growth   2019 – 2022 CAGR

                                                             • LAAC Global Expansion (WATCHMAN™)
   Interventional        $2.8B                               • TAVR (ACURATE neo™, LOTUS Edge™)
                                               +6%
      Cardiology          +11%                                 and Embolic Protection (Sentinel™)
                                                             • Mitral Repair Technologies

                                                             • Therapeutic Oncology
       Peripheral        $1.4B
                                               +6%           • Venous Stenting & Pulmonary Embolism
    Interventions         +19%                               • Drug-eluting (ELUVIA™ DES, Ranger™ DCB)

       Rhythm                                                • HeartLogic™ Heart Failure Alert
                         $2.3B
   Management                                  +4%           • Mapping and Navigation (RHYTHMIA™)
                           +2%                               • Single Shot for Pulmonary Vein Isolation
      (CRM + EP)
                                                             • Expanding pain treatment continuum
                         $0.9B
Neuromodulation                              +8-10%            Superion™ for Lumbar Spinal Stenosis
                          +13%                               • DBS for Parkinson’s Disease and Tremor

                                                             • Pancreaticobiliary Disease
                         $1.9B
     Endoscopy                                 +5%           • Infection Prevention and Pathology
                           +9%                               • Therapeutic Imagingt

                                                             • LithoVue™ Flexible Ureteroscope, StoneSmart™
      Urology &          $1.4B
                                               +6%           • SpaceOAR™ Hydrogel
   Pelvic Health          +15%                               • MIT benign prostatic hyperplasia (BPH)
                                                                                                              t Therapeutic   Imaging excluded from Market/CAGR
                        $10.7B                ~6%                                                                                       Excludes BTG Spec Pharma
                                                                                                                                                              13
Strong product pipeline
                                   supports top tier growth
                         2020E                                    2021E                                    2022E+
Coronary Therapies                          Coronary Therapies                      Coronary Therapies
• SYNERGY XD, 48 mm, MEGATRON – U.S.        • AVVIGO Guidance System                • NG Atherectomy System
• SYNERGY XD – Japan                        • ROTAWIRE Drive - US and Japan         • SYNERGY XD – China
• Comet II pressure wire
                                            Structural Heart                        Structural Heart
Structural Heart                            • ACURATE neo2 – U.S.                   • Millipede Mitral Valve Repair – EU
• WATCHMAN FLX (LAAC) – U.S.                • WATCHMAN FLX (LAAC) – China           • LOTUS Mantra – U.S. & EU
• ACURATE neo2 (TAVR) – EU                                                          • ACURATE neo2 – Japan
• LOTUS Edge (TAVR) – Japan                 Peripheral Interventions                • ACURATE PRIME – expanded sizes U.S. & EU
                                            • Ranger DCB SFA – Japan
Peripheral Interventions                    • Interventional Oncology Coils         Peripheral Interventions
• Ranger DCB SFA – U.S.                     • Athletis PTA Balloon                  • SAVAL DES BTK
• OptiCross 35 IVUS Catheter                • CLI Catheter
• AngioJet Clothunter                                                               CRM/EP
                                            CRM/EP                                  • Resonate 2.0
CRM/EP
                                            • RHYTHMIA 5.0                          • POLARx (Cryo Single Shot) – U.S.
• POLARx (Cryo Single Shot) – EU
                                            • Ingevity+ Pacing Lead – EU            • LUMINIZE (RF Single Shot) – U.S.
• LUX-Dx ICM – U.S.
                                                                                    • Empower leadless pacing/mCRM – U.S.
• Ingevity+ Pacing Lead – U.S.
                                            Neuromodulation                         • Force-Sensing Catheter – U.S.
• DIRECTSENSE – U.S.
                                            • SCS/DBS next gen systems              • Next gen CRM pulse generator
• Force-Sensing Catheter – EU
• LUMINIZE (RF Single Shot) – EU
                                            Endoscopy                               Neuromodulation
• 3300 Programmer
                                            • Single-use scope platform expansion   • SCS indication expansion
Neuromodulation                             • AXIOS expanded indications – U.S.
• DBS next gen visualization platform                                               Endoscopy
                                            Urology/Pelvic Health                   • Single-use scope platform expansion
Endoscopy                                   • LithoVue Ureteroscope next gen        • Endoluminal surgery toolkit expansion
• Exalt Model D single-use scope – U.S.     • AMS 700 IPP enhancements
• SpyGlass Discover single-use scope        • Core Stone enhancements               Urology/Pelvic Health
• ORISE ProKnife                                                                    • StoneSmart expansion
• Resolution 360 Ultra hemostasis clip                                              • Rezūm enhancements

Urology/Pelvic Health
• Tria Ureteral Stents – U.S. & EU
• SpaceOAR & Rezūm – Int’l expansion
• SpaceOAR Vue Hydrogel
                                                                                                                                 14
Key portfolio growth drivers 2020+
       Selected product spotlights

Structural               BTG                Single-use
   Heart               Venous &               Scopes
                     Interventional
                       Oncology

                                                         15
1) Structural Heart
                        Differentiated portfolio stands out in $6B market
                        BSX Structural Heart revenue $900M to $1B in 2020E

                                      WATCHMAN™ LAAC                                      SENTINEL™ Cerebral
Prevent                                                                                   Protection System
                                      WATCHMAN FLX US H2:20E
Stroke                                                                                    PROTECTED TAVR
                                      CHAMPION AF trial (H2H DOAC) launch 2020E
                                                                                          trial launch H1:20E

Match Aortic                           LOTUS Edge™ TAVR                           ACURATE neo2™ TAVR
Valve to Need                          150 US accounts open by Q2:20              CE Mark mid-2020E
                                       Mantra 29mm clinical trial H2:20E          FDA Approval YE 2021E

Cornerstone Repair of                        MILLIPEDE TMVr
Mitral Annulus                               Initiated feasibility study

Prevent
                                         iSLEEVE™ Expandable                         SAFARI2™ Pre-Shaped
Vascular
                                         Introducer Sheath                           Guidewire
Complications

                                                                                                                16
WATCHMAN
                        Expanding clinical investments: CHAMPION-AF

Estimated Global
            Estimated Global LAAC Market Size
LAAC Market Size
                                                                            CHAMPION-AF Study

                                                                        A randomized, controlled trial
                                                                         studying WATCHMAN FLX vs.
                                                                         DOACs
                                                                        Lower bleeding risk patients with
                                                                         non-vascular atrial fibrillation
                                                            2025E+       (NVAF)
                             2023E                            $2B+
  2018                         ~$1B                                     Expecting ~2,000 NVAF patients
  ~$400M                                                                 and ~150 sites
                                                                        Anticipate to begin enrolling in
                                                                         H2:2020
                                                                        Co-Chairmen: Dr. Marty Leon and
          Penetration into                  Penetration into
    high-bleed risk NVAF patient      low-to-moderate-bleed risk
                                                                         Dr. Ken Ellenbogen
            population                  NVAF patient population         Principal Investigators: Dr. Shephal
                                                                         Doshi and Dr. Saibal Kar
                                                                                                             17
2) BTG: Venous & Interventional Oncology
                                 Strong strategic fit, high growth adjacencies

                                                                                    Significant operational &
           Access to BTG IM high growth adjacencies
                                                                                     commercial synergies

        Interventional Oncology                      Venous Disease            • Engaging customers as a newly
              2018 Market: $1.6B                     2018 Market: $1.4B          combined entity with complementary
              ’19-’22 CAGR: ~8%                      ’19-’22 CAGR: ~8%           portfolio
                                                                               • Expect ~$175M in synergies by year 3
Category Leader in Cancer Therapeutics                  Scaled Player              - Integration on plan
                                                           DVT, PE, SVI
                                                                                   - Leveraging BSX global footprint
           Future indications:                                                     - Est. 80% synergies by end of year 2
            Prostate Cancer
              Brain Cancer
              Lung Cancer                                                            2019 Global Revenue Distribution

 Y90 Radiotherapy                Cryo, Microwave   Thrombolysis    Vena Cava
  for Liver Cancer                   Therapy        Treatment         Filter

                                                                                                                           18
3) Single-use endoscopes: $2B+ market opportunity
                  Reduce infection, enhance efficiency, and improve availability

               EXALT MODEL D      COMPREHENSIVE SINGLE-USE THERAPEUTIC IMAGING PORTFOLIO

                                      Exalt™ Model D                         Exalt™ Model B
                                      Duodenoscope                           Bronchoscope
                                      1.5M ERCPs                             3M procedures

                                      SpyGlass™ Discover
                                                                            Exalt™ Model Bx
                                      Choledochoscope
                                                                             2M procedures
                                      40K procedures

                                      SpyGlass™ DS III                     iNod™ Ultrasound
                                      Cholangioscope                         Guided Needle
                                      150K procedures                    150K procedures US
 Proven commercial channel

Market leading device portfolio       Exalt™ Model TG                            PEG Scope
                                      Therapeutic                           Gastroscope for
                                      Gastroscope                           PEG Placement
 Favorable market conditions          800K procedures                      530k procedures

                                                                                              19
Strong cash flow generation outlook

                                                                   Capital structure facilitates
  Compelling adj. free cash flow*: 10% CAGR 2019E-2022E
                                                                        growth strategy

                                                                  • Closed $4B BTG acquisition
                               +10%
                                                   ~$2.8B           August 2019
                                  ~$2.5B
                      ~$2.3B                                      • Expect to repay $1.6B debt
           ~$2.1B
                                                                    over 16 months post-BTG
                                                                    close

                                                                  • Targeting BBB+ credit ratings

                                                                  • Flexibility to return cash to
           2019E 3     2020E          2021E         2022E           shareholders post debt
                                                                    paydown
Debt-to-                                      Long-term
EBITDA
           ~3.3x      ~2.6x            ---
                                              goal ~2.25x
                                                            ---

                                                                                                    20
Consistent top tier financial performance & outlook

                                                                    Goals
                                      2019E                      2020E-2022E

    Organic Revenue*                 +7.3%1                      +6-9% CAGR

   Operational Revenue*              +11.1%1                            TBD

  Adj. Operating Margin*       +50-75bps3 Y/Y                     +50-100 bps
                                                               Improvement annually

      Adj. Tax Rate*                   ~9%3                           ~11%7
                                                           Less ~100bps stock comp benefit

     Adj. EPS* Growth               11%-13%                  Double-digit growth
                              ex. 2018 IRS settlement3,5

Adj. Free Cash Flow*/Growth           $2.1B3                      +10% CAGR

                                                                                             21
Ongoing commitment to Corporate Social Responsibility

                      PEOPLE                                                            PLANET                                PRACTICES
                               Ranked                                          47%                                                             87
                                                                        greenhouse
                                28th                                   gas emissionst
                                                                                                                                              Product
                                                                                                                                             launches

                             10/20/40                                          30%                  95% of solid
         Progress on
                                                                          water                      waste diverted
                                                                                                                                             $1B+
                   D&I goals                                           consumptiont                                                       Invested in R&D
                                                                                                      from landfillst
                                                                                                                            114
                                          99.9%                                                                         Active Clinical
  55 Awareness &                         Gender pay
                                                                                                                             Trials
   Education Events                        equityt
                                                                                                                         Newsweek

     35K                     40K                                                                                          2020 Most

 Employees
           Volunteer                                                 Carbon Neutral                        46%           Responsible
                                                                                                                          Company
             hours                                                    in Costa Rica Green Real Estate
t 2018   figure, greenhouse gas emissions and water consumption compared to 2009 manufacturing operations baseline.                                     22
Acronym Reference Guide

Afib   Atrial Fibrillation                              IO      Interventional Oncology

BPH    Benign Prostatic Hyperplasia                     MIT     Minimally Invasive Techniques

CRM    Cardiac Rhythm Management                        NM      Neuromodulation

DBS    Deep Brain Stimulation                           NVAF    Non-valvular Atrial Fibrillation

DCB    Drug Coated Balloon                              PCI     Percutaneous Coronary Intervention

DES    Drug-eluting Stent                               PE      Pulmonary Embolism

DVT    Deep Vein Thrombosis                             PI      Peripheral Interventions

Endo   Endoscopy                                        RF      Radiofrequency

EP     Electrophysiology                                RM      Rhythm Management

ERCP   Endoscopic Retrograde Cholangiopancreatography   SCS     Spinal Cord Stimulation

EUS    Endoscopic Ultrasound                            SVI     Superficial Venous Insufficiency

GI     Gastrointestinal                                 TAVR    Transcatheter Aortic Valve Replacement

IC     Interventional Cardiology                        TIPs    Therapeutic Imaging Platforms

ICM    Insertable Cardiac Monitor                       TMVr    Transcatheter Mitral Valve Repair

IM     Interventional Medicine                          UroPH   Urology & Pelvic Health

                                                                                                         24
References

*Non-GAAP measure; for reconciliations of non-GAAP financial measures to the most directly comparable GAAP figures, please refer to Appendix A of this
document.

1Based   on preliminary, unaudited sales results issued January 14, 2020
2Based   on preliminary, unaudited internal estimates
3Based   on 2019 guidance issued October 23, 2019
4Full
    year 2018 adjusted earnings per share of $1.47 and 17% growth includes a $0.07 net tax benefit. This net benefit includes the second quarter $0.06
benefit from settling the IRS Stipulation of Settled Issues for the 2001 through 2010 tax years offset by a fourth quarter $0.05 charge for our previously
announced tax reinvestment strategy. In addition, the net benefit includes a $0.06 benefit in the fourth quarter for the settlement with the IRS of our 2011
through 2013 tax years.
52019E   adjusted EPS growth excluding the 2018 net tax benefit $0.07 in the base, as described above in Reference No. 4
6Based   on midpoint of 2019 guidance issued October 23, 2019 and preliminary, unaudited sales results issued January 14, 2020
7Estimated   tax rate is operational and excludes discrete tax items, such as the benefit related to adoption of ASU 2016-09

                                                                                                                                                               25
Supplemental Non-GAAP Disclosures

                                                                                   Less: Impact of                   Less: Impact
                                                                                        Foreign                        of Recent
FY 2019 Divisional Revenue Growth 1 (unaudited) compared to FY                         Currency      Operational    Acquisitions /   Organic
2018                                                             Reported Basis      Fluctuations      Basis          Divestitures    Basis
     Endoscopy                                                                8%               -2%             9%              0%          9%
     Urology & Pelvic Health                                                 13%               -1%            15%              6%          8%
   MedSurg                                                                  10%                -2%           11%               3%          9%
     Cardiac Rhythm Management                                               -1%               -2%             1%              0%          1%
     Electrophysiology                                                        6%               -2%             7%              0%          7%
     Neuromodulation                                                         12%               -1%            13%              6%          7%
   Rhythm and Neuro                                                          3%                -2%            5%               2%          3%
     Interventional Cardiology                                                9%               -2%            11%              1%         10%
     Peripheral Interventions                                                17%               -2%            19%             11%          8%
   Cardiovascular                                                           11%                -2%           14%               4%          9%
 Medical Devices                                                             8%                -2%           10%               3%          7%
 Specialty Pharmaceuticals                                                   n/a               n/a            n/a             n/a         n/a
Net Sales                                                                    9%                -2%          11.1%              4%        7.3%

                                                                                   Less: Impact of
                                                                                        Foreign
                                                                                       Currency      Operational
                         1
FY 2019 Revenue Growth (unaudited) compared to FY 2018           Reported Basis      Fluctuations      Basis
Rhythm Management (CRM & EP)                                                  0%               -2%             2%

                                                                                                                                                26
Supplemental Non-GAAP Disclosures

                                                                                          Less: Impact of
                                                                                               Foreign
FY 2019 Regional Revenue Growth 1 (unaudited ) compared to FY                                 Currency       Operational
2018                                                                  Reported Basis        Fluctuations       Basis

  U.S.                                                                            10%                  0%              10%

   EMEA (Europe, Middle East and Africa)                                           4%                 -5%               9%
   APAC (Asia-Pacific)                                                            10%                 -2%              12%
   LACA (Latin America and Canada)                                                 3%                 -4%               7%
  International                                                                    6%                 -4%              10%

Medical Devices (a)                                                                8%                 -2%              10%
Specialty Pharmaceuticals (b)                                                     n/a                 n/a              n/a
Net Sales                                                                          9%                 -2%              11%

Emerging Markets 2                                                                14%                 -5%              19%

(a) We have three historical reportable segments comprised of Medical Surgical (MedSurg), Rhythm and Neuro, and Cardiovascular, which
represent an aggregation of our operating segments that generates revenues from the sale of medical devices (Medical Devices). As part of our
acquisition of BTG on August 19, 2019, we acquired an Interventional Medicine business, which is now included in our Peripheral Interventions
operating segment's 2019 revenues from August 19, 2019 through December 31, 2019.

(b) As part of our acquisition of BTG on August 19, 2019, we acquired a specialty pharmaceuticals business (Specialty Pharmaceuticals).
Subsequent to acquisition, Specialty Pharmaceuticals is now a stand-alone operating segment presented alongside our Medical Device reportable
segments. Specialty Pharmaceuticals net sales are substantially U.S. based. Our chief operating decision maker (CODM) reviews financial
information of our globally managed Specialty Pharmaceuticals operating segment at the worldwide level without further disaggregation into
regional results. As such, Specialty Pharmaceuticals net sales are presented globally, and our Medical Devices reportable segments regional
net sales results do not include Specialty Pharmaceuticals.

                                                                                                                                                27
Supplemental Non-GAAP Disclosures

Revenue Growth                                                              2019 1               2018               2017              2016            2015           2014            2013            2012            2011
Revenue growth, as reported                                                               9%               9%              8%                12%              1%             3%             -1%             -5%             -2%
 Less: Impact of foreign currency fluctuations                                           -2%               1%              0%                 0%             -7%            -3%             -2%             -2%              3%
Operational Revenue Growth                                                              11%                8%              8%                12%              8%             6%              1%             -3%             -5%
 Less: Impact of certain acquisitions and divestitures                                   4%                1%              1%                 2%             3%             2%              -1%              0%             -3%
Organic Revenue Growth                                                                   7%                7%              7%                10%             5%             4%               2%             -3%             -2%

Organic revenue growth (2011-2013)                                                                                                                                                          -1%
Organic revenue growth (2014-2016)                                                                                                           6%
Organic revenue growth (2017-20191)                                                     7.0%

Adjusted R&D Margin                                                          2019E3                2017
R&D Margin, as reported                                                                                   11.0%
 Less: Non-GAAP adjustments                                                                                0.2%
Adjusted R&D Margin                                                                10.5-11%               10.8%

Adjusted R&D Margin is a non-GAAP measure that excludes the impact of acquisition and divestiture and restructuring related
charges or credits.

                                                                                   3
Adjusted Operating Margin                                                  2019E                2018               2017             2016            2015            2014           2013            2012           2011
Operating Margin, as reported                                                                           15.3%          14.2%              5.3%         -3.8%           -4.1%           1.7%          -53.4%         11.9%
 Less: Non-GAAP adjustments                                                                            -10.2%         -10.8%            -18.8%        -26.1%          -24.3%         -17.2%          -72.2%          -7.3%
Adjusted Operating Margin                                                   26 - 26.25%                 25.5%          25.0%             24.1%         22.3%           20.2%          18.9%           18.8%         19.2%

Growth in basis points (bps) year over year (2018-20193)                               50-75

Adjusted operating margin, adjusted earnings per share and their related growth rates are non-GAAP measures that exclude the impacts of certain charges (credits) which may include medical device regulation charges,
amortization expense, goodwill and intangible asset impairment charges, acquisition/divestiture-related net charges and credits, restructuring and restructuring-related net charges and credits, litigation related net
charges and credits, pension termination charges, certain debt extinguishment net charges and credits, certain investment impairment charges, certain tax restructuring transaction net charges and credits and/or certain
discrete tax items.
                                                                                                                                                                                                                       28
Supplemental Non-GAAP Disclosures

Earnings Per Diluted Share                                                  2019E3,5             2018 4              2017              2016            2015          2014          2013          2012          2011        2010
GAAP net income (loss) per share                                             $0.72 - $0.75   $            1.19   $          0.08   $          0.25   $   (0.18)    $   (0.09)    $   (0.09)    $   (2.89)    $    0.29   $   (0.70)
 Non-GAAP adjustments                                                                0.83                 0.28              1.18              0.86        1.11 (a)      0.93 (b)      0.82 (c)      3.55 (d)      0.38        1.39 (e)
Adjusted net income (loss) per share                                        $1.55 - $1.58    $            1.47   $          1.26   $          1.11   $    0.93     $    0.84     $    0.73     $    0.66     $    0.67   $    0.69

Adjusted net income (loss) per share                                                         $            1.47
                                       4
 Less: Impact of 2018 net tax benefit                                                                     0.07
Adjusted net income (loss) per share, excluding 2018 net tax benefit                         $            1.40

Adjusted EPS growth from prior year                                                 11-13%                17%               13%               20%          11%           15%           10%           -2%           -3%

Adjusted EPS CAGR 2015-2019E6                                                         14%

(a) Assumes dilution of 21.5 million shares for the year ended December 31, 2015.
(b) Assumes dilution of 23.7 million shares for the year ended December 31, 2014.
(c) Assumes dilution of 19.5 million shares for the year ended December 31, 2013.
(d) Assumes dilution of 7.7 million shares for the year ended December 31, 2012.
(e) Assumes dilution of 10.0 million shares for the year ended December 31, 2010.

                                                                                                                                                                                                                               29
Supplemental Non-GAAP Disclosures

Adjusted Free Cash Flow ( in billions)                                        2019E3                 2018               2017             2016
Operating cash flow, reported                                                                  $             0.3   $           1.4   $          1.2
  Less: Purchases of property, plant and equipment                                                           0.3               0.3              0.4
  Add: Proceed on disposals of property, plant and equipment                                                 -                 -                -
Free Cash Flow, as reported                                                                    $             -     $           1.1   $          0.8
  Plus: Special Adjustments                                                                                  2.1               0.6              0.8
Adjusted Free Cash Flow                                                  $             2.1     $             2.1   $           1.7   $          1.6

Adjusted free cash flow and its related growth rate are non-GAAP measures that exclude from free cash flow the cash component of certain charges (credits) that are also
excluded from adjusted net income as well as any cash tax benefits of such charges. In addition, we exclude tax settlements payments and refunds that relate to prior
periods. Free cash flow is a non-GAAP measure that excludes net purchases of property, plant and equipment from cash provided by (used for) operating activities on a
GAAP basis. The GAAP measure that is most directly comparable to adjusted free cash flow and free cash flow is cash provided by (used for) operating activities on a GAAP
basis.

Tax Rate                                                                      2019E3                2018               2017
Tax Rate, GAAP basis                                                                    1%                  -18%               89%
 Less: Non-GAAP adjustments                                                            -8%                  -24%               78%
Tax Rate, Adjusted                                                                      9%                    7%               11%

Adjusted Tax Rates are non-GAAP measures that exclude the impacts of certain charges (credits) which may include medical
device regulation charges, amortization expense, intangible asset impairment charges, acquisition/divestiture-related net
charges and credits, restructuring and restructuring-related net charges and credits, litigation related net charges and credits,
certain investment impairment charges and/or certain discrete tax items.

                                                                                                                                                                            30
Supplemental Non-GAAP Disclosures

The following is an explanation of the adjustments that management excluded from GAAP measures to calculate the following forward-looking non-GAAP financial measures:

Adjusted Gross Margin: Excludes from GAAP gross margin the impacts of forecasted acquisition- and divestiture- and restructuring-related charges or credits.

Adjusted SG&A: Excludes from GAAP SG&A the impacts of forecasted acquisition- and divestiture- and restructuring-related charges or credits.

Adjusted R&D: Excludes from GAAP R&D the impacts of forecasted acquisition- and divestiture- and restructuring-related charges or credits.

Adjusted Operating Margin and Adjusted Earnings (Loss) Per Share: Excludes from GAAP operating margin and GAAP net income (loss) the impacts of forecasted medical
device regulation charges, acquisition- and divestiture- and restructuring- and restructuring-related charges or credits and amortization expense.

Adjusted Tax Rate: Excludes from GAAP tax rate the tax impacts related to forecasted medical device regulation charges, acquisition- and divestiture- and restructuring- and
restructuring-related charges or credits and amortization expense.

Adjusted Free Cash Flow: Adjusts GAAP operating cash flow to include the impacts of forecasted medical device regulation charges, capital expenditures and excludes the
impact of estimated after-tax acquisition- and divestiture-, restructuring- and litigation-payments.

2020E+ Operational Revenue and related growth rates: Excludes from GAAP revenue and related growth rates the forecasted impact of foreign currency fluctuations.

2020E+ Organic Revenue and related growth rates: Excludes from GAAP revenue and related growth rates the forecasted impact of foreign currency fluctuations and the
forecasted impact of proposed and future acquisitions and divestitures with no comparable sales in the period.

Please refer to our Safe Harbor for forward-looking statements disclosure in conjunction with any forward looking information presented within.

                                                                                                                                                                               31
You can also read