DIRTT for Investors March 2019 - Investor Presentation TSX: DRT
←
→
Page content transcription
If your browser does not render page correctly, please read the page content below
DIRTT for Investors
    Investor Presentation
    March 2019

    TSX: DRT

1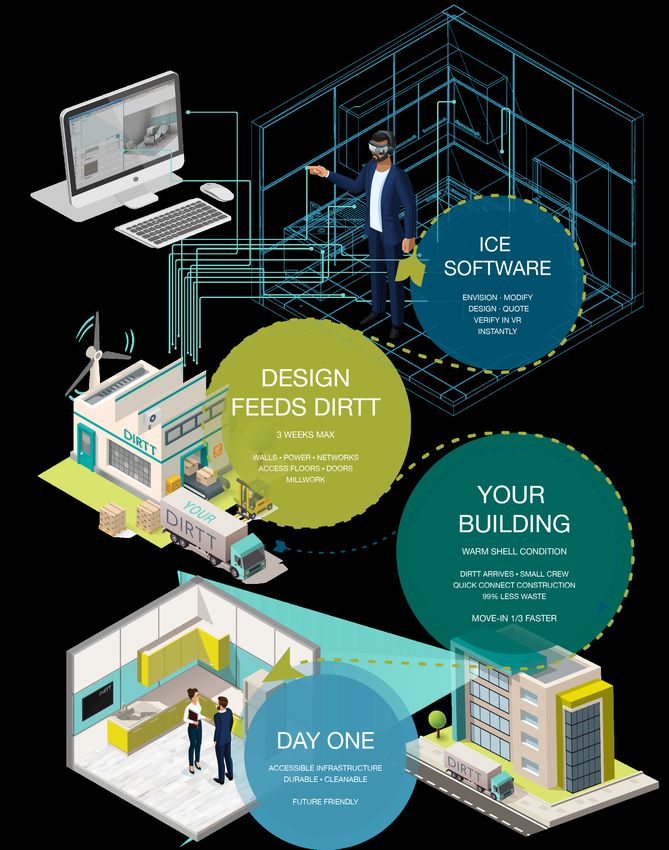
Advisories
General
This presentation is not, and does not constitute, an offer to sell or the solicitation, invitation or recommendation to purchase any securities in any jurisdiction, and neither this presentation nor anything contained herein shall form the basis of any
contract or commitment.

Forward-Looking Information
This presentation contains certain forward-looking statements and forward-looking information (collectively, "forward-looking information") within the meaning of applicable securities laws. Forward-looking information is not historical fact and is
generally, but not always, identified by words such as "expects", "expected", "proposes", "anticipates", "believes", "estimates", "intends", "plans", "project", "continues", "outlook", "potential" or similar words and expressions, or that events or conditions
"will", "would", "may", "could" or "should" occur including, without limitation, statements regarding the Company’s business plans and objectives; estimates of domestic and international economics; and growth strategy and opportunities.

Forward-looking information contained in this presentation is based on management’s expectations and assumptions regarding, among other things: the Company’s ability to manage its growth; competition in the Company’s industry; the Company’s
ability to enhance current products and develop and introduce new products; the Company’s ability to obtain components and products from suppliers on a timely basis and on favorable terms; the Company’s ability to obtain qualified staff and
equipment in a timely and cost-efficient manner; the regulatory framework governing taxes in Canada and the United States of America and any other jurisdictions where the Company currently or may conduct its business in the future; future
development plans for the Company’s assets unfolding as currently envisioned; future capital expenditures to be made by the Company; future sources of funding for the Company’s capital program; the Company’s ability to list on an accredited
exchange in the United States of America; the impact of increasing competition on the Company; the Company’s ability to remediate product deficiencies and the Company’s success in identifying other risks to its business and managing the risks
mentioned below. Many of the foregoing assumptions are subject to change and are beyond our control.

By its nature, such forward-looking information involves significant known and unknown risks and uncertainties, which could cause results or outcomes to differ materially from those anticipated. These risks and uncertainties include, but are not limited
to: maintaining and managing growth; history of financial losses; risks related to new technology; competition risk; operating results and financial condition fluctuations; risks related to intellectual property; risks related to additional capital requirements;
customer base and market acceptance; software and product defects and design risks; availability of key supplies; dependence on key personnel; changes in management; availability of manufacturing labour; capacity of manufacturing facilities;
commodity price risk; credit risk; the effect of government regulation; risks related to international expansion; risks related to physical facilities; legal risks; foreign currency and fiscal matters; risks related to future acquisitions; risks related to forward-
looking information; reliance on third parties; and conflicts of interest. The foregoing list of risks and uncertainties is not exhaustive. The effect of any one risk or uncertainty on particular forward-looking information is uncertain because these factors
are independent, and management's future course of action would depend on an assessment of all available information at that time. Further information regarding the assumptions and risks inherent in the making of forward-looking information can
be found in the Company’s Annual Information Form and other continuous disclosure documents. Copies of the Annual Information Form and the Company’s other continuous disclosure documents are available on the Company's website at
www.dirtt.net and on SEDAR at www.sedar.com and prospective investors and others should refer to such materials before making any investment decision.

Although the Company believes the assumptions and expectations used in the forward-looking information contained in this presentation are reasonable, due to the risks, uncertainties and assumptions inherent in forward-looking information, there
can be no assurance that these assumptions and expectations will be correct and prospective investors in our securities should not place undue reliance on such forward-looking information contained in this presentation. In addition, this presentation
may contain forward-looking information attributed to third party industry sources. Accordingly, readers are cautioned that if one or more of these risks or uncertainties materialize, or should assumptions and expectations underlying forward-looking
information prove incorrect, actual results or outcomes could differ materially from those described in this presentation.

The forward-looking information contained in this presentation is expressly qualified by the foregoing cautionary statements. Unless otherwise stated, forward-looking information included in this presentation is made as of the date of this presentation
and the Company undertakes no obligation to update or revise any forward-looking information to reflect new events or circumstances or otherwise, except as required by applicable law.

Notice to Residents of the United States of America
The securities of DIRTT have not been registered under the United States Securities Act of 1933, as amended (the "U.S. Securities Act") or securities laws of any state of the United States of America, its territories or possessions or areas subject to
its jurisdiction ("U.S.") and may not be offered or sold in the U.S. except in certain transactions exempt from the registration requirements of the U.S. Securities Act and in compliance with any applicable securities laws of the jurisdictions where the
offering or sale is being made.

Currency and Presentation of Financial Information
Unless otherwise indicated, references to "CDN$" or "$" are to Canadian dollars and references to "US$" are to U.S. dollars. Unless otherwise indicated, all financial information relating to the Company in this presentation
has been prepared in Canadian dollars using International Financial Reporting Standards ("IFRS").

     2
Non-IFRS Measures
Non-IFRS Measures
The term "Adjusted Gross Profit %", "Adjusted Operating Expenses", "Adjusted EBITDA" and "Adjusted EBITDA %" are financial measures used by DIRTT that are not standard measures under International
Financial Reporting Standards ("IFRS") as adopted by the Canadian Institute of Chartered Accountants. DIRTT’s method of calculating Adjusted Gross Profit %, Adjusted Operating Expenses, Adjusted EBITDA
and Adjusted EBITDA % may differ from the methods used by other issuers. Therefore, these non-IFRS measures may not be comparable to the same measures presented by other issuers.

Adjusted Gross Profit is gross profit before deductions for depreciation and amortization of equipment, tooling and intangible assets for manufacturing-related assets. Adjusted Gross Profit % is Adjusted Gross
Profit divided by revenue. We use these measures to assess our manufacturing and operating performance. As manufacturing volumes and revenue rise, production synergies tend to permit improvements in
gross profit, subject to variability in monthly manufacturing volumes and product/service revenue mix.

Adjusted EBITDA is net income before interest, taxes, depreciation and amortization, plus: non-cash foreign exchange gains or losses on debt revaluation; impairment expense; stock-based compensation
expenses; reorganization costs; and any other non-recurring gains or losses. Adjusted EBITDA % is calculated as Adjusted EBITDA divided by revenue. We use these measures to assess our ability to
generate cash flows, service debt, pay current taxes, and fund capital expenditures.

Adjusted Operating Expenses is Operating Expenses before deductions for depreciation and amortization of non-manufacturing related assets, stock-based compensation expenses, impairment expenses and
reorganization costs. We use this as a measure of the efficiency and effectiveness of our sales and marketing efforts and overall administrative support efforts by comparing them to prior period results.

"Net cash flows provided by operating activities before changes in non-cash working capital" are net cash flows provided by operating activities and adding back the change in non-cash working capital.

For a reconciliation of these non-IFRS measure see DIRTT’s annual and interim Management Discussion and Analysis, complete copies of which are available on the Company’s website at www.dirtt.net and
on SEDAR at www.sedar.com.

3
Company Snapshot
DIRTT is a building process powered by technology.

•      Manufacturer of custom, prefab interior environments
•      Proprietary 3D design, configuration and manufacturing software
       (ICE) integrates and unifies every step of the construction process
•      Provides certainty in function, aesthetics, price and schedule         ICE® Software rendering

•      Founded in 2004

                                    Key numbers

     $357M                              ~20%               $56.2M
    FY 2018 Revenue           Revenue CAGR since 2013*   FY 2018 Adj EBITDA

    ~1,130                               218                 184
      Employees                     Patents granted      North American            Final project shot
                                                         Partner locations

Note: all figures in CAD$, unless otherwise noted
* Full Year 2013 - 2018
4
Large Underpenetrated
                                                                  Superior Proven Process
           Addressable Market                                 -   Proprietary product and technology deliver
    -   Up to US$150B addressable North American                  certainty on function, aesthetics, price and
        market                                                    schedule
    -   Shortage of skilled labor negatively impacting        -   Unique, fully customizable, flexible commercial
        conventional construction                                 solution agnostic to customer industry
    -   Customers faced with cost overruns, scheduling        -   Comprehensive North American market coverage
        delays and unfulfilled expectations                       via multiple manufacturing facilities and
    -   Increasing demand for environmentally sensitive           dealer/installer (Partner) network
        and adaptable spaces

                                                       Why DIRTT?
               Inflection Point in
                DIRTT’s History
    -   New leadership building foundation to scale
        the business
                                                                        Financial Strength
                                                              -   Strong balance sheet; $72M cash and equivalents;
    -   Introducing a strategic approach to sales and
                                                                  no debt
        marketing to drive superior growth
                                                              -   Demonstrated long term revenue growth in excess
    -   Financial discipline focused on unlocking income
                                                                  of market growth
        statement leverage to optimize EBITDA margin
        and growth
    -   Publicly traded on TSX with US listing anticipated
        in 2019

5
Major US Construction Markets Geographically

                                                                                                                  Estimated US$150B North American
                                                                                                                  addressable market

                                                                                                                  Estimated current penetration in major
                                                                                                                  markets is less than 1%

                                                                                                                  Corporate GLCs located in major North
                                                                                                                  American markets: New York, Chicago,
                                                                                                                  Phoenix, Salt Lake City, Seattle (under
                                                                                                                  construction), Toronto, Calgary

                                                                                                                  Market growth at approx. 7% p.a.
Primary Metro Area Markets                              Secondary Metro Area Markets
$9.1B   $27.5B    $45.9B     $64.3B   $82.6B   $91.8B   $2.2B    $6.6B    $11.0B       $15.3B   $19.7B   $21.9B

                                                                                                                  Sources: FMI U.S. Construction Outlook, Second Quarter 2018 Report;
Sources: Statistics of U.S. Businesses (SUSB), and United States Census Bureau. MSA Annual Payroll                DIRTT management estimate
data was used to further break down Metropolitan areas.

 6
DIRTT’s Approach To Market
                                                            - General contractor
                                                            - Architect
                                                            - Interior designer

    DIRTT manufacturing facility    DIRTT Partner       Intermediary

                                       Customer
              Education            Financial Services   Healthcare

        Professional Services         Technology          Other

7
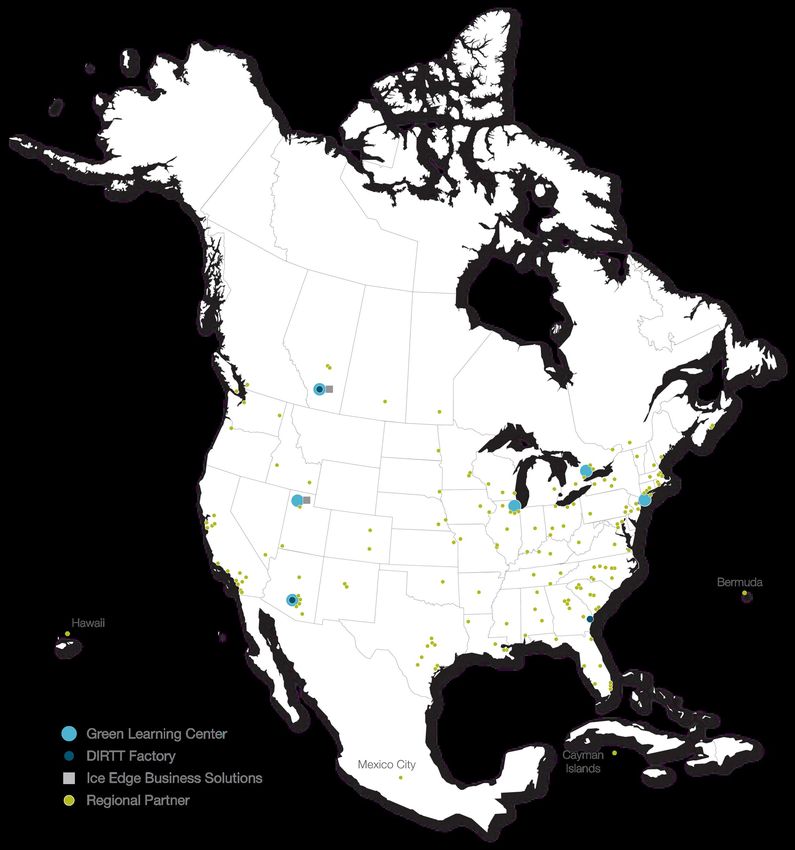
North American Reach
v
Partner Network
DIRTT solutions sold through
3 Manufacturing Facilities distributed Partner network;
supported by DIRTT sales
6 Corporate GLCs representatives.
Partners drive awareness of the
1100+ Employees DIRTT brand in the interior
construction market.
100 DIRTT Partners Allows DIRTT to work on multiple
aspects of large-scale projects at
184 Partner Locations
(With approx. 700 staff)
once; ensures tight timelines are
met and schedules reduced.
Each Partner is required to invest in a:
DIRTT Champion
DIRTT Project Manager
DIRTT Designer
Proprietary ICE® Software Package
Green Learning Center (GLC)
8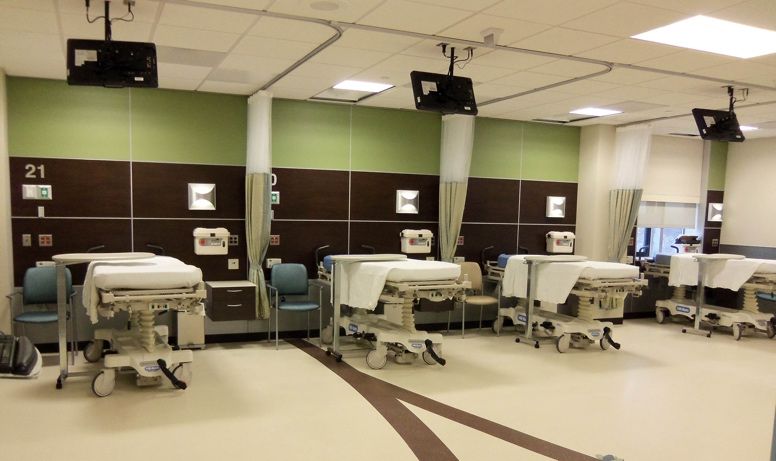
DIRTT Addresses Systemic Challenges in Construction

      Top three reasons driving change in                             DIRTT…
      today’s offsite construction environment:

                    Skilled labor shortage at                            Flips the traditional budget equation
                                                                            to reduce need for onsite labor
                              job site

                                                                         Up front, accurate price quoted prior
                   Pressure on project costs                              to order, eliminating cost overruns

                         Pressure on project                               Speed and accuracy with offsite
                             schedules                                            manufacturing

      Source: New Day, New Mindset, Rethinking Offsite Construction
      2018 FMI/CURT/CII Owner Survey

  9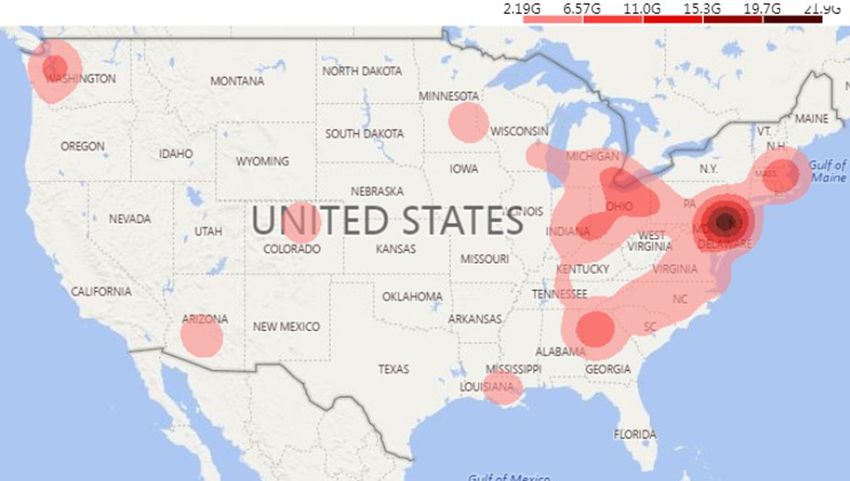
Doing It Right This Time (DIRTT)
        PLAN                           DESIGN                       MANUFACTURE                  BUILD                              USE

     Integrated process: Design, specification, pricing,                     Schedule compression: Speed and accuracy with offsite
     manufacturing, delivery and installation of a project all               manufacturing, fast and clean installation within three weeks
     coordinated from one technology file. No technology gaps                of finalizing design. Design feeds directly to production facilities,
     to manage between multiple applications.                                mitigating risk of human error and eliminating timing delays.

     Visual certainty: What you see is what you get:                         Sustainability: custom, prefab manufacturing drastically
     interactive 3D and virtual reality provides full                        reduces waste and eliminates deficiencies; modularity of
     understanding of project during design phase                            space allows long-term adaptability

     Higher quality: With faster schedule and certainty in                   Cost certainty: Immediate, accurate pricing information
     design, budget goes to higher-quality materials and finishes            available from the outset and throughout the design process
     rather than labor, re-work and contingencies

     PREDICTABLE PROCESS                                                     PREDICTABLE OUTCOMES

10
The DIRTT Process 11
Same Solution, Different Markets

      Commercial                     Healthcare
                                                            DIRTT’s dedicated industry specialists
        Largest market                  Risk averse
       Seeking price and
                                                            work with Partners to target specific
                                      Adaptability and
       schedule certainty          technology integration   business opportunities within their
        Design flexibility           Clean construction     respective markets.

                                                            Value proposition resonates across all
                                                            markets:
                                                            • Aesthetic, design and functional
                                      Education               certainty
      Government                    Budget constrained      • Price certainty
     Bureaucratic budgeting        Schedule constrained
     Value of future flexibility
                                                            • Schedule compression and certainty
                                    Constant evolution
                                        of space            • Sustainability, ability to change

12
Case Study: Healthcare
DIRTT has the broadest scope of custom prefab construction in healthcare
Healthcare interiors must adapt to advancing technology, increasingly stringent
code requirements and funding models based on patient satisfaction. DIRTT is
addressing these challenges in healthcare construction.
Revenue derived from Healthcare
$90.0
• Offsite manufacturing means fast and clean on-site
$80.0
installation that minimizes disruptions, dust, noise
CAGR 28%
and downtime within facilities $70.0 (2014 – 2018)
• Built-in infection prevention measures, reducing $60.0
touch points, hospital grade finishes, wipeable
Millions CDN$
$50.0
surfaces
Innovation: DIRTT flexible $40.0
• Enables patient-centered design
medical gas, introduced in
• Modular layers allow for integrated technology, $30.0
2017, is a proprietary,
power, data and medical gases, leading to flexibility
modular, fully approved gas $20.0
and adaptability
distribution system that can $10.0
• Easily integrates new and advanced medical
be used in DIRTT’s fully
technologies and equipment, reconfigures without $-
accessible walls. 2014 2015 2016 2017 2018
downtime, dust or disruption
13Leadership
Kevin O’Meara Geoff Krause
Chief Executive Officer Chief Financial Officer
• Joined DIRTT in September 2018 • Joined DIRTT in May 2018
• Extensive operating experience in • 25 years of financial management
building products industry including experience at public and private
co-founding and scaling Builders growth companies
FirstSource (NASDAQ: BLDR) • Joined from Pure Technologies after
• 20 years’ experience in construction- its successful sale to Xylem Inc. in
related industries, including as January 2018
president and CEO of Atrium
Corporation
14Leadership
CEO
Kevin O’Meara
Chief Chief Senior VP, Senior VP,
Director of Senior VP,
CFO Commercial Operating Software General VP, Sales
Innovation Talent
Officer Officer Development Counsel
Geoff Geoff In process Jeffrey Mark Joe Krista Pell Kingsley
Krause Gosling Calkins Greffen Zirkman Koch
15Near-Term Priorities
Finalize new Thorough operational Identify opportunities for
organizational structure analysis to identify income statement
opportunities for leverage
efficiency improvements
and to determine
required future capital
investments
Improve working capital Prepare for US listing, Complete three- to five- Continue to drive
efficiency and anticipated in 2019 year strategy and innovation
conversion speed business plan including
detailed execution
milestones
16Revenue and Adjusted EBITDA Margin (TTM)
$400,000 18.0%
$350,000 16.0%
14.0%
$300,000
12.0%
Revenue continuing upward
$250,000 trajectory
10.0%
$200,000
8.0% Financial discipline and
$150,000 revenue growth in 2018
6.0%
resulting in Adjusted EBITDA
$100,000
4.0% leverage
$50,000 2.0%
$- 0.0%
Q1/15 Q2/15 Q3/15 Q4/15 Q1/16 Q2/16 Q3/16 Q4/16 Q1/17 Q2/17 Q3/17 Q4/17 Q1/18 Q2/18 Q3/18 Q4/18
TTM Revenue ('000) TTM Adj EBITDA%
17Revenue and Adjusted Gross Profit %
$120,000 50.0%
Revenue is variable
45.0%
$100,000
40.0%
$80,000
35.0% Quarterly Adjusted Gross Profit % range
30.0% of 41.9% - 46.1%
$60,000 25.0%
Q4 2018 Adjusted Gross Profit %
20.0%
$40,000
impacted by rise in tile defects
15.0%
• Occurrence is intermittent and isolated to a
10.0% small number of projects
$20,000
5.0%
• Cause identified and resolution pending
$- 0.0%
Q1/15 Q2/15 Q3/15 Q4/15 Q1/16 Q2/16 Q3/16 Q4/16 Q1/17 Q2/17 Q3/17 Q4/17 Q1/18 Q2/18 Q3/18 Q4/18
Revenue ('000) Adj GP % Linear ( Revenue ('000) )
18Adjusted Operating Expenses and Adjusted Operating Expense %
$35,000 50%
45%
$30,000
40% Adjusted operating expenses
$25,000
stabilized in 2018
35%
$20,000
30%
Adjusted operating expenses as a
25% percentage of revenue
$15,000
20%
meaningfully lower in 2018
$10,000 15%
Current levels expected to support
10% revenue growth through 2019 with
$5,000
5% only moderate increases
$- 0%
Q1/15 Q2/15 Q3/15 Q4/15 Q1/16 Q2/16 Q3/16 Q4/16 Q1/17 Q2/17 Q3/17 Q4/17 Q1/18 Q2/18 Q3/18 Q4/18
Adj Operating Expenses ('000) Adj Operating Expenses %
19Large Underpenetrated
Addressable Market Superior Proven Process
(up to US$150B in North America)
Key Takeaways
Inflection Point in
DIRTT’s Evolution as
Financial Strength
New Management Implements
Enhancements for Future Growth
Guidance: 2019 a transition year with 5%-10% revenue growth;
corresponding increases in net income and Adjusted EBITDA
20Appendix 21
Summary of Consolidated Financial Results
($ thousands, except per share amounts)                                        Q4 2018              Q4 2017            % Change                     2018                  2017   % Change
Revenue                                                                          98,660                74,337                      33           356,679              293,424           22
Gross profit                                                                     39,680                29,780                      33           149,823              122,544           22
Gross profit %                                                                    40.2%                 40.1%                        -            42.0%                 41.8%            -
Adjusted gross profit1                                                           41,354                31,522                      31           157,263              127,716           23
Adjusted gross profit %1                                                          41.9%                 42.4%                     (1)             44.1%                 43.5%           1
Operating Expenses                                                               39,431                37,553                       5           148,483              128,352           16
Operating Expenses %                                                              40.0%                 50.5%                   (21)              41.6%                 43.7%          (5)
Adjusted Operating Expenses1                                                     27,389                32,585                   (16)            105,113              110,921           (5)
Adjusted Operating Expenses %1                                                    27.8%                 43.8%                   (37)              29.5%                 37.8%         (22)
Operating income                                                                      249             (7,773)                     NA               1,340               (5,808)        NA
Adjusted EBITDA1                                                                 17,493               (1,006)                     NA              56,171               15,844         255
Adjusted EBITDA %1                                                                17.7%                (1.4)%                     NA              15.7%                   5.4%        191
Income tax expense (recovery)                                                       (230)                (507)                  (55)               1,518                 1,504          1
Net income (loss)                                                                  3,524              (7,316)                     NA               2,997               (7,409)        NA

Net income (loss) per share - basic and diluted                                      0.04               (0.09)                    NA                 0.04               (0.09)        NA
1 See “Non-IFRS Measures”
2 In 2018, Sales, General and Administrative expenses were separated into functions (Sales & Marketing, General & Administration, Operations, and Technology & Development).
Operating Expenses is the sum of these functions and equals 2017 SG&A.

 22
Additional Financial Highlights
(in thousands)                                              12/31/2018   12/31/2017
Cash and cash equivalents                                    72,865        79,641
Trade and other receivables                                  59,852        24,133
Inventory                                                     25,442       24,297
Property, plant and equipment1                               50,104        60,860
Intangible assets1                                            18,992       24,718
Trade accounts payable and other liabilities                 42,673        34,599
Other current liabilities                                     9,262        3,494
Current portion of long-term debt2                            3,411        5,715
Long-term debt2                                               4,263        7,057

(in thousands)                                                2018         2017
Net cash flows provided by operating activities before
                                                             42,105       10,497
changes in non-cash working capital
Net cash flows provided by operating activities              15,976       29,107
Capital expenditures                                         19,081       29,229
1) Reduced by $20 million current year impairment charges
2) Repaid on January 31, 2019

 23
Market Data Ticker TSX:DRT Shares outstanding 84.5 million (at December 31, 2018) Shares outstanding – fully diluted 91.5 million (at December 31, 2018) 52-week trading range $4.39 - $7.75 (at March 15, 2019) Market capitalization $532 million (at March 15, 2019) 24
You can also read