Super 7 Picks - March 2019
←
→
Page content transcription
If your browser does not render page correctly, please read the page content below
Super 7 Picks - March 2019
BP WEALTH

Techno Funda Report - March 2019

                                                         Index

Company                        Recommendation Price (Rs) Entry Range (Rs) Target Price (Rs)   Stop Loss (Rs)   Page No.

Bank of India                        Buy            88           CMP-83            103             79            1

Bharat Forge Ltd                     Buy           517           505-490           588             468           2

Can Fin Homes Ltd                    Buy           277           CMP-265           340             249           3

Godrej Industries Ltd                Buy           494           CMP-480           565             460           4

Grasim Industries Ltd                Buy           792           CMP-760           920             720           5

Jet Airways (India) Ltd              Buy           233           CMP-215           285             205           6

Jindal Steel & Power Limited         Buy           161           153-147           184             138           7

                                                                                               Research Team
                                                                                               research@bpwealth.com
 5th March, 2019                                                                               022-61596406

                                      BP Equities Private Limited (w ww .bpw ealth.com)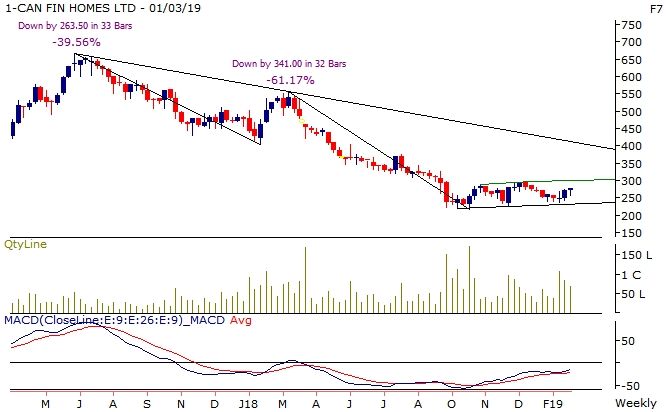
BP WEALTH

Techno Funda Report - March 2019

                                            Performance Tracker

                                       Performance Tracker September 2018
Sr. No. Company                     Recommendation         Reco Price (Rs)      Target Price (Rs)         Status
  1   Apollo Hospitals                     Buy               1140-1100                  1300        Stoploss Triggered
  2   Cummins                              Buy                 750-730                  860         Profit booked at 795
  3   Grasim                               Buy               1068-1040                  1190            Exit at 1022
  4   MOIL                                 Buy                   184                    220         Stoploss Triggered
  5   Sun Pharmaceuticals Ind Ltd          Buy                 653-630                  760             Exit at 623
  6   Torrent Power Ltd                    Buy                 255-245                  305         Profit booked at 272
  7   TVS Motor                            Buy                 569-550                  650         Profit booked at 599

Techno Funda Return For Sept, 2018 : -1.04% , Nifty Return For Sept, 2018 : -6.4%

                                        Performance Tracker October 2018
Sr. No. Company                     Recommendation         Reco Price (Rs)      Target Price (Rs)         Status

  1   ACC                                  Buy               1530-1460                  1680        Stoploss Triggered

  2   Asian Paints                         Buy                  1261                    1400        Stoploss Triggered
  3   Coal India                           Buy                   279                    310         Stoploss Triggered
  4   Cummins India                        Buy                680-650                   740          Target Achieved
  5   ICICI Bank                           Buy                319-310                   360             Exit at 319
  6   ITC                                  Buy                   275                    310         Profit booked at 290
  7   NMDC                                 Buy                111-107                   132         Profit booked at 115

Techno Funda Return For Oct, 2018 : 0.41% , Nifty Return For Oct, 2018 : 0.80%

                                    BP Equities Private Limited (w ww .bpw ealth.com)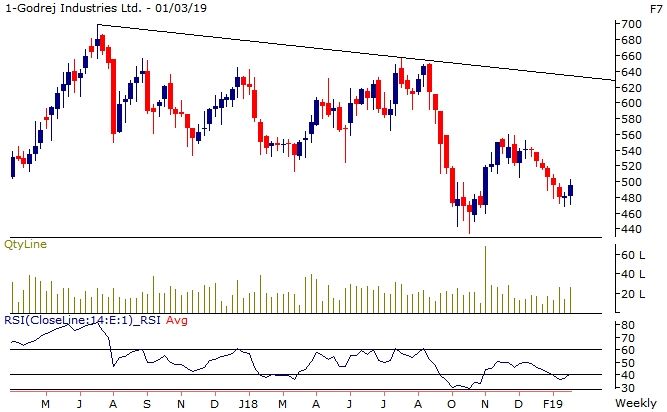
BP WEALTH

Techno Funda Report - March 2019

                                     Performance Tracker November 2018
Sr. No. Company                   Recommendation         Reco Price (Rs)      Target Price (Rs)          Status
  1   ABB India Ltd                      Buy                1318-1280                 1540        Profit booked at 1409
  2   Ashok Leyland                      Buy                117.7-113                 142          Stoploss Triggered
  3   Cummins India                      Buy                 768-740                  910         Profit booked at 807
  4   DLF                                Buy                 165-160                  200         Profit booked at 180
  5   Federal Bank                       Buy                 82.4-78                   97         Profit booked at 85.3
  6   Havells                            Buy                 646-625                  730         Profit booked at 697
  7   VEDL                               Buy                208.9-201                 258              Exit at 196

Techno Funda Return For Nov, 2018 : 3.17% , Nifty Return For Nov, 2018 : 3.1%

                                     Performance Tracker December 2018
Sr. No. Company                   Recommendation         Reco Price (Rs)      Target Price (Rs)          Status
  1   Apollo Hospitals                   Buy               1265-1220                  1450         Stoploss Triggered
  2   Century Textiles                   Buy                 921-880                  1030        Profit booked at 919
  3   Federal Bank                       Buy                 85.3-82                  100          Profit booked at 94
  4   Godrej Consumer Products           Buy                   730                    845           Target Achieved
  5   Lupin                              Buy                 887-850                  1050         Stoploss Triggered
  6   Siemens                            Buy                 951-920                  1100        Profit booked at 1043
  7   Torrent Power                      Buy                 271-259                  320          Stoploss Triggered

Techno Funda Return For Dec, 2018 : 2.86% , Nifty Return For Dec, 2018 : -0.6%

                                      Performance Tracker January 2019
Sr. No. Company                   Recommendation         Reco Price (Rs)      Target Price (Rs)          Status
  1   Bajaj Auto ltd                     Buy                  2734                    3100         Stoploss Triggered
  2   Bharti Airtel ltd                  Buy                 310-322                  380              Exit at 312
  3   Canara Bank                        Buy                 272-283                  324          Stoploss Triggered
  4   Cummins India Ltd                  Buy                 810-832                  970              Exit at 796
  5   Engineers India Ltd                Buy                 122-127                  153          Stoploss Triggered
  6   Indraprastha Gas Ltd               Buy                 269-278                  320         Profit booked at 290
  7   ONGC Ltd                           Buy                   146                    173              Exit at 142

Techno Funda Return For Jan, 2019 : -3.00% , Nifty Return For Jan, 2019 : 1.60%

                                  BP Equities Private Limited (w ww .bpw ealth.com)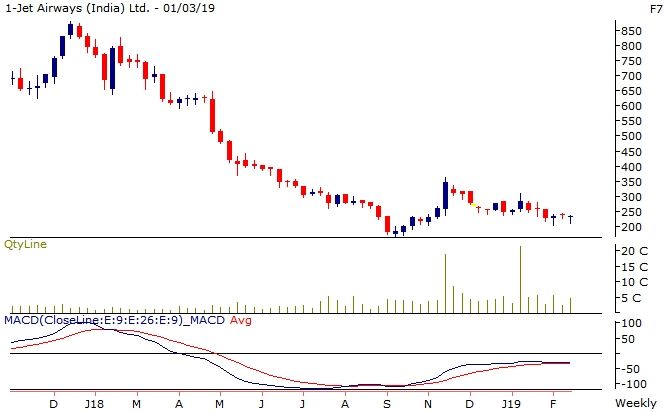
2nd Feb ,

Bank Of India                                                                                 Buy
                                                                                                                           BP WEALTH

BFSI

                                   Technical View (Weekly Chart)                                          Execution Data
                                                                                                          Target (Rs)                         103
                                                                                                          Stop loss (Rs)                       79
                                                                                                          Buying Range (Rs)              CMP-83
                                                                                                          Last Close Price (Rs)                88
                                                                                                          % change Weekly                    5.42
                                                          Bullish reversal candlestick at
                                                          upsloping trend line near lower
                                                          end of the sideway range                        Weekly Oscillator Direction

                                                                                                          13 WMA                     Downwards

                                                                                                          21 WMA                     Downwards
                                                                                                          50 WMA                     Downwards
                                                                                                          RSI                     Sideways Mode
                                                                                                          MACD                    Sideways Mode

                                              RSI reversed from its oversold zone

Technical View                                                                                            Sector Outlook                  Neutral
                                                                                                          Stock
After the sharp down move from 216 to 76 the stock is moving sideways for the past couple of
                                                                                                          BSE code                          532149
months. Recently the stock has formed Bullish reversal candlestick at the upsloping trend line which
                                                                                                          NSE Symbol                    BANKINDIA
is a bullish signal for short term trend, also the recent trough coincides with lower of the sideways
                                                                                                          Bloomberg                         BOI IN
range the stock is moving for past few months which increases the reliability of the recent trough to
                                                                                                          Reuters                          BOI.BO
act as strong support for short term trend. RSI has also reversed from its oversold zone which is a
                                                                                                          Key Data
bullish signal for short term trend. We recommend to BUY BANKINDIA in the range of CMP-83 for
                                                                                                          Nifty                             10,863
the target of 103 with a stop loss of 79 in short term.
                                                                                                          52WeekH/L(Rs)                     118/73
Investment Rationale
                                                                                                          O/s Shares (Rs mn)                2696.7
RBI lifts restriction on bank’s operation                                                                 Market Cap (Rs bn)                 236.5

Bank of India’s exit from RBI’s prompt corrective action (PCA) framework is very positive. The bank’s     Face Value (Rs)                         10
net non performing loan (NPL) ratios and capital – two of the four parameters that the RBI tracks as      Average volume
part of the PCA improved significantly in Q3FY19. This would remove some lending restriction and          3 months                      1,22,75,600
help to build quality loan book. In December 2018, Government of India infused around Rs.10000 crs        6 months                      1,10,66,870
into PSU banks of which BOI received Rs.4500 crs from it. The capital helped bank to significantly        1 year                        1,08,00,610
increase their loan loss coverage and reduce their NPL ratio below the trigger point for PCA inclu-
sion.

Slippages are normalizing and recovery is on track

Bank of India reported reduction in fresh slippages at 2916 crs in Q3 FY19 against 17789 crs in previ-
ous year. Whereas, there was improvement in recovery which stood at Rs. 2353 crs. in Q3 FY19 as
against 1178 cr in previous year. Bank has improved its asset quality with net non performing assets
(NPAs) trimming down to 5.87% of the net advances as against 10.3% in the previous year.

                                                                                                                                              1
2nd Feb ,
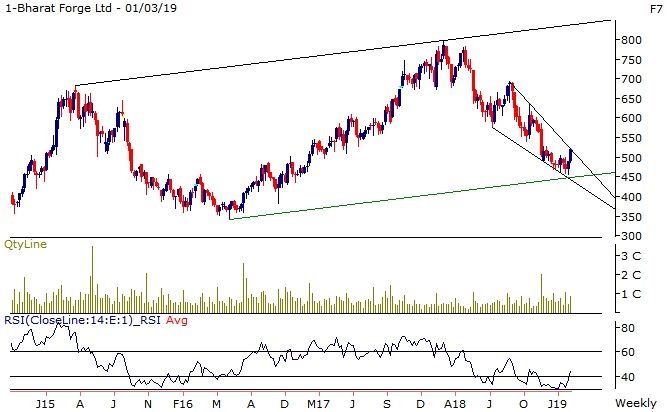
Bharat Forge Ltd. Buy
BP WEALTH
Casting & Forgings
Technical View (Weekly Chart) Execution Data
Target (Rs) 588
Surpassed down sloping trend line after Stop loss (Rs) 468
forming Bullish reversal candlestick earlier Buying Range (Rs) 505-490
Last Close Price (Rs) 517
% change Weekly 6.24
Weekly Oscillator Direction
13 WMA Upwards
21 WMA Downwards
50 WMA Downwards
RSI Sideways mode
MACD Sideways Mode
Technical View Sector Outlook Neutral
Stock
The stock has reversed after forming bullish reversal candlestick near down sloping trend line which
BSE code 500493
is a bullish signal for short term trend. Also the recent trough is formed near lower trend line which is
NSE Symbol BHARATFORG
drawn parallel to the upper trend line and it has surpassed down sloping trend line with supportive
volumes which is a bullish signal for short term trend. RSI has reversed from its oversold zone and Bloomberg BHFC IN
has surpassed down sloping trend line which is a bullish signal for short term trend. We recommend Reuters BFRG.BO
to BUY BHARATFORG in the range of 505-490 for the target of 588 with a stop loss of 468 in short Key Data
term. Nifty 10,863
Investment Rationale 52WeekH/L(Rs) 785/452
O/s Shares (Rs mn) 465
Performance in sweet spot as all segments in upward trajectory
Market Cap (Rs bn) 241.8
Bharat Forge (BFL) is India’s largest forging company with a global manufacturing footprint spread
Face Value (Rs) 2
across India, Germany, Sweden, the US and France. The company has strong metallurgical knowl-
edge, design and engineering capability and manufacturing prowess. It is one of the few listed Tier-1.5 Average volume
manufacturers in India focusing on supplying high-end engineered forgings products The company has 3 months 17,86,130
a total capacity of 625,000 MT as of FY18. In terms of business segments, the CV segment remains a 6 months 15,94,190
major revenue driver at ~45% while other segments are PV, oil & gas, power, railways, etc. In terms of 1 year 13,87,180
non-auto share, share of the business has risen to ~43% much ahead of the targeted ~40%.
Margins to remain strong with value addition
BFL is one of the best in terms of operating efficiency and value addition in the whole Indian forgings
space. The content enrichment as well business mix change accounting for exports have led to a
sharp EBIDTA margin increase reflected in ASP jump from ~INR 1.7 lakh/t in FY12 to ~INR 2.1 lakh/t
in FY18. Going ahead, as demand increases and utilisation levels improve, we build in standalone
EBITDA margins of 29.5% for FY20E. Consolidated EBITDA margins are expected at 22.5% in FY20E
2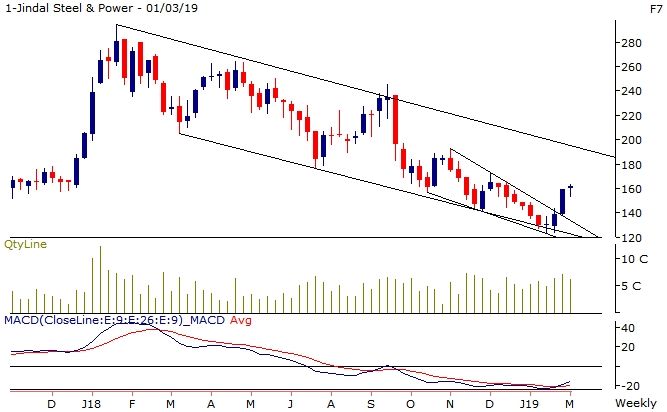
2nd Feb ,

Can Fin Homes Ltd.                                                                             Buy
                                                                                                                            BP WEALTH

Housing Finance

                                  Technical View (Weekly Chart)                                            Execution Data
                                                                                                           Target (Rs)                        340
                                                                                                           Stop loss (Rs)                     249
                                                                                                           Buying Range (Rs)             CMP-265
                                                                                                           Last Close Price (Rs)              277
                                                                                                           % change Weekly                   2.20

                                                                                                           Weekly Oscillator Direction
                                                   Bullish Reversal Candlesticks                           13 WMA                        Upwards
                                                   near support zone
                                                                                                           21 WMA                        Upwards
           Stock has completed Bullish ABCD Harmonic pat-
           tern and reversed from lower end of Parallel channel                                            50 WMA                     Downwards
                                                                                                           RSI                     Sideways Mode
                                                                                                           MACD                          Buy Mode

                                        MACD is resuming its up move after
                                        converging around its moving average

                            RSI has formed positive divergence

Technical View                                                                                             Sector Outlook                  Neutral
The stock has reversed after completing bullish ABCD harmonic pattern which is bullish signal for          Stock
medium term trend. Post that stock been trading in parallel rising channel and recently has revered        BSE code                         511196
taking from lower end of the channel trend line and is now expected to head higher initially towards
                                                                                                           NSE Symbol               CANFINHOME
upper end of channel trend line. MACD had earlier given a bullish crossover and is now resuming its
                                                                                                           Bloomberg                       CANF IN
up move after converging around its average which compliments the bullish view of price. We recom-
mend to BUY CANFINHOME in the range of CMP-265 for the target of 340 with a stop loss of 249 in            Reuters                        CNFH.BO
short term.                                                                                                Key Data
                                                                                                           Nifty                            10,863
Investment Rationale
                                                                                                           52WeekH/L(Rs)                   557/217
Stable operating performance despite a challenging environment imputes confidence
                                                                                                           O/s Shares (Rs mn)                  133
For Q3FY19, the company was able to report consistent NIMs at 3.2% on a QoQ basis with a slight
                                                                                                           Market Cap (Rs bn)                  36.7
improvement in NII growing at 7% YoY. This was commendable as Can Fin was able to hold up in an
adverse liquidity environment when many of the company’s peers were struggling to stay afloat due          Face Value (Rs)                          2
to lack of liquidity and subsequently constraining their ability to lend-marginal cost of borrowings at    Average volume
8% in Q3FY19 compared to 7.9% in the preceding quarter . We feel that the company’s parentage
                                                                                                           3 months                       13,81,320
coupled with strong balance sheet and financials would continue to support operations, specially in
such situations. Profitability also remains intact with ROA of 1.9% and ROE of 21.4% for the period        6 months                       15,60,490
and expect the company to maintain profitability going ahead by calibrating growth and focusing in         1 year                         13,63,140
select regions to prevent margin compression.

Focus on Non-metros to drive growth while granular retail focused portfolio provides safety
In the light of intensifying competition from banks and NBFCs specially in the metros and Tier –1 cit-
ies the company has been growing its presence in tier 2 and lower markets to strengthen and estab-
lish its foothold. Can Fin plans to open 30 branches in non metros clustered around Karnataka and
Tamil Nadu and its branch network remains heavily skewed towards non metros with 109 branches
and 66 branches in metros as of Q3FY19.Since the portfolio comprises majorly of salaried individuals
with small ticket sizes we expect the asset quality to remain stable and not spew any negative sur-
prises going ahead.

                                                                                                                                              3
2nd Feb ,
Godrej Industries Ltd. Buy
BP WEALTH
Diversified
Technical View (Weekly Chart) Execution Data
Target (Rs) 565
Stop Loss (Rs) 460
Buying Range (Rs) CMP-480
Last Close Price (Rs) 494
% change Weekly 2.75
Weekly Oscillator Direction
13 WMA Downwards
21 WMA Downwards
50 WMA Downwards
Morning Star candlestick pattern RSI Sideways Mode
near 61.8% retracement MACD Sideways Mode
Technical View
Sector Outlook Positive
The stock has formed Morning star a bullish reversal candlestick pattern which suggests the short
Stock
term trend to turn bullish, also the recent trough coincides with 61.8% retracement level of its inter- BSE code 500164
mediate up move which increases the reliability of the recent trough to act as strong support for short
NSE Symbol GODREJIND
term trend. RSI has reversed from its oversold zone which is a bullish signal and compliments the
Bloomberg GDSP IN
bullish view of price. We recommend to BUY GODREJIND in the range of CMP-480 for the target of
Reuters GODI.BO
565 with a stop loss of 460 in short term.
Key Data
Nifty 10,863
Investment Rationale 52WeekH/L(Rs) 656/434
Diverse business segments reduce dependence on single business O/s Shares (Rs mn) 336
On a consolidated basis, GIL is a conglomerate with interests and leadership positions across diverse Market Cap (Rs bn) 166.5
areas. Its standalone business is structured into three major business divisions (oleochemicals, estate Face Value (Rs) 1
management, and finance and investments). However, on a consolidated basis, its interests are Average volume
spread across diverse business areas (including property development, oil palm plantation, animal
3 months 3,90,580
feeds and agri-inputs, dairy, personal care, household care, and high-end grocery retailing, among
6 months 4,72,460
others), through its subsidiaries, associate companies and JVs. It enjoys leadership position in oleo-
1 year 5,13,600
chemical industry with prominent position in various sub segments.
Embedded value of investment portfolio significantly higher than book value
The company has a sizeable market value buffer on its investments (excess of market value over the
book value of investments amounted to ~Rs. 29,216 crore as on September 30, 2018). This supports
GIL's capital structure and imparts significant liquidity support. The company has a track record of
monetising these investments (as reflected in the recent divestment in GAVL) to support its cash flows,
a trend expected to continue.
42nd Feb ,
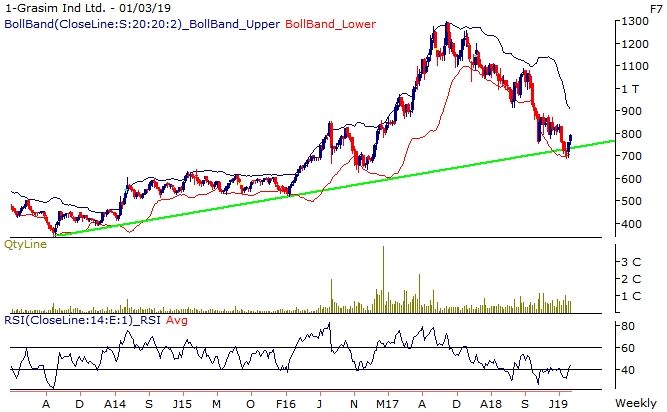
Grasim Industries Ltd. Buy
BP WEALTH
Diversified
Technical View (Weekly Chart) Execution Data
Target (Rs) 920
Stop loss (Rs) 720
Buying Range (Rs) CMP-760
Last Close Price (Rs) 792
% change Weekly 4.37
Weekly Oscillator Direction
13 WMA Upwards
21 WMA Downwards
Reversed from cluster of support
50 WMA Downwards
RSI Buy Mode
MACD Buy Mode
RSI has formed positive divergence with price
Technical View Sector Outlook Neutral
The stock has reversed after forming bullish reversal candlestick near long-term rising trend line Stock
which is drawn connecting significant troughs, also the recent trough coincides with 78.6% retrace- BSE code 500300
ment levels of its previous advance from 517 to 1300 levels which increases the reliability of the re-
NSE Symbol GRASIM
cent trough to act as strong support for short term trend. RSI and Bollinger has formed positive diver-
Bloomberg GRASIM IN
gence with price which is bullish signal and compliment bullish view of price. We recommend to BUY
GRASIM in the range of CMP-760 for the target of 920 with a stop loss of 720 in short term. Reuters GRAS.BO
Key Data
Nifty 10,863
Investment Rationale
52WeekH/L(Rs) 1,164/688
Strong growth outlook for VSF business
O/s Shares (Rs mn) 657
Grasim is a pioneer in the viscose staple fibre (VSF) business with an aggregate capacity of 498
ktpa. Grasim’s VSF business commands 9% market share globally. It is continuously focusing on Market Cap (Rs bn) 520.4
increasing the usage of VSF in India by leveraging its Brand Liva and enriching the product mix Face Value (Rs) 2
through a larger share of specialty fibre. The company is expected to focus on its viscose staple fibre Average volume
(VSF) business to register growth and expand its market in India. Going ahead, bulk of the growth in
3 months 13,86,980
the textile business is expected to come from the company’s VSF business in the future. Therefore,
6 months 14,50,280
strong growth in textile industry, where Grasim is well placed would augur well for the company.
1 year 12,50,160
Cement sector up-cycle expected by industry players
Cement companies’ focus on capacity additions and fight for market share gain make us believe that
the industry up-cycle is still 1.5-2 years away. The urge to gain market share has put pressure on
cement prices since CY18. Cement industry is expected to commission ~52mt of new capacities be-
tween FY19E and FY21E. Grasim Industries being holding company of India's largest cement player
- Ultratech cement, is poised to benefit from the expected up-cycle.
52nd Feb ,
Jet Airways (India) Ltd. Buy
BP WEALTH
Aviation
Technical View (Weekly Chart) Execution Data
Target (Rs) 285
Stop loss (Rs) 205
Buying Range (Rs) CMP-215
Last Close Price (Rs) 233
% change Daily 1.02
Bullish reversal candlestick at
Weekly Oscillator Direction
78.6% retracement
13 WMA Downwards
21 WMA Downwards
50 WMA Downwards
RSI Sideways Mode
MACD Buy Mode
Resuming up move after taking
support at down sloping trend line
MACD is resuming its up move after
converging around its moving average
Support at rising trend line
Technical View Sector Outlook Positive
The stock has been taking support at 78.6% retracement levels of its previous advance from 163 to Stock
367 and near the same juncture stock has formed multiple bullish reversal candlestick pattern which BSE code 532617
indicates recent trough to act as strong support and short term trend to turn bullish. MACD had earlier
NSE Symbol JETAIRWAYS
given a bullish crossover and is now resuming its up move after converging around its average which
compliments the bullish view of price. We recommend to BUY JETAIRWAYS in the range of CMP- Bloomberg JETIN IN
215 for the target of 285 with a stop loss of 205 in short term. Reuters JET.BO
Key Data
Investment Rationale Nifty 10,863
Approval of restructuring plans to shot in the arm for liquidity and can kick-start growth 52WeekH/L(Rs) 751/163
Based on this plan, we expect jet airways to generate positive cash flow of INR3bn over FY19- 21 O/s Shares (Rs mn) 113.6
versus our previous estimate of negative cash flow of INR28.7bn. Interest coverage will improve to Market Cap (Rs bn) 26.6
1.2/2.2x in FY20E/FY21E versus our earlier estimate of 0.9/1.6x owing to lower interest outgo on
Face Value (Rs) 10
account of the reduction in debt as well as borrowing cost (down 50bps due to repayment of costlier
debt). Z-score (an indicator of bankruptcy risk) for FY20 will thus improve to 2.35 from 0.91. Factoring Average volume
in FY20/FY21E oil prices at USD65/75/bbl and PAX growth of 2%/5%, we estimate jet airways to 3 months 8,26,13,810
generate positive operating cash flow of INR27bn over the next two years. We, therefore, believe the 6 months 15,31,02,870
company will scale up its fleet capacity, which has been stagnant (100–110 planes) since 2012. An
1 year 21,01,09,000
uptick in PAX growth will drive a significant re-rating of the stock—5% change in PAX growth will lead
to 17% earnings revision.
To cut down on loss-making routes and realign capacity
Given the heightened competition in the domestic market, Jet airways plans to rework its network
and align capacity towards less competitive routes, especially in the international market – in Q2,
domestic capacity grew by only ~1% whereas international capacity was up ~11%. This is evident in
the improvement in the pricing scenario in the international segment, which witnessed improvement
in RASK while the domestic market continued to face more pressure.
62nd Feb ,
Jindal Steel & Power Ltd. Buy
BP WEALTH
Steel and Power
Technical View (Weekly Chart) Execution Data
Target (Rs) 184
Stop loss (Rs) 138
Breakout from falling Wedge price
Buying Range (Rs) 153-147
pattern after taking support at
lower trend line of channel Last Close Price (Rs) 161
% change Weekly 1.51
Weekly Oscillator Direction
13 WMA Upwards
21 WMA Upwards
50 WMA Upwards
RSI Sideways Mode
MACD Buy Mode
MACD has given positive crossover after good
amount of time
Technical View Sector Outlook Neutral
Stock
The stock has given breakout from Falling wedge a bullish reversal price pattern which suggests the
BSE code 532286
short term trend to turn bullish. Also the recent trough coincides with the lower trend line of the down
NSE Symbol JINDALSTEL
sloping channel which increases the reliability of the recent trough to act as strong support for me-
Bloomberg JSP IN
dium term trend. MACD has given a bullish crossover after long time which is a bullish signal for short
Reuters JNSP.BO
term trend. We recommend to BUY JINDALSTEL in the range of 153-147 for the target of 184 with a
Key Data
stop loss of 138 in short term.
Nifty 10,863
52WeekH/L(Rs) 265/123
Investment Rationale O/s Shares (Rs mn) 967
Downstream capacity ramp up to improve margins Market Cap (Rs bn) 156.3
The 1.2mtpa plate mill has been operating at utilisation of ~85% over the past two months. Besides, Face Value (Rs) 1
the plates being produced are high-tensile and a premium variant that typically fetches better mar- Average volume
gins. We also saw the bar rod mill (BRM) operating at rated capacity. Furthermore, a spurt in logistics 3 months 1,30,46,800
is evident vis-a-vis our previous two visits, indicating robust sales. We expect the ramp-up of down- 6 months 1,26,88,830
stream capacity to improve margins. 1 year 1,13,02,350
Going forward optimum utilization of Angul plant to improve efficiency
Angul achieving 5mtpa production through commencement of production from 1.8mtpa DRI plant by
mid March and slated to achieve 11000tpd by end of this financial year. Post commissioning, the
management expects to increase production from 5.2 MT to 6.5MT in FY20
7BP WEALTH
Research Desk Tel: +91 22 61596406
Institutional Sales Desk Tel: +91 22 61596403/04/05
Disclaimer Appendix
Analyst (s) holding in the Stock : Nil
Analyst (s) Certification:
We analysts and the authors of this report, hereby certify that all of the views expressed in this research report accurately reflect our per-
sonal views about any and all of the subject issuer (s) or securities. We also certify that no part of our compensation was, is, or will be
directly or indirectly related to the specific recommendation (s) or view (s) in this report. Analysts aren't registered as research analysts by
FINRA and might not be an associated person of the BP Equities Pvt. Ltd. (Institutional Equities).
General Disclaimer
This report has been prepared by the research department of BP EQUITIES Pvt. Ltd, is for information purposes only. This report is not
construed as an offer to sell or the solicitation of an offer to buy or sell any security in any jurisdiction where such an offer or solicitation
would be illegal.
BP EQUITIES Pvt. Ltd have exercised due diligence in checking the correctness and authenticity of the information contained herein, so
far as it relates to current and historical information, but do not guarantee its accuracy or completeness. The opinions expressed are our
current opinions as of the date appearing in the material and may be subject to change from time to time. Prospective investors are cau-
tioned that any forward looking statement are not predictions and are subject to change without prior notice.
Recipients of this material should rely on their own investigations and take their own professional advice. BP EQUITIES Pvt. Ltd or any of
its affiliates or employees shall not be in any way responsible for any loss or damage that may arise to any person from any inadvertent
error in the information contained in this report. BP EQUITIES Pvt. Ltd. or any of its affiliates or employees do not provide, at any time, any
express or implied warranty of any kind, regarding any matter pertaining to this report, including without limitation the implied warranties of
merchantability, fitness for a particular purpose, and non-infringement. The recipients of this report should rely on their own investigations.
BP EQUITIES Pvt. Ltd and/or its affiliates and/or employees may have interests/ positions, financial or otherwise in the securities men-
tioned in this report. Opinions expressed are our current opinions as of the date appearing on this material only. While we endeavor to
update on a reasonable basis the information discussed in this material, there may be regulatory, compliance, or other reasons that pre-
vent us from doing so.
This report is not directed to or intended for display, downloading, printing, reproducing or for distribution to or use by any person in any
locality, state and country or other jurisdiction where such distribution, publication or use would be contrary to the law or regulation or
would subject to BP EQUITIES Pvt. Ltd or any of its affiliates to any registration or licensing requirement within such jurisdiction.
Corporate Office: Registered Office:
4th floor, 24/26, 1st Floor, Cama Building,
Rustom Bldg, Dalal street, Fort,
29, Veer Nariman Road, Fort, Mumbai-400001
Mumbai-400001
BP Equities Pvt. Ltd.
Phone- +91 22 6159 6464
CIN No: U67120MH1997PTC107392
Fax-+91 22 6159 6160
Website- www.bpw ealth.comYou can also read