ANTARCTIC CLIMATE CHANGE DURING THE LAST 50 YEARS
←
→
Page content transcription
If your browser does not render page correctly, please read the page content below
INTERNATIONAL JOURNAL OF CLIMATOLOGY
Int. J. Climatol. 25: 279–294 (2005)
Published online 11 February 2005 in Wiley InterScience (www.interscience.wiley.com). DOI: 10.1002/joc.1130
ANTARCTIC CLIMATE CHANGE DURING THE LAST 50 YEARS
JOHN TURNER,a, * STEVE R. COLWELL,a GARETH J. MARSHALL,a TOM A. LACHLAN-COPE,a
ANDREW M. CARLETON,b PHIL D. JONES,c VICTOR LAGUN,d PHIL A. REIDe and SVETLANA IAGOVKINAf
a British Antarctic Survey, Natural Environment Research Council, Cambridge CB3 0ET, UK
b College of Earth and Mineral Sciences, Pennsylvania State University, University Park, PA, USA
c Climatic Research Unit, University of East Anglia, Norwich, UK
d Arctic and Antarctic Research Institute, St Petersburg, Russia
e National Climate Centre, Bureau of Meteorology, Melbourne, Australia
f Department of Dynamical Meteorology, Main Geophysical Observatory, St Petersburg, Russia
Received 25 March 2004
Revised 9 September 2004
Accepted 9 September 2004
ABSTRACT
The Reference Antarctic Data for Environmental Research (READER) project data set of monthly mean Antarctic near-
surface temperature, mean sea-level pressure (MSLP) and wind speed has been used to investigate trends in these quantities
over the last 50 years for 19 stations with long records. Eleven of these had warming trends and seven had cooling trends
in their annual data (one station had too little data to allow an annual trend to be computed), indicating the spatial
complexity of change that has occurred across the Antarctic in recent decades. The Antarctic Peninsula has experienced
a major warming over the last 50 years, with temperatures at Faraday/Vernadsky station having increased at a rate of
0.56 ° C decade−1 over the year and 1.09 ° C decade−1 during the winter; both figures are statistically significant at less
than the 5% level. Overlapping 30 year trends of annual mean temperatures indicate that, at all but two of the 10 coastal
stations for which trends could be computed back to 1961, the warming trend was greater (or the cooling trend less)
during the 1961–90 period compared with 1971–2000. All the continental stations for which MSLP data were available
show negative trends in the annual mean pressures over the full length of their records, which we attribute to the trend in
recent decades towards the Southern Hemisphere annular mode (SAM) being in its high-index state. Except for Halley,
where the trends are constant, the MSLP trends for all stations on the Antarctic continent for 1971–2000 were more
negative than for 1961–90. All but two of the coastal stations have recorded increasing mean wind speeds over recent
decades, which is also consistent with the change in the nature of the SAM. Copyright 2005 Royal Meteorological
Society.
KEY WORDS: Antarctica; climate variability; temperature; pressure; wind speed
1. INTRODUCTION
A number of recent studies concerned with Antarctic climate variability have highlighted the marked warming
observed on the western side of the Antarctic Peninsula (King, 1994; Vaughan et al., 2001; Marshall et al.,
2002) coupled with disintegration of several floating ice shelves (Vaughan, 1993). The warming at low
elevations on the Bellingshausen Sea (western) coast of the Antarctic Peninsula is as large as any increase
observed on Earth over the last 50 years, and at Faraday (now Vernadsky) station (see Figure 1) the annual
mean surface temperature has risen by about 2.5 ° C since the 1950s. On the eastern side of the peninsula there
are very few occupied stations, but the disintegration of the northern part of the Larsen Ice Shelf implies
major climate changes are also taking place in this area. Although the temperature rise at Faraday/Vernadsky
has been substantial, there are indications (King and Comiso, 2003) that the region of marked warming is
* Correspondence to: John Turner, British Antarctic Survey, High Cross, Madingley Road, Cambridge CB3 0ET, UK;
e-mail: J.Turner@bas.ac.uk
Copyright 2005 Royal Meteorological Society
280                                                   J. TURNER ET AL.

quite limited and is restricted to an arc from the southwestern part of the peninsula, through Faraday to a
little beyond the tip of the peninsula.
    Other environmental indicators point to a cooling over parts of the high southern latitudes. For example,
Zwally et al. (2002) noted that the areal extent of Antarctic sea ice computed from satellite passive microwave
imagery had increased around much of the continent over the last 20 years, suggesting either colder near-
surface air temperatures over the Southern Ocean or changes in oceanic conditions. In addition, Comiso
(2000) found a small cooling in surface skin temperatures across much of the continent in his study based
on cloud-cleared infra-red satellite imagery covering the period 1979 to 1998.
    In recent years a number of studies have examined climate change across the Antarctic using station
observations. Jacka and Budd (1991) used data from 1956 to the late 1980s and suggested that there had been
a warming of around 0.28 ° C decade−1 . They updated their work (Jacka and Budd, 1998) to cover the period
up to 1996 and found a warming of 0.12 ° C decade−1 .
    A further study of trends in Antarctic near-surface temperatures was carried out by Jones (1995). He
considered the temperature records from 16 stations that covered 1957–94 and found an increase of
0.57 ° C over this period, which was statistically significant at the
ANTARCTIC CLIMATE CHANGE 281 of the same order of magnitude as that reported by Jacka and Budd (1998). The Jones (1995) study has recently been updated (Jones and Reid, 2001) and can be found as a Web-based publication at http://cdiac.esd.ornl.gov/epubs/ndp/ndp032/ndp032.html. The question of whether the Antarctic as a whole has warmed or cooled in recent decades has been considered in a number of papers. Raper et al. (1984) attempted to derive the mean annual temperature of the Antarctic continent by computing an areally weighted mean of the station data and found that there had been a warming of 0.29 ° C decade−1 for 1957–82, a result that was significant at the
282                                             J. TURNER ET AL.

We did not attempt to include data for all stations that had operated in the Antarctic; rather, we present data for
a number of key sites distributed around the continent with long records. For some important stations where
the synoptic reports were not available, the means were computed from other sources of data, as discussed
below.
   Surface data were included for occupied stations operating year-round with records extending back at
least 25 years, although not necessarily in a continuous period, or stations currently in operation that had
operated for the last 10 years. Preference was given to using the six-hourly synoptic reports, but CLIMAT
messages were used if these were not available. A final option was to use the synoptic reports off the Global
Telecommunications System (GTS).
   AWS data were included for systems that had operated for the last 5 years, or for at least 10 years at some
previous time, not necessarily in a continuous period. Although many AWSs provide data at high temporal
frequency, means for READER were computed using the six-hourly observations obtained from the AWS
operators in the USA, Australia, Germany and Italy, since these observations will have been quality controlled.
   A thorough quality control of the data was carried out before the monthly means were computed. This was
relatively easy when the six-hourly synoptic data were available, compared with trying to detect errors in the
CLIMAT messages where the individual synoptic reports were not available.
   As a second phase of the project, upper air wind speed and temperature, along with geopotential height for
selected levels, are also being collected.
   The READER dataset can be accessed via the World Wide Web at http://www.antarctica.ac.uk/met/prog-
rams-hosted.html.

                                      3. TRENDS IN THE SURFACE DATA

3.1. Temperature trends
   Table I gives the annual and seasonal near-surface temperature trends for the 19 stations over the full
length of the records, with a graphical representation of the trends being shown in Figure 2 for the period
1971–2000. Table I also indicates whether the means were produced primarily from the synoptic observations
or taken from the CLIMAT messages. The trends were computed using a standard least-squares method, with
the methodology used to calculate the significance levels based upon Santer et al. (2000). Briefly, an effective
sample size was calculated based on the lag-1 autocorrelation coefficient of the regression residuals. This
effective sample size was used for the computation of the standard error and in indexing the critical values
of Student’s t distribution.
   The largest annual warming trends are found on the western and northern parts of the Antarctic
Peninsula, with Faraday/Vernadsky having the largest statistically significant trend at +0.56 ° C decade−1
over 1951–2000, a figure that is significant at the
ANTARCTIC CLIMATE CHANGE 283
0°
30
°W °E
30
50°S
NOVO' REVSKAYA
ORCADAS
SYOMA
60°S
°W
60°
60
E
HALLEY
ESPERANZA MOLODEZHNAYA
70°S
MAWSON
80°S
90°W
90°Ε
DAVIS
AMUNDSEN-SCOTT
BELLINGSHAUSEN
MIRNY
FARADAY
VOSTOK
CASEY
Cooling Warming
12
1% 5% 10% 10% 5% 1%
0°Ε
SIGNIFICANCE
15 SCOTT BASE
Trend (°C/ century)
DUMONT D'URVILLE
10
5
0
ANNUAL
AUT (MAM)
WIN (JJA)
SPR (SON)
SUM (DJF)
15
-5 E
0°
-10
-15 180°
Figure 2. Antarctic near-surface temperature trends for 1971–2000. A minimum of 27 years of data are required for inclusion. This
figure is available in colour online at http://www.interscience.wiley.com/ijoc
sea ice can have a large impact on the air temperatures. However, the relationship between the temperatures
at coastal stations and sea ice off the coast is complex and varies around the continent, and it is only on the
western side of the Antarctic Peninsula that there is a high correlation between these two quantities. This can
be seen from Figure 3, which shows the winter-season mean sea-ice concentration at 70 ° W and the mean
Faraday/Vernadsky temperature. The correlation between these two quantities is −0.64, with higher (lower)
temperatures being associated with lower (higher) sea-ice concentrations to the west of the peninsula. Reliable
satellite-derived sea-ice extent and concentration data only became available in the late 1970s, but since that
time the mean winter temperature at Faraday/Vernadsky has been increasing and the sea-ice concentrations
to the west of the peninsula decreasing (Figure 3). However, it is unlikely that the winter-season warming at
the coastal stations beyond the Antarctic Peninsula is a result of changes in sea-ice extent since 1979, since
Zwally et al. (2002) showed that sea ice has been increasing since this time.
The changing nature of the temperature trends over recent decades is indicated in Table II, which shows
overlapping 30 year trends in the annual mean surface temperatures. For most stations, only 1961–90 and
Copyright 2005 Royal Meteorological Society Int. J. Climatol. 25: 279–294 (2005)284
Table I. Annual and seasonal surface temperature trends at selected Antarctic stations. Bold plus underlined values: significant at the 1% level. Bold values:
significant at the 5% level. Italicized text: significant at the 10% level. Trends included if 90% of the observations are available
Station Temperature trend (° C decade−1 ) Period Data useda
Annual Spring Summer Autumn Winter
Novolazarevskya +0.25 ± 0.27 +0.25 ± 0.41 +0.19 ± 0.34 +0.08 ± 0.46 +0.44 ± 0.66 1962–2000 S&C
Syowa +0.01 ± 0.35 +0.01 ± 0.48 −0.01 ± 0.27 −0.12 ± 0.67 +0.14 ± 0.58 1960–61 S
Copyright 2005 Royal Meteorological Society
1967–2000
Molodezhnaya −0.06 ± 0.29 −0.18 ± 0.50 −0.14 ± 0.32 −0.21 ± 0.43 +0.30 ± 0.77 1964–95, 1997–98 C&G
Mawson −0.11 ± 0.23 −0.04 ± 0.33 −0.09 ± 0.26 −0.30 ± 0.40 +0.03 ± 0.58 1955–2000 S&G
Davis +0.03 ± 0.35 +0.05 ± 0.50 +0.05 ± 0.30 −0.26 ± 0.60 +0.15 ± 0.67 1958–63, 1970–2000 S&G
Mirny −0.01 ± 0.26 +0.09 ± 0.46 −0.14 ± 0.30 −0.28 ± 0.45 +0.31 ± 0.56 1956–2000 S&G
Vostok −0.02 ± 0.34 −0.11 ± 0.51 +0.13 ± 0.42 −0.32 ± 0.63 +0.14 ± 0.85 1958–2000 C&G
Casey +0.01 ± 0.40 +0.13 ± 0.50 −0.09 ± 0.30 −0.14 ± 0.90 +0.22 ± 0.83 1962–2000 S&G
Dumont d’Urville +0.02 ± 0.27 +0.23 ± 0.45 0.00 ± 0.31 −0.34 ± 0.35 +0.17 ± 0.60 1956–2000 S&C
J. TURNER ET AL.
Scott Base +0.29 ± 0.36 +0.34 ± 0.68 +0.05 ± 0.38 +0.18 ± 0.65 +0.43 ± 0.71 1958–2000 C
Rothera +1.01 ± 1.42 +1.06 ± 1.53 +0.36 ± 0.57 +1.37 ± 1.46 +1.73 ± 2.79 1978–2000 S
Faraday/Vernadsky +0.56 ± 0.43 +0.25 ± 0.4.4 +0.24 ± 0.17 +0.63 ± 0.60 +1.09 ± 0.88 1951–2000 S
Bellingshausen +0.35 ± 0.46 −0.10 ± 0.47 +0.30 ± 0.20 +0.51 ± 1.05 +0.58 ± 0.97 1969–2000 S
Esperanza +0.41 ± 0.42 −0.07 ± 0.57 +0.43 ± 0.34 +0.82 ± 1.11 +0.51 ± 0.82 1961–2000 C
MarambioANTARCTIC CLIMATE CHANGE 285
0 0
1978
1983
1988
1993
1998
-2 0.1
0.2
-4
Mean ice concentration
0.3
-6
Temperature
0.4
-8
0.5
-10
0.6
-12
0.7
-14 0.8
-16 0.9
Temperature Sea Ice Concentration
Figure 3. Winter season (June–August) mean sea-ice concentration at 70 ° W and Faraday/Vernadsky mean winter near-surface
temperature. Trend lines produced by linear regression are shown for both time series
1971–2000 can be considered because of the shortness of the records, although three 30 year trends can
be examined for Faraday/Vernadsky, and the Orcadas record extends back to 1903. For all the continental
stations in Table II, except Esperanza and Molodezhnaya, the warming trend was greater (or the cooling
trend less) during the 1961–90 period compared with 1971–2000. The reasons for the more marked warming
in the earlier period are not fully understood at present, but could be associated with changes in the major
modes of Antarctic climate variability discussed below. Alternately, changes in sea-ice extent could have
played a role, but there is very little data on the extent of Antarctic sea ice in the period before the late
1970s. King and Harangozo (1998) found a number of ship reports from the Bellingshausen Sea in the 1950s
and 1960s when sea ice was well north of the locations found in the period of availability of satellite data,
suggesting some periods of greater sea-ice extent than found in recent decades. Similarly, Kukla and Gavin
(1981) reported a decrease in Antarctic sea ice over the period 1973 to 1980 based on satellite imagery, and
de la Mare (1997) estimated that the summer sea-ice edge had moved several degrees further south between
the mid-1950s and early 1970s based on whaling records. However, at present it is not possible to attribute
the temperature changes observed at coastal stations to variations in sea-ice conditions prior to the late 1970s.
Only two stations from the interior of the Antarctic have long temperature records, so it is not possible
to make any clear statement about change over this vast area. However, the data from Vostok shows no
statistically significant change over a record that extends back over 40 years. Comiso (2000) found a slight
cooling on the high plateau of East Antarctica over the period 1979 to 1998, and this is also reflected in the
READER data for Vostok over this period. However, this occurred after several decades of slight warming
since the station was established in 1958. Clearly, more work is needed on this decadal time scale variability
of temperatures over East Antarctica.
At Amundsen–Scott Station there is a cooling in all seasons, but only the annual trend of −0.17 ° C decade−1
is statistically significant at the 10% level. However, it should be noted that it has not been possible to obtain
much metadata for the station, and the study of Hogan et al. (1993) has highlighted changes in the nature of
the temperature record around the time of the relocation of the station in December 1974. Clearly the South
Pole temperature record requires further investigation.
Copyright 2005 Royal Meteorological Society Int. J. Climatol. 25: 279–294 (2005)286
Table II. Overlapping 30 year trends in the annual mean surface temperature at selected Antarctic stations. Bold plus underlined values: significant at the 1%
level. Bold values: significant at the 5% level. Italicized text: significant at the 10% level
Station Temperature trend (° C decade−1 )
1901–30 1911–40 1921–50 1931–60 1941–70 1951–80 1961–90 1971–2000
Novolazarevskya — — — — — —
Copyright 2005 Royal Meteorological Society
+0.41 ± 0.38 +0.10 ± 0.41
Syowa — — — — — — — −0.02 ± 0.45
Molodezhnaya — — — — — — −0.11 ± 0.43 −0.04 ± 0.43
Mawson — — — — — — −0.13 ± 0.52 −0.15 ± 0.43
Davis — — — — — — — −0.04 ± 0.54
Mirny — — — — — — +0.16 ± 0.45 −0.26 ± 0.49
Vostok — — — — — — +0.11 ± 0.53 −0.31 ± 0.51
Casey — — — — — — +0.37 ± 0.54 −0.37 ± 0.57
Dumont Durville — — — — — +0.14 ± 0.41 −0.33 ± 0.46
J. TURNER ET AL.
Scott Base — — — — — — +0.32 ± 0.67 +0.05 ± 0.60
Rothera — — — — — — — —
Faraday/Vernadsky — — — — — +0.48 ± 0.97 +0.45 ± 0.89 +0.36 ± 0.88
Bellingshausen — — — — — — — +0.31 ± 0.49
Esperanza — — — — — — +0.36 ± 0.72 +0.62 ± 0.69
Marambio — — — — — — — —
Orcadas −0.44 ± 0.70 −0.03 ± 0.66 +0.19 ± 0.70 +0.41 ± 0.79 +0.37 ± 0.65 −0.21 ± 0.84 +0.24 ± 0.68 +0 .47 ± 0 .57
Halley — — — — — — +0.41 ± 0.65 −0.56 ± 0.71
Neumayer — — — — — — — —
Amundsen–Scott — — — — — — −0.06 ± 0.39 −0.36 ± 0.46
Int. J. Climatol. 25: 279–294 (2005)ANTARCTIC CLIMATE CHANGE 287
0°
30
30°
W °E
50°S
NOVO' REVSKAYA
ORCADAS
SYOWA
60°S
60
°W
°E
HALLEY
60
ESPERANZA MOLODEZHNAYA
70°S
MAWSON
80°S
90°W
DAVIS
90°E
AMUNDSEN-SCOTT
BELLINGSHAUSEN
MIRNY
FARADAY
VOSTOK
CASEY
Falling Rising
12
0°
1% 5% 10% 10% 5% 1%
E
SIGNIFICANCE
15 SCOTT BASE
Trend (hpa/century)
10 DUMONT D' URVILLE
5
0
-5
ANNUAL
AUT (MAM)
WIN (JJA)
SPR (SON)
SUM (DJF)
-10 15
0°E
-15
-20
-25 180°
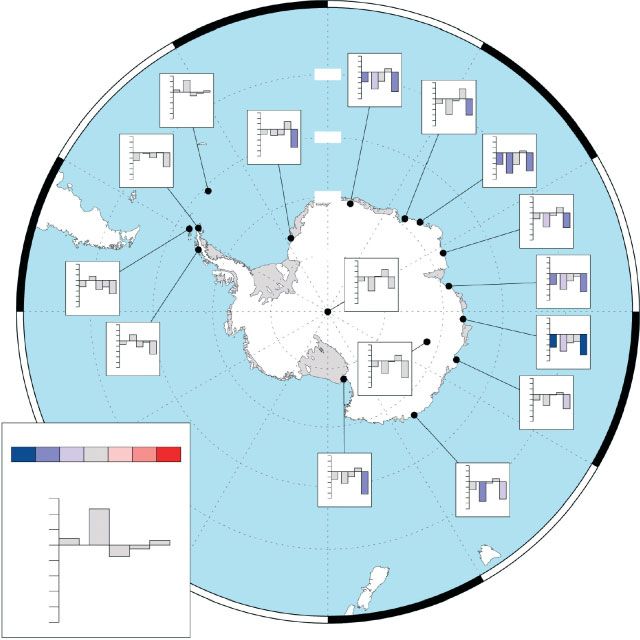
Figure 4. Antarctic MSLP/surface pressure trends for 1971–2000. A minimum of 27 years of data are required for inclusion. This figure
is available in colour online at http://www.interscience.wiley.com/ijoc
Longer time-scale trends in Antarctic temperatures have been considered by Jones (1990).
3.2. Pressure trends
Annual and seasonal MSLP trends for the various stations (station-level pressure for Amundsen–Scott
and Vostok) are summarized in Table III, with a graphical representation being included in Figure 4. All the
stations show negative trends in the annual mean pressures over the periods considered, except for Orcadas,
which has no overall trend. Decreases in pressure occurred in all sectors of the Antarctic, with the most
negative trends being at Molodezhnaya (statistically significant at the 1% level) and Mirny. A consistent
decrease of pressure at Mawson and Davis on either side of the Amery Ice Shelf of −0.48 hPa decade −1 can
be seen in Table III, with similar seasonal trends also occurring at these locations. At other locations there
is a greater spatial variability of the pressure trends, such as between Novolazarveskya and Syowa. In the
Antarctic Peninsula and Weddell Sea sectors, the trends in annual mean MSLP are generally smaller, although
Bellingshausen has experienced a pressure decrease of −0.57 hPa decade −1 .
Copyright 2005 Royal Meteorological Society Int. J. Climatol. 25: 279–294 (2005)288
Table III. Annual and seasonal MSLP/station pressure trends at selected Antarctic stations. Bold plus underlined values: significant at the 1% level. Bold values:
significant at the 5% level. Italicized text: significant at the 10% level. Trends included if 90% of the observations are available
Station Pressure trend (hPa decade−1 ) Period Data useda
Annual Spring Summer Autumn Winter
Novolazarevskya −0.67 ± 0.58 +0.02 ± 1.18 −1.17 ± 1.26 −0.77 ± 1.43 −0.56 ± 1.14 1962–2000 S&C
Copyright 2005 Royal Meteorological Society
Syowa −0.24 ± 0.62 +0.18 ± 1.04 −0.90 ± 1.10 −1.01 ± 1.27 −0.02 ± 1.17 1959–61, 1967–2000
Molodezhnaya −0.98 ± 0.68 −0.16 ± 1.16 −1.63 ± 1.13 −1.12 ± 1.54 −1.09 ± 1.28 1964–1998 S&C
Mawson −0.48 ± 0.43 −0.10 ± 0.68 −0.71 ± 0.77 −0.53 ± 0.80 −0.73 ± 0.89 1955–2000
Davis −0.48 ± 0.51 −0.34 ± 0.90 −0.52 ± 1.05 −0.63 ± 0.96 −0.94 ± 1.19 1958–63, 1970–2000
Mirny −0.95 ± 0.45 −0.53 ± 0.90 −1.09 ± 0.05 −1.11 ± 0.92 −1.23 ± 1.03 1956–2000
Vostok −0.09 ± 0.74 +0.56 ± 1.02 −0.67 ± 1.18 −0.42 ± 1.30 +0.11 ± 1.53 1958–2000
Casey −0.51 ± 0.71 −0.06 ± 1.13 −0.81 ± 1.15 −0.77 ± 1.27 −0.41 ± 1.41 1962–2000
Dumont d’UrvilleANTARCTIC CLIMATE CHANGE 289 The seasonal pressure trends in Table III show the variability of the changes that have taken place over the last few decades. Eight of the stations in Table III have their largest negative pressure trends in the summer, which is the season when the smallest number of synoptic-scale depressions are found in the circumpolar trough (Jones and Simmonds, 1993). A further five stations have the largest negative trends in the winter, which is the secondary minimum of cyclonic activity as the circumpolar trough moves north as a result of the semi-annual oscillation (SAO; van Loon, 1967). The trends for Faraday/Vernadsky, of large pressure falls in the summer and winter, and a pressure rise in the autumn, coupled with a small drop in the spring, indicate the extent to which the SAO has been weakening in recent decades (Van den Broeke, 1998). Simmonds and Keay (2000) carried out an analysis of cyclone density and depth around the Antarctic based on National Centers for Environmental Prediction reanalysis fields for 1958–97 and using an objective depression tracking procedure. They reported a negative (positive) trend in the surface pressures south (north) of 40 ° S, which they attributed to the ‘high latitude mode’. This is a see saw of atmospheric conditions between the middle and high latitude areas of the Southern Hemisphere. In parallel with the drop of pressure south of 40 ° S they found that there had been a reduction in the number of cyclones over the period, with the greatest decrease near 60 ° S. However, the apparent inconsistency of falling station pressure and fewer cyclones was explained by the fact that the mean depth and size of the systems had decreased over this period. The ‘high-latitude mode’, also known as the Southern Hemisphere annular mode (SAM) and the Antarctic oscillation, is attributed to fluctuations in the strength of the circumpolar vortex. Thompson and Solomon (2002) examined the trends in Antarctic tropospheric heights throughout the year via the radiosonde data from seven stations and found a maximum decrease in height throughout the troposphere during the summer months, with a secondary height drop during the winter. Our longer time series of in situ data allows us to examine overlapping 30 year trends of MSLP, which are shown in Table IV. Except for Halley, where the trends are constant, these data indicate that the trends for 1971–2000 were more negative than for 1961–90 for all stations on the Antarctic continent. The record for Faraday/Vernadsky extends back to 1950 and allows us to examine three 30 year overlapping trends. These indicate an increasing negative pressure trend through this period. When the SAM is in its high-index state, polar temperatures, geopotential heights and surface pressures are low and strong circumpolar winds are found near 60 ° S. Low-index periods are characterized by anomalies in the opposite sense. As discussed in Thompson and Solomon (2002), the data in Table IV indicate a trend towards the high-index form of the SAM, with stronger westerly winds around the Antarctic and lower MSLP over the Antarctic continent. The long record from Orcadas (Figure 5) is valuable in providing a time series of pressure data on the other side of the ‘seesaw’ that extends back to the start of the 20th century. Since 1961 there has been a small positive trend in the pressure values, although this is not statistically significant. And since 1901 the pressure data from the station have fluctuated considerably, with the only long fall in pressure being during the two overlapping 30 year periods from 1931 to 1970. 3.3. Wind speed trends The trends in near-surface wind speed for the main Antarctic stations are shown in Table V. Because of the lack of reliable, long-term records of wind speed data at some stations, long-term trends can only be computed for 11 coastal sites. However, eight of these have experienced wind speed increases over their periods of operation, with the only coastal stations having had wind speed decreases being Mirny and Halley. But the increasing wind speeds at the majority of the stations is consistent with the change in the nature of the SAM over recent decades. The reasons why two of the stations have experienced decreasing wind speeds is not clear. Halley is the most southerly of the coastal stations and, therefore, may not register the impact of the changes in the SAM. But Mirny is close to Davis, yet has quite a different trend in wind speed. These two stations are only about 700 km apart, yet have trends of −0.324 kts decade−1 and +0.428 kts decade−1 respectively over approximately the same period. This may point to changes in the equipment used to measure wind speed at the stations, to modifications to the instrument exposure, or to changes in the local wind flow. On the western side of the Antarctic Peninsula there is a consistent picture of wind speeds increasing, although only the Faraday/Vernadsky trend is statistically significant. In the interior of the Antarctic, only Copyright 2005 Royal Meteorological Society Int. J. Climatol. 25: 279–294 (2005)
290
Table IV. Overlapping 30 year trends in the annual MSLP at selected Antarctic stations. Bold plus underlined values: significant at the 1% level. Bold values:
significant at the 5% level. Italicized text: significant at the 10% level
Station MSLP trend (hPa decade−1 )
1901–30 1911–40 1921–50 1931–60 1941–70 1951–80 1961–90 1971–2000
Copyright 2005 Royal Meteorological Society
Novolazarevskya — — — — — — −0.20 ± 0.91 −0.98 ± 0.97
Syowa — — — — — — — −0.50 ± 0.96
Molodezhnaya — — — — — — −0 .89 ± 0 .95 −1.17 ± 1.03
Mawson — — — — — — −0.43 ± 0.77 −0.59 ± 0.90
Davis — — — — — — — −1.06 ± 0.91
Mirny — — — — — — −1.11 ± 0.73 −1.30 ± 0.79
Vostok — — — — — — −0.25 ± 1.13 −0.57 ± 1.45
Casey — — — — — — −0.45 ± 1.12 −0.58 ± 1.07
J. TURNER ET AL.
Dumont Durville — — — — — — −0.04 ± 1.03 −0.85 ± 1.32
Scott Base — — — — — — −0.40 ± 0.92 −0.76 ± 1.10
Faraday — — — — — +0.30 ± 0.93 −0.08 ± 0.88 −0.35 ± 1.43
Bellingshausen — — — — — — — −0.63 ± 1.24
Esperanza — — — — — — −0.45 ± 1.16 −0.77 ± 1.19
Orcadas +0.09 ± 1.19 −0.30 ± 1.05 +0.14 ± 0.89 −0.24 ± 0.82 −0.39 ± 1.01 +0.15 ± 0.98 +0.06 ± 0.85 +0.24 ± 1.32
Halley — — — — — — −0.50 ± 0.91 −0.50 ± 1.02
Amundsen–Scott — — — — — — −0.19 ± 1.01 −0.40 ± 0.91
Int. J. Climatol. 25: 279–294 (2005)ANTARCTIC CLIMATE CHANGE 291
997
996
995
994
993
992
991
990
989
988
04
10
16
22
28
34
40
46
52
58
64
70
76
82
88
94
00
19
19
19
19
19
19
19
19
19
19
19
19
19
19
19
19
20
Figure 5. The Orcadas annual MSLP for 1904–2000
Amundsen–Scott Station has a sufficiently complete record of wind speeds to allow the determination of
trends, and these show a decrease that is statistically significant at the 5% level. However, there is little
metadata for the site, so it is not possible to take into account any changes of instrumentation or observing
site in relation to the station.
The seasonal wind speed trends in Table V present a varied picture of change across the Antarctic. Around
the coast of East Antarctica, three of the stations have had their greatest wind speed increases during the
winter, yet Novolazarevskya and Mirny, which bracket the stations, have their greatest wind speed decreases
in this season. However, Novolazarevskya and Mirny are to the immediate west of the climatological position
of the separate low-pressure systems that sit off the coast during winter. Each of the stations in between is
either central or to the east of low-pressure systems located off the coast.
On the other hand, on the western side of the Antarctic Peninsula, where the greatest increases in
temperatures have been during the winter, none of the stations had their largest wind speed increases during
this season, and the largest trends are spread across the three other seasons.
4. DISCUSSION AND FUTURE WORK
This paper has examined the temporal variability and change in some of the key meteorological parameters at
Antarctic stations. The temperature trends are very variable across the continent: rapid warming has occurred
over the Antarctic Peninsula, which stands out as a clear and consistent region of rapid change, whereas
conditions have been much more variable in other sectors. Whereas earlier studies (e.g. Raper et al., 1984;
Doran et al., 2002) have derived mean temperature trends for the continent based on all the station trends,
we have deliberately not attempted to produce such a figure as we feel that this gives an oversimplified view
of change in the Antarctic and does not reflect the regional variability. Invariably, such mean figures give a
small warming trend, but this is always dominated by the large warming on the western side of the Antarctic
Peninsula. A more realistic picture of temperature change over the Antarctic is obtained by noting that, of the
19 stations examined in this study for which annual trends could be computed, 11 stations have experienced
warming over their whole length, seven stations have cooled, and one station had too little data to allow an
annual trend to be computed. However, it should be noted that only three of these trends are statistically
significant: Faraday/Vernadsky on the peninsula, Novolazarevskya in East Antarctic, which are both warming,
and Amundsen–Scott at the South Pole, which has cooled. The cooling at Amundsen–Scott has not been
investigated in detail to date, probably as a result of the lack of reliable synoptic-scale analyses on the plateau.
In addition, there are very limited amounts of metadata available for the station, precluding any investigation
Copyright 2005 Royal Meteorological Society Int. J. Climatol. 25: 279–294 (2005)292
Table V. Annual and seasonal wind speed trends at selected Antarctic stations. Bold plus underlined values: significant at the 1% level. Bold values: significant
at the 5% level. Italicized text: significant at the 10% level. For full records. Trends included if 90% of the observations are available
Station Wind speed trend (kts decade−1 ) Period (annual)
Annual Spring Summer Autumn Winter
Novolazarevskya 1963–2000
Copyright 2005 Royal Meteorological Society
+0.243 ± 0.572 +0.178 ± 0.889 +0.557 ± 0.761 +0.330 ± 0.926 −0.214 ± 1.018
Syowa +0.085 ± 0.231 +0.028 ± 0.270 +0.056 ± 0.241 +0.081 ± 0.215 +0.174 ± 0.215 1960–61, 1967–2000ANTARCTIC CLIMATE CHANGE 293
into the possible effects of changes in instrumentation or the location of the meteorological instruments.
However, as can be seen in Table V, the wind speeds at the station have decreased at a statistically significant
level in three of the four seasons and in the annual data. A decrease in wind speed would result in a more stable
boundary layer and colder conditions at the surface, which would explain the trend towards colder surface
conditions. Without reliable surface-pressure analyses it is not clear why the winds, and therefore the pressure
gradient, has changed, although the modelling investigation by van den Broeke and van Lipzig (2002) has
shown that surface conditions in the interior of Antarctica are sensitive to variations in the circumpolar vortex.
Although there is no evidence of Antarctic-wide warming or cooling over the last 40 to 50 years, Table II
does suggest that there has been a broad-scale change in the nature of the temperature trends between 1961–90
and 1971–2000. Ten of the coastal stations in Table II have long enough records to allow 30-year temperature
trends to be computed for both these periods; of these, eight had a larger warming trend (or a smaller cooling
trend) in the earlier period. In the Antarctic Peninsula region there were some very cold years during the
1960s and suggestions that there was more extensive sea ice (King and Harangozo, 1998). Since there is a
close association between near-surface temperature and sea-ice extent in this area, it may be that there was
more sea ice to the west of the peninsula in the 1950s and 1960s compared with later decades; but there are
few sea-ice observations prior to the late 1970s, so this is difficult to investigate.
The Antarctic Peninsula is the region of the continent where there is the strongest influence of the El
Niño–southern oscillation, with a Rossby wave train often extending towards the Bellingshausen Sea from
the tropical Pacific during El Niño events (Turner, 2004). In recent decades, El Niño events have been more
frequent and of greater intensity, raising the possibility that tropical forcing may have played a role in some
of the climatic changes observed in the Antarctic Peninsula. However, as discussed in Turner (2004), El Niño
events, on average, result in fewer depressions/greater blocking over the Bellingshausen Sea, which results in
more southerly winds and, therefore, colder conditions. So, stronger and more frequent El Niño events would
tend to give colder conditions rather than the warming observed. So, at the moment, the role of changes in
tropical forcing on the climate of the Antarctic is not clear.
The clear decrease in surface pressures at the coastal stations over the full periods of the station data
is indicative of the SAM moving towards a high-index state in recent decades. The SAM is a seesaw of
pressures over high and mid latitudes and the trend towards high pressures at Orcadas is consistent with
this out-of-phase relationship between surface pressures over the Antarctic continent and at lower latitudes.
The climate record from Orcadas started at the beginning of the 20th century and provides a longer term
perspective on the variability of the SAM. As can be seen from Figure 5 and Table IV, the recent trend
towards high surface pressures is a result of relatively low pressure during the 1970s, but before this the
trends were quite variable, switching sign several times during the first 70 years of the 20th century.
ACKNOWLEDGEMENTS
We would like to thank the Scientific Committee on Antarctic Research for their support of this project.
REFERENCES
Comiso JC. 2000. Variability and trends in Antarctic surface temperatures from in situ and satellite infrared measurements. Journal of
Climate 13: 1674–1696.
De la Mare W. 1997. Abrupt mid-twentieth-century decline in Antarctic sea-ice extent from whaling records. Nature 389: 57–60.
Doran PT, Priscu JC, Lyons WB, Walsh JE, Fountain AG, McKnight DM, Moorhead DL, Virginia RA, Wall DH, Clow GD,
Fritsen CH, McKay CP, Parsons AN. 2002. Antarctic climate cooling and terrestrial ecosystem response. Nature 415: 517–520.
Hogan AW, Riley D, Murphey BB, Barnard SC, Samson JA. 1993. Variation in aerosol concentration associated with a polar climatic
iteration. In Antarctic Meteorology and Climatology: Studies Based on Automatic Weather Stations, Bromwich DH, Stearns CR (eds).
AGU: Washington, DC.
Jacka TH, Budd WF. 1991. Detection of temperature and sea ice extent changes in the Antarctic and Southern Ocean. Proceedings of
the International Conference on the Role of the Polar Regions in Global Change, June 11–15, 1990, University of Alaska Fairbanks,
Weller G, Wilson CL, Severin BA (eds). University of Alaska, Geophysical Institute: Fairbanks, AK; 63–70.
Jacka TH, Budd WF. 1998. Detection of temperature and sea-ice-extent changes in the Antarctic and Southern Ocean, 1949–96. Annals
of Glaciology 27: 553–559.
Jacka TH, Christou L, Cook BJ. 1984. A data bank of mean monthly and annual surface temperatures for Antarctica, the Southern
Ocean and South Pacific Ocean. Research Note 22, 98 pp. Australian National Antarctic Research Expeditions.
Copyright 2005 Royal Meteorological Society Int. J. Climatol. 25: 279–294 (2005)294 J. TURNER ET AL. Jones PD. 1990. Antarctic temperatures over the present century — a study of the early expedition record. Journal of Climate 3: 1193–1203. Jones PD. 1995. Recent variations in mean temperature and the diurnal temperature range in the Antarctic. Geophysics Research Letters 22: 1345–1348. Jones PD, Limbert DW. 1987. A data bank of Antarctic surface temperature and pressure data, Jones PD (ed.). Office of Energy Research, report no. TR038, United States Department of Energy, Washington. Jones DA, Simmonds I. 1993. An objective climatology of Southern Hemisphere extratropical cyclones. In Proceedings of the Fourth International Conference on Southern Hemisphere Meteorology and Oceanography. American Meteorological Society: Boston, MA; 44–45. Jones PD, Reid PA. 2001. A databank of Antarctic surface temperature and pressure data. ORNL/CDIAC-27, NDP-032. Oak Ridge, Tennessee, Carbon Dioxide Information Analysis Center, Oak Ridge National Laboratory, US Department of Energy. King JC. 1994. Recent climate variability in the vicinity of the Antarctic Peninsula. International Journal of Climatology 14: 357–369. King JC, Comiso JC. 2003. The spatial coherence of interannual temperature variations in the Antarctic Peninsula. Geophysics Research Letters 30(2): 1040. DOI: 10.1029/2002GL015580. King JC, Harangozo SA. 1998. Climate change in the western Antarctic Peninsula since 1945: observations and possible causes. Annals of Glaciology 27: 571–575. Kukla G, Gavin J. 1981. Summer ice and carbon dioxide. Science 214: 497–503. Marshall GJ, Lagun V, Lachlan-Cope TA. 2002. Changes in Antarctic Peninsula tropospheric temperatures from 1956–99: a synthesis of observations and reanalysis data. International Journal of Climatology 22: 291–310. Raper SC, Wigley TM, Jones PD, Salinger MJ. 1984. Variations in surface air temperatures: part 3. The Antarctic, 1957–1982. Monthly Weather Review 112: 1341–1353. Santer BD, Wigley TML, Boyle JS, Gaffen DJ, Hnilo JJ, Nychka D, Parker DE, Taylor KE. 2000. Statistical significance of trends and trend differences in layer-average temperature time series. Journal of Geophysical Research 105: 7337–7356. Schwerdtfeger W. 1984. Weather and Climate of the Antarctic. Elsevier: Amsterdam. Simmonds I, Keay K. 2000. Mean Southern Hemisphere extratropical cyclone behavior in the 40-year NCEP–NCAR reanalysis. Journal of Climate 13: 873–885. Thompson DWJ, Solomon S. 2002. Interpretation of recent Southern Hemisphere climate change. Science 296: 895–899. Turner J. 2004. The El Niño–southern oscillation and Antarctica. International Journal of Climatology 24: 1–31. Turner J, King JC, Lachlan-Cope TA, Jones PD. 2002. Recent temperature trends in the Antarctic. Nature 418: 291–292. Turner J, Colwell SR, Marshall GJ, Lachlan-Cope TA, Carleton AM, Jones PD, Lagun V, Reid PA, Iagovkina S. 2004. The SCAR READER project: towards a high-quality database of mean Antarctic meteorological observations. Journal of Climate 17: 2890–2898. Van den Broeke MR. 1998. The semi-annual oscillation and Antarctic climate. Part 2: recent changes. Antarctic Science 10: 184–191. Van den Broeke MR, van Lipzig NPM. 2002. Impact of polar vortex variability on the wintertime low-level climate of East Antarctica: results of a regional climate model. Tellus, Series A: Dynamic Meteorology and Oceanography 54: 485–496. Van Loon H. 1967. The half-yearly oscillations in middle and high southern latitudes and the coreless winter. Journal of the Atmospheric Sciences 24: 472–486. Vaughan DG. 1993. Implications of the break-up of Wordie Ice Shelf, Antarctic for sea level. Antarctic Science 5: 403–408. Vaughan DG, Marshall GJ, Connolley WM, King JC, Mulvaney R. 2001. Climate change — devil in the detail. Science 293: 1777–1779. Zwally HJ, Comiso JC, Parkinson CL, Cavalieri DJ, Gloersen P. 2002. Variability of Antarctic sea ice 1979–1998. Journal of Geophysical Research 107(C5): 3041. DOI: 10.1029/2000JC000733. Copyright 2005 Royal Meteorological Society Int. J. Climatol. 25: 279–294 (2005)
You can also read