Market Insights: Iron ore market dynamics - July 2021 - Frontier Advisors
←
→
Page content transcription
If your browser does not render page correctly, please read the page content below

Market Insights:
Iron ore market dynamics
July 2021
About
Frontier has been at the forefront of institutional investment advice in Australia for over two decades
and provides advice on more than $470b in assets across the superannuation, charity, insurance,
public sector and higher education sectors.

Author                                                                           Author

KC Low, CFA                                                                      Ann Tran, PhD
Senior Consultant                                                                Associate
KC Low is a Senior Consultant, having joined Frontier as an Associate in         Ann Tran joined Frontier as an Associate in July 2019. She is a member of the
2012. His responsibilities at Frontier include providing analytical support to   Capital Markets and Asset Allocation team and is responsible for applying
clients, asset allocation advice, plus investment research. KC is a member       econometric modelling to contribute to the preparation of Frontier’s analytical
of Frontier’s Capital Markets and Asset Allocation team. KC was previously       reports and undertaking relevant economic and financial market research. Prior to
with Fairfax Media as the Head of Research and Valuation Analyst for BRW         joining Frontier, Ann worked as a lecturer and tutor for Economics and Finance
Magazine. He has also published business articles in print and online for        courses at RMIT University. She has also published academic journal articles on
Fairfax's various mastheads. KC has also interned in the Advisory division       Empirical Economics in the Journal of Policy Modelling. Ann holds a PhD in
of PricewaterhouseCoopers. KC holds a Bachelor of Commerce, majoring             Economics from RMIT, majoring in Applied Macroeconomics and Time Series
in Accounting and Finance at Monash University with the Dean's                   Econometrics. She also holds a Master of Economics from the University of Leeds
Commendation. He also holds a Master of Applied Finance from Monash              (United Kingdom).
University. KC is a CFA Charterholder.

                       Market Insights: Iron ore market dynamics          1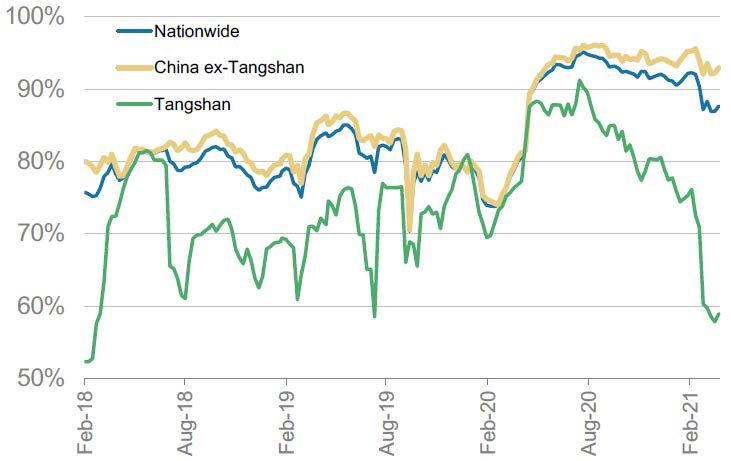
Key insights
High iron ore prices unlikely to be sustained as China growth moderates but global demand could
continue to support
•   The broad increase in commodity prices is driven by a combination of pent-up demand (as economies reopen) and supply side constraints. It is an indication of
    the strength in the general recovery of the global economy. It also highlights the risk of higher inflation if higher production input costs persists.

•   Chinese demand for iron ore has been strong over the last year due to government stimulus for infrastructure and property construction. Chinese demand is
    expected to remain strong in the near term, however the growth rate in demand has likely peaked as authorities have started to tighten policy support. The
    increase in global ex-China demand for steel (driven by large increases in infrastructure spending) is likely to offset some of the Chinese demand slowdown but it
    is unclear if it can offset all of it given the overall size of China’s share of iron ore demand globally, developed economies predominantly relying on scrap steel to
    meet its steel demand (unlike in China), and the type of infrastructure projects being announced globally being less steel intensive (i.e. more focussed on digital
    and renewable infrastructure).
    -   Longer term, China is in the process of reducing its reliance on foreign-owned iron ore by investing in iron ore deposits in Africa (namely the Simandou region
        in Guinea). Production is not expected to start by 2025 at the earliest.

•   Although there is some increase in planned mining capital expenditure in Australia, it is so far small relative to the previous commodity boom. Overall Australian
    production is expected to only increase marginally over the next few years as some of the new added capacity replaces existing depleting production. Global
    supply of iron ore has been constrained in recent years due to Brazil’s Vale being impacted by a dam collapse in early 2019. The pace of recovery in production
    will likely be the key factor on the supply side as increasing output from Australian miners is limited in the near-term. It is widely expected in the market that the
    recovery in Vale’s production capacity will be very gradual and over several years due to the need to reconstruct infrastructure and gain regulatory approvals.
    This means global iron ore supply is likely to improve over time but remain constrained in the near-term.

•   Forecasting commodities is very difficult. At the current high price for iron ore, over the medium-term, the outlook is likely to be more on the downside as supply
    issues are gradually resolved and the demand rebound fades. In the near-term, the outlook is more uncertain depending on how much ex-China demand offsets
    China’s moderating growth.
•   On the geopolitical front, as mentioned in our May 2021 China virtual trip paper, geopolitical tensions with China are likely to be ongoing given structural
    differences and competing interests. As such, it is quite possible for China to escalate geopolitical tensions with Australia to set an example. However, it is
    unlikely for China to act on Australian iron ore exports given Australia’s share of the iron ore market and the sheer size of China’s demand.

                       Market Insights: Iron ore market dynamics           2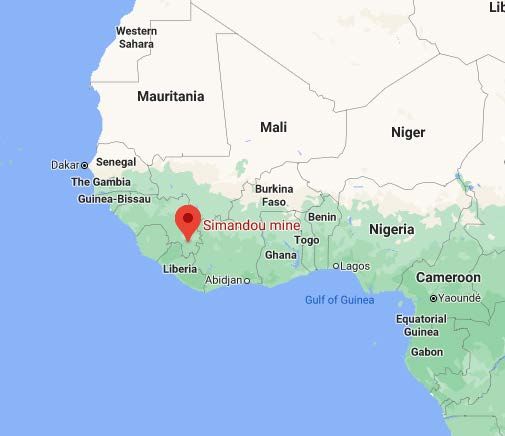
Iron ore market background
 Iron ore is increasingly important to the Australian economy

                                  Iron oreIron
                                             inore in Australianeconomy
                                                Australian       economy                                                                                   AUD/USD
                                                                                                                                                        AUD/USD  vsand ironore
                                                                                                                                                                    iron    ore price
                                                                                                                                                                                price
 8                                                                                                        50              1.2                                                                        250

 7                                                                                                                        1.1
                                                                                                          40                                                                                         200
 6
                                                                                                                          1.0

 5                                                                                                                                                                                                   150
                                                                                                          30

                                                                                                                AUD/USD
                                                                                                                          0.9

                                                                                                                                                                                                           US$/MT
 4
                                                                                                                          0.8
                                                                                                          20                                                                                         100
 3
                                                                                                                          0.7
 2
                                                                                                          10                                                                                         50
                                                                                                                          0.6
 1

                                                                                                                          0.5                                                                        0
 0                                                                                                        0
                                                                                                                            2005                    2010                     2015             2020
 1990              1995             2000              2005       2010             2015             2020
                                                                                                                                                    AUD/USD            Iron ore price (RHS)
             % of nominal GDP                  % of employment          % of goods exports (RHS)
 Source:                                                                                                       Source: Refinitiv Datastream
Source: RefinitivRefinitiv
                  Datastream Datastream,   Frontier                                                            Source:      Refinitiv     Datastream,   Frontier

 •      Iron ore is an important part of Australia’s economy.

        -   Iron ore is Australia’s largest goods export, accounting for around 40% of export revenue.

        -   Iron ore exports contributes to around 7% of nominal GDP.

        -   However, despite its importance, overall mining sector employment accounts for only 2% of the total workforce (however, this varies significantly by region).

 •      The iron ore price is a key driver of the Australian dollar (AUD). This is through the impact of the iron ore price on Australia’s terms of trade (which measures the
        relative prices of exports to imports) and contributes to the AUD historically trading like a commodity currency.
        -   The iron ore price has recently contributed to the upward movement in the AUD, although the scale of the increase in the iron ore price suggests the AUD
            could be even higher. This indicates that although the iron ore price is a driver of the AUD, it is not the only driver. It is possible the currency market expects
            the current iron ore price to be a temporary spike and/or that it is pricing in the potential downside risk from the ongoing COVID-19 pandemic.

                                  Market Insights: Iron ore market dynamics                        3
Iron ore market background
The iron ore price can have a material influence on Australian equities

                        Major iron ore producers in Australian equity                                                                       ASX 300
                                                                                                                         ASX300, ASX300 Materials,   andiron
                                                                                                                                                   and   iron ore
                                                                                                                                                               oreprice
                                                                                                                                                                    price (12 mth change)
                                                                                                                   80                                                                       200
        60
                                                                                                                   60                                                                       150
        50
                                                                                                                   40

                                                                                               Annual change (%)
        40                                                                                                                                                                                  100

                                                                                                                                                                                                   Annual change (%)
                                                                                                                   20
    %

        30
                                                                                                                                                                                            50
                                                                                                                    0
        20
                                                                                                                                                                                            0
                                                                                                                   -20
        10

                                                                                                                   -40                                                                      -50
            0
                            S&P/ASX 300                       S&P/ASX Materials
                                                                                                                   -60                                                                      -100
                                BHP Group     Rio Tinto    Fortescue                                                 2008       2010        2012        2014   2016     2018        2020
                                                                                                                                S&P/ASX 300 Materials                 S&P/ASX 300
                                                                                                                                Iron ore price (RHS)
Source: GBST. Data as at April 2021.                                                          Source: Refinitiv
                                                                                              Source:           Datastream
                                                                                                           Refinitiv     Datastream, Frontier

•       Not only is iron ore important to Australia’s economy, it is also a large part of our equities market and can materially influence the performance of Australian
        equities.

        -       The overall performance of Australian equities has moved closely in line with the change in iron ore price historically.

•       The three major Australian listed iron ore producers (BHP Group, Rio Tinto and Fortescue) account for more than 50% of the S&P/ASX 300 Materials Index and
        more than 10% of the S&P/ASX 300 Index.

        -       However, this has reduced significantly from the peak of the commodity super-cycle in around mid-2008 where the three major iron ore producers accounted
                for close to 20% of the S&P/ASX 300 Index.

                               Market Insights: Iron ore market dynamics          4
Iron ore market background
China has been the key driver of iron ore demand

                                                                                                                           Iron oreIron ore imports,
                                                                                                                                     imports,        exports and
                                                                                                                                                exports      and prices
                                                                                                                                                                  prices
                                                                                                          50                                                                                 250

                                                                                                          40
                                                                                                                                                                                             200
                        Australia is the
                         largest iron

                                                                                      Annual change (%)
                         ore producer                                                                     30
                          in the world                                                                                                                                                       150
                              (53%)

                                                                                                                                                                                                   $/MT
                                                                                                          20
                                              Australia
                                           supplies ~70%                                                                                                                                     100
                                           of China’s iron                                                10
                                            ore imports
                         China is the                                                                                                                                                        50
                         largest iron                                                                      0
                        ore consumer
                         in the world
                             (57%)                                                                        -10                                                                                0
                                                                                                            2008   2010         2012       2014       2016           2018             2020
                                                                                                                    China imports                            Aust. + Brazil exports
                                                                                                                    Iron ore price (RHS)
Source: Department of Industry, Science, Energy and Resources. Data at 2019-2020     Source: Refinitiv
                                                                                     Source:           Datastream
                                                                                                  Refinitiv     Datastream, Frontier

•   Despite the elevated trade tension, Australia and China are highly interdependent on each other for trade.

    -   Although China is Australia’s largest trading partner, the same cannot be said the other way round. However, China is highly dependent on Australia’s iron
        ore supply as there are currently no alternative suppliers that can meet the scale of its demand.

    -   By destination, circa 80% of Australia’s iron ore export goes to China. On the other side, circa 70% of China’s iron ore import comes from Australia (with
        Brazil a distant second place at circa 15%).

•   Most recently, the combination of strong Chinese iron ore demand, recovering global ex-China demand for iron ore, and constrained Brazilian supply has caused
    the price of iron ore to rise sharply.

                       Market Insights: Iron ore market dynamics           5
Iron ore demand
Chinese iron ore demand largely driven by its construction sector

                    China and world steel consumption by sector (2020)                                        World steel production (seasonally adjusted)

        100
            90
            80
            70                                                             Others

            60                                                             Home appliance
                                                                           Shipbuilding
    %

            50
            40                                                             Automobile
            30                                                             Machinery
            20                                                             Construction
            10
            0
                            China                     World
Source: DBS HK, World Steel Association
World steel consumption includes China. Construction includes infrastructure and              Source: Macrobond, Macquarie Macro Strategy
property. Others include (but not exclusive to) metal products and electrical equipment.

•       China steel production accounts for more than 50% of global steel production.

•       Chinese steel (in turn iron ore) demand has predominantly been driven by its construction sectors (infrastructure and property).

        -        Of the 61% of steel consumed by the construction sector, around 37% is consumed by the property sector and 24% by the infrastructure sector.

        -        China’s steel demand from its construction sector is somewhat higher as a proportion of overall demand than the rest of the world.

•       In 2020, authorities in China relied heavily on fixed asset investment to support its sharp V-shape economic recovery from COVID-19. This, in turn, has led to a
        sharp increase in demand for Australian iron ore.

                               Market Insights: Iron ore market dynamics            6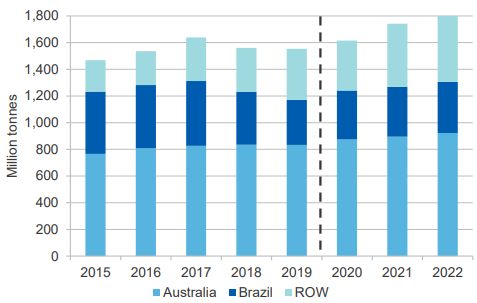
Iron ore demand
Chinese iron ore demand growth has likely peaked
China local government special bond net issuance (CNY bn) China fixed
China fixed asset asset investment
investment 12 month
12-month growth (by
change (bysectors)
sectors)
40
30
20
10
0
-10
-20
-30
-40
2000 2005 2010 2015 2020
Total Real estate
Manufacturing Infrastructure
Source: CEIC, China Ministry of Finance, CBA Source:
Source:RefinitivRefinitiv
Datastream Datastream, Frontier
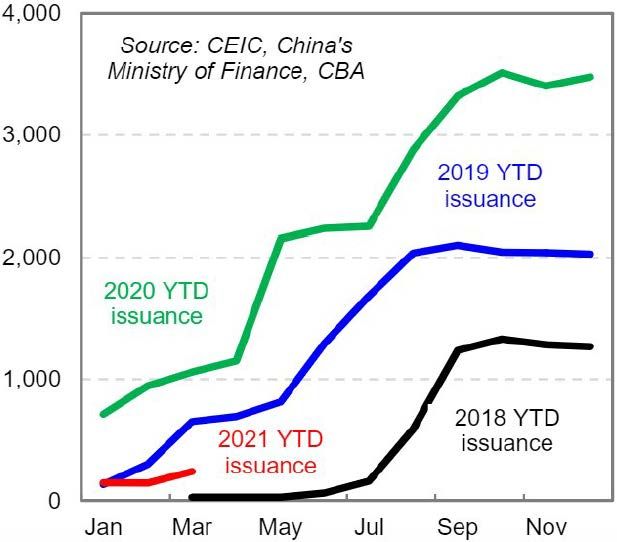
• The Chinese authorities issued a large amount of local government special-purpose bonds in 2020 to fund infrastructure projects to support its economic recovery.
- The quotas for local government special-purpose bonds were set at a similar but slightly lower level this year compared to last year. The issuance of bonds
has also slowed down this year. This suggests that although steel demand for infrastructure projects will remain strong, the growth rate in the demand has
likely peaked.
- Steel demand is likely to remain supported in the near term given the lagged nature and time required for infrastructure construction projects.
• The ultra-accommodative monetary policy in China in response to COVID-19 has led to a booming property market (like in many countries). However, as
authorities re-focus efforts on managing financial stability risks, macroprudential policies have been applied on property developers to curb debt growth and on
banks to reduce lending to the property sector.
- This is likely to dampen steel demand from the property construction sector.
Market Insights: Iron ore market dynamics 7Iron ore demand
Elevated profit margin versus impact of China carbon emission cuts on steel production
China spread between steel (HRC) price and raw material costs China steel mill blast furnace utilisation survey
Source: Bloomberg, DBS Bank Source: Mysteel, Morgan Stanley Research
HRC refers to hot-rolled coil steel, a widely used production input.
• Due to the strong demand for steel within China, the price of steel has increased faster than the price of iron ore, leading to an elevated profit margin for Chinese
steel mills (see ‘spread’ in above left chart). As a result, demand for iron ore from steel mills has continued to be strong.
• However, in addition to re-focusing on financial stability risks, Chinese authorities have announced cuts of between 30-50% of steel production in Tangshan (a
key steel production region that accounts for circa 8% of global steel output) to reduce carbon emissions and improve air quality.
- The Chinese government has indicated a desire to keep steel production in 2021 capped at or below 2020 levels.
Market Insights: Iron ore market dynamics 8Iron ore demand
Strong recovery in global ex-China steel demand as economies re-open from COVID-19
Global steel demand US President Biden’s infrastructure plan
New spending
2020 2020 2021 (f) 2022 (f) Areas
($bn)
Regions (mt) growth rate (%) Roads and bridges 109
Rail 66
China 995 9.1 3.0 1.0
Electric vehicle (EV) infrastructure 15
Developed markets 343 -12.7 8.2 4.2 Airports 25
Ports and waterways 16
Emerging markets (ex-China) 434 -7.8 10.2 5.2
Other transport spending 81
World ex-China 777 -10.0 9.3 4.7 Other infrastructure (e.g. water, broadband, power
266
infrastructure)
World 1,772 -0.2 5.8 2.7 Total 579
Source: World Steel Association Source: US Whitehouse
• Although the growth rate in Chinese demand for steel is likely to slow from current elevated levels, aggregate global demand for steel will likely increase over the
next several years as the global economic recovery progresses.
- Businesses to catch-up/ramp-up on capital expenditure plans. Household demand for automobiles to increase due to pent-up demand and social distancing.
- Governments to invest in infrastructure to support the recovery (e.g. plans already announced in Australia and US) and to assist in the ‘green and digital
transition’ of the economy.
• As at late June, there is support for US President Biden’s ‘Bipartisan Infrastructure Framework’ which plans to invest US$579b in new spending on infrastructure
(US$1.21t over eight years when renewal of existing funding of infrastructure is included). Although the plan seeks to invest in new areas such as electric vehicle
infrastructure, a significant amount of the spending will still be in commodity-intensive areas (e.g. rail and bridges). Europe has announced infrastructure
investments (part of the EUR750b ‘NextGenerationEU’ plan) but details of the plan are currently lacking.
• A global infrastructure boom may lead to an aggregate increase in demand for iron ore, however, there are mitigating factors.
- Increasingly, new infrastructure projects are in less steel intensive areas (e.g. data centres, electric vehicle charging stations, renewable energy, batteries).
- Unlike China, developed countries heavily use recycled scrap steel rather than iron ore to meet their steel demand. For example, electric arc furnaces (which
predominantly use scrap steel) account for around 10% of China’s steel production while in the US, it accounts for an estimated 70% of steel production.
Market Insights: Iron ore market dynamics 9Iron ore supply
Supply outlook from major supplier, particularly Brazil remains quite subdued
Iron ore supply (Mt) Brazilore
Brazil iron ironexports
ore exportstotoApr
May 2021
2021
400
40
380 35
360 30
Million tonnes
25
340
Million tonnes
20
320
15
300
10
280 5
260 0
10 11 12 13 14 15 16 17 18 19 20
Source: World Steel Association (2020); Department of Industry, Science, Energy and Rolling 1Y exports Monthly exports (RHS)
Resources (2020). Note: Mt = million tonnes. Source:
Source:RefinitivRefinitiv
Datastream Datastream, Frontier
• Supply is expected to expand but unlikely to catch up to strong demand at least in the near-term.
- Australian major iron ore producers are operating near their long-term capacity, suggesting capacity to increase output to meet the increase in demand is
limited in the near-term. Although there is some increase in planned mining capital expenditure in Australia, it is so far small relative to the previous
commodity boom. Overall Australian production is expected to only increase marginally over the next few years as some of the new added capacity will
replace existing depleting production.
• Additional supply will rely on Vale’s recovery post the dam collapse disaster in early 2019. Vale’s production is expected to recover very gradually.
- The collapse of the Brumadinho dam was estimated to reduce Vale’s output by 40 million tonnes per year. Vale is now facing much stricter regulatory
requirements and has needed to take a more cautious approach to rebuilding its production. Production plans have also been derailed by the impact of
COVID-19 and unexpected higher rainfalls.
- Vale is forecasting to achieve a full recovery by end 2022, but this schedule faces delays arising from the resurgence of COVID-19 in Brazil. Vale has missed
their earlier production target for 2020.
Market Insights: Iron ore market dynamics 10Iron ore supply
Geopolitical risk and longer term supply
Location of Simandou mine Ownership of high-grade Simandou deposits
Resource Grade
Ownership Deposit
(Mt) (Fe %)
China-led consortium:
SMB 25%, Singapore’s Winning
Simandou North
Logistics 25%, Guinean’s United 2,000 65%
(Block 1 & 2)
Mining Supply 25%, China’s
Shandong Weiqiao 25%.
Rio-led consortium:
Simandou South
Rio 45%, Chinalco 40%, Guinean 2,757 65.5%
(Block 3 & 4)
gov. 15%.
Proposed rail line
Source: Google Maps, Frontier Source: Company reports, Goldman Sachs
• As mentioned in our May 2021 China virtual trip paper, geopolitical tensions between China and Western democratic countries are likely to be structural given
deeply rooted differences that are difficult to resolve. An escalation in geopolitical risk seems unlikely in the near term given governments are focused on their
country’s economic recovery. China is also unlikely to escalate trade tensions with the US given their reliance on key sectors like technology.
• As such, it is quite possible for China to escalate geopolitical tensions with Australia to set an example. However, it is unlikely for China to act on Australian iron
ore exports given Australia’s share of the iron ore market and the sheer size of China’s demand. However, we have heard anecdotes that some Australian iron
ore producers are worried China may impose taxes or price caps on Australian iron ore.
• China has been investing in African iron ore deposits to reduce its reliance on foreign-owned iron ore. This remains more of a medium- to longer-term issue. One
of the key projects is the Simandou mines in Guinea. Production from these mines is not expected to start until at least 2025 with the deposits potentially
supporting 150-200Mt/pa at full production capacity (equates to around 10% of current iron ore seaborne supply).
- The mines are expected to take an extended time to develop. It will require around 700km of rail tracks with multiple bridges and tunnels to haul the iron ore
to a deep-water seaport that has yet to be built.
Market Insights: Iron ore market dynamics 11Economic implications
The concentration of Australian exports to iron ore is a potential risk to the economy
Australia’s GDP growth (% yoy) Australia’s current account (% GDP)
12 6
Iron ore drops to
9 4
US$90/tonne (before
2 Brazil’s supply disruptions)
6
0
3
-2
%
0 -4
-3 -6
-6 -8 Extreme case when iron
ore drops to US$55/tonne
-9 -10
Q4 Q2 Q4 Q2 Q4 Q2 Q4 Q2 Q4 Q2 Q4
2019 2020 2020 2021 2021 2022 2022 2020 2020 2021 2021
Base (pre COVID) Base (post COVID)
AU-CHN trade war Actual Actual Iron ore crash Iron ore correction
Source: Refinitiv Datastream, Treasury, Frontier
Source: Refinitiv Datastream, Frontier Note: The Australian Treasury forecasts that the iron or price declines to US$55/tonne
by the end of the March quarter 2022.
• Given the importance of iron ore to Australian exports a reversal of iron ore price would be detrimental to economic growth and our current account positioning.
- Although unlikely, under an extreme trade war scenario where there is a ‘sudden stop’ in commodity and services exports to China in 2022, the modelling
suggests Australia’s GDP could contract by 3%. Although not as severe as the COVID-19 recession, it is still a materially negative scenario.
- The increase in iron ore prices has also improved the Federal government’s financial position. Almost half the increase in tax revenue in the March 2021
quarter compared to the same quarter last year was attributed to the higher iron ore prices by the Parliamentary Budget Office.
• Australia has posted a current account surplus in recent years due to an increase in our commodity export (driven by volume and price).
- In a scenario where the iron ore price reverts to pre-Brazil’s supply issue levels (circa US$90/tonne), Australia’s current account will likely be flat. In a more
extreme scenario where the iron ore price falls to US$55/tonne (as forecasted by the Treasury), Australia will have a modest current account deficit.
Market Insights: Iron ore market dynamics 12Level 17, 130 Lonsdale Street Melbourne, Victoria 3000 Tel: +61 3 8648 4300 frontieradvisors.com.au @frontier_adv Disclaimer: Frontier Advisors Pty Ltd ABN 21 074 287 406 AFS Licence No. 241266 The information contained in this presentation is current as at the date of preparation, but may be subject to change. The information contained in this presentation is intended as general commentary and should not be regarded as financial, legal or other advice. This presentation has been prepared without taking into account your objectives, financial situation or needs. You should consider this presentation in light of these matters. Should you require specific advice on the topics or areas discussed please contact the presenter directly or an appropriate advisor. This presentation may contain forward-looking statements. These are not facts, rather, these forward-looking statements are based on the current beliefs, assumptions, expectations, estimates, and projections of Frontier Advisors Pty Ltd about the business, the industry and the markets in which we operate. Past performance is not a reliable indicator of future performance. Frontier Advisors Pty Ltd makes no representation or warranty that any of the information contained in this presentation is accurate or complete. To the maximum extent permitted by law, Frontier Advisors Pty Ltd does not accept any liability for loss arising from any reliance placed on the use of this presentation including the information contained within it. The contents of this presentation are confidential and must not be disclosed to any third party without our written consent. This presentation must not be copied, reproduced or distributed without the written consent of Frontier Advisors Pty Ltd. Frontier Advisors Pty Ltd does not provide taxation advice and you should seek your own independent taxation advice from a registered tax agent.
You can also read