Bali Hotel & Branded Residences Update - November 2013 - Hotel, Tourism and Leisure
←
→
Page content transcription
If your browser does not render page correctly, please read the page content below
TM

Hotel, Tourism and Leisure

Bali Hotel & Branded
Residences Update
November 2013

Bali Hotel & Branded Residences Update                                                 November 2013

HOTEL & BRANDED RESIDENCES UPDATE                          Hampered by continuing renovations in 2012, the
                                                           newly completed Ngurah Rai airport aims to boost
Interesting times ahead for                                capacity from 13.5 million to 25 million passengers.
Bali hoteliers: remain strong                              The renovations began in May 2012 and were
                                                           completed in September 2013. It is understood that
on rates and tailor new                                    they have doubled the size of the airport’s international
product development for                                    terminal, while the domestic terminal is now five times
                                                           larger. In 2012, Ngurah Rai welcomed more foreign
market gaps.                                               tourists than any other airport in Indonesia, processing
                                                           nearly 1 million people more than Jakarta’s Soekarno
BALI TOURISM ARRIVALS
                                                           Hatta airport. This represents a total of 36% of foreign
Bali’s tourism arrivals grew but at a slower pace in
                                                           direct arrivals to Indonesia.
2012 recording a 6% YOY increase compared to the
nearly 20% YOY growth in each of the 4 previous
                                                           Expansion of Soekarno Hatta airport also began in
years. An additional 0.5 million people descended on
                                                           2012 but is not scheduled to complete until late 2014.
Bali’s stressed infrastructure, nearly 80% of which were
Indonesians. This is down in real terms from increases
                                                           INDONESIA TOP 3 AIRPORTS
of nearly 1.3 million people in 2011 and 2010.

Domestic arrivals topped 6 million for the first time,
up 7% YOY, with foreign arrivals just under 3 million,
up 4% YOY.

The proportion of international to domestic arrivals
continued its 5 year decline, down to just over 30%.
Domestic tourism arrivals have more than doubled in
4 years, paralleling 5 years of solid growth in domestic
consumption and rising commodity prices, the
combination of which has kept Indonesia’s economy
                                                           Source : BPS Statistics Indonesia
strong despite flagging foreign economies.

BALI DOMESTIC VS FOREIGN

Source : BPS Statistics Indonesia

www.horwathhtl.com              www.c9hotelworks.com                                           TM
Bali Hotel & Branded Residences Update                                                November 2013

PHUKET VS BALI: THE BATTLE FOR REGIONAL                   It is believed that Bali’s tourism growth is impacted by
RESORT SUPREMACY!                                         the government’s slow response to infrastructure
The battle has taken an interesting turn YTD June 2013:   failures: traffic jams, garbage disposal, water, electricity
the foreign arrivals’ gap between Phuket and Bali         and safety matters are a major concern for visitors,
narrowed further in 2012 and was reversed for the first   especially long haul Europeans.
time YTD June 2013, with Phuket’s remarkable 5 year
growth (ignoring the 2009 hiccup caused by airport        In addition, as domestic incomes increase and the
closures and demonstrations) continuing.                  LCC routes proliferate, there is a possibility that
                                                          domestic tourists will go further afield than Bali to
As seen below, YTD June 2013, Phuket foreign arrivals     Singapore, Bangkok and even Phuket. Data from
numbers inched ahead of Bali by around 80,000             the Transportation Ministry shows the number of air
passengers, up another 30% YOY. The encouraging           passengers flying with LCCs reached almost 35 million
news is, however, that total tourism numbers to both      in 2012, representing 47% market share which is
destinations has increased an impressive 0.5 million      predicted to reach 55% over the next few years.
people in 12 months.
                                                          NATIONALITY MIX
FOREIGN BALI VS PHUKET

                                                          Source : BPS Statistics Indonesia
Source : BPS Statistics Indonesia

www.horwathhtl.com              www.c9hotelworks.com                                          TM
Bali Hotel & Branded Residences Update                                             November 2013

In 2012, South Korea replaced Taiwan in the top 5          Not surprisingly, Australasia is the single most
source markets for foreign arrivals to Bali. The big 3     important source region for Bali arrivals with 30%,
contributors remained the same as in 2011, with            followed by Asia Others (China, Japan, South Korea,
Australia leagues ahead of the rest followed by China,     Taiwan etc) with 29%, a proportion that has fallen
slightly reducing the gap and Japan. It was the 1st time   from 45% in 2007 despite the increase in Chinese
since 2009 that Japanese arrivals numbers increased,       visitors. Europe’s contribution to Bali arrivals has been
with a small 5% recovery. Taiwan was a big                 falling gradually over the last 5+ years whereas ASEAN
disappointment, with arrivals falling 26% YOY, causing     contributions have been inching upward. Singapore
them to drop from the top 5.                               and Malaysia generate 80% of ASEAN arrivals, both of
                                                           which have grown 15- 20% YOY since 2005.
It is safe to say, that Australia will continue to lead
the way for the next few years, but China is hot on its    HEALTHY GROWTH IN ADR -
heels. An additional 74,036 Chinese nationals landed       NOT SO HEALTHY DECLINE IN OCCUPANCY
 in Bali in 2012, a 31% YOY increase, more than            Market wide, Bali hotels have shown consistently great
doubling the increase from Australia of 32,856 people      rate growth, 8% annually on average between 2008
representing a 4% YOY increase. The next big mover         and 2012. Occupancy on the flipside has fluctuated,
was New Zealand with an increase in 12,029 people,         struggling with the high amounts of new supply
32% up from their 2011 figure.                             opening on the island.

For regional comparisons, we split Asia into ASEAN and     HOTEL PERFORMANCE 2008 - YTD JUNE 2013
Asia Others, and we combined Australia & New
Zealand into Australasia.

TOP FIVE FOREIGN MARKETS 2012
Australia  28%
China      11%
Japan      7%
Malaysia   6%
Taiwan     4%

TOP FIVE GROWTH MARKETS 2012
China      74,036                                          Source : BHA and Horwath HTL
Australia  32,856
New Zealand12,029                                          YTD June 2013 has seen occupancy fall to below 70%,
Malaysia   10,228                                          down 4% YOY with ADR increasing by around USD 5,
UK         7,454                                           creeping above the USD 150 mark. RevPAR is
                                                           subsequently down USD 3 on the same period last
TOP FIVE REGIONAL MARKETS 2012                             year. It is expected that this negative trend will
Australasia 30%                                            continue to the end of 2013.
Asia Others 29%
Europe      22%                                            PERFORMANCE BY SEGMENT
ASEAN       13%                                            Luxury (> USD 350): in 2012 the global economic
Americas    5%                                             uncertainties seemed to affect occupancy levels in
                                                           the luxury market with RND fell about 9% over 2011.
Source : BPS Statistics Indonesia                          This had a negative impact of 2% in occupancy.
                                                           With a small ADR increase, RevPAR effectively flat-lined
                                                           between 2011 and 2012.

www.horwathhtl.com              www.c9hotelworks.com                                      TM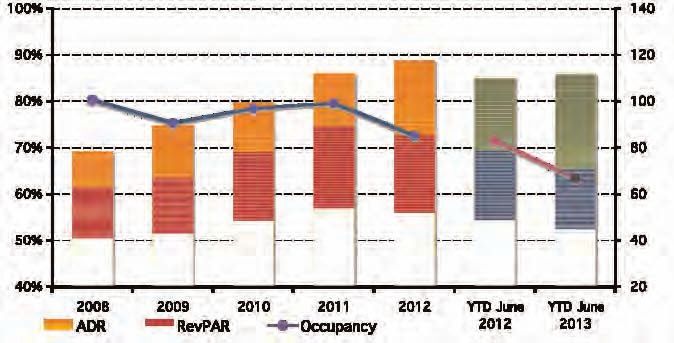
Bali Hotel & Branded Residences Update                                         November 2013

YTD June 2013 and the luxury segment have seen         YTD June 2013, upper upscale hotel performance has
improvement in RND (up 5% YOY) and occupancy           been flat, with RND and occupancy static and ADR
(nearly 2% up YOY) with ADR up marginally. This has    and RevPAR up marginally over the previous year.
led to a 3% YOY increase in RevPAR which equates to
nearly USD 10.                                         UPPER UPSCALE HOTEL PERFORMANCE 2008 -
                                                       YTD JUNE 2013
LUXURY HOTEL PERFORMANCE 2008 -
YTD JUNE 2013

                                                       Source : BHA and Horwath HTL

Source : BHA and Horwath HTL                           UPSCALE (USD 101 - 150): YOY, the upscale
                                                       segment underperformed in 2012 and YTD June 2013.
UPPER UPSCALE (USD 151 - 349): Great ADR and           This is in large part due to an influx of new supply and
RevPAR performance recorded by this segment in         could also indicate that guests are upgrading their
2012, up 9% and 7% respectively YOY. This is the 4th   hotel choices to Upper Upscale. ADR was up 5% in
consecutive year of ADR increases (8% annually from    2012 but RND, occupancy and RevPAR all fell by 4%,
2008 to 2012) and the 3rd year of improvements in      9% and 4% respectively.
RevPAR.

www.horwathhtl.com             www.c9hotelworks.com                                   TM
Bali Hotel & Branded Residences Update                                           November 2013

YTD June 2013, RND, occupancy and RevPAR are             MIDSCALE HOTEL PERFORMANCE 2008 -
down with the latter showing a fairly large 10% fall     YTD JUNE 2013
YOY (equating to USD 8). ADR is the only indicator
that has stood tall, with a small but symbolic 2%
increase over the same period in 2012.

UPSCALE HOTEL PERFORMANCE 2008 -
YTD JUNE 2013

                                                         Source : BHA and Horwath HTL

                                                         OCCUPANCY PERFORMANCE BY LOCATION

Source : BHA and Horwath HTL

MIDSCALE (USD 40 – 101): midscale hotels showed
remarkable resilience in 2012 with a very large number
of new properties opening and battling for business.
The 18% YOY increase in RNA was almost matched
by RND increases, such that occupancy only took
a 1% hit, down to a solid and still impressive 75%.
Price wars were also seemingly avoided with ADR          Source : BHA and Horwath HTL
in the midscale segment falling slightly and RevPAR
down 3% YOY.                                             In terms of occupancy by region in 2012, Legian &
                                                         Seminyak was head to head with Kuta & South Kuta
This resilience has been further tested YTD June 2013    Beach-Tuban, following a large YOY fall in occupancy
however, with less impressive results. With RNA          in the Kuta region. These areas are the mostly densely
remaining static, RND is down 5% YOY causing a           populated in Bali with a perfect combination of beach
4% fall in occupancy. ADR has remained static at         and 24 hour entertainment. The Ubud area is still far
around USD 64 but due to the hit in occupancy,           behind other areas in Bali with occupancy percentages
RevPAR is also down 4% YOY.                              in the low 60s due to a combination of luxury product,
                                                         isolation, lack of amenities and poor accessibility.

                                                         YTD June 2013 has shown occupancy falls across the
                                                         board, with Jimbaran suffering the least.

www.horwathhtl.com             www.c9hotelworks.com                                     TM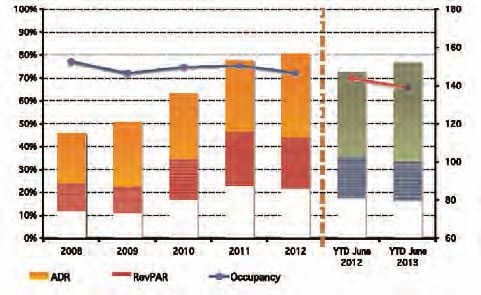
Bali Hotel & Branded Residences Update                                            November 2013

ADR PERFORMANCE BY LOCATION                               OUTLOOK FOR 2013/14
                                                          In 2012 Indonesia’s central bureau of statistics (BPS)
                                                          recorded more than 24,000 hotel rooms were available
                                                          in Bali, up 2,000 in just 12 month. A further, and much
                                                          more significant, 6,000 new rooms are expected to
                                                          enter the market in 2013 (around 4,000 of which have
                                                          already opened this year). If this eventuates Bali
                                                          inventory will top 30,000 rooms.

                                                          The following table shows projected inventory
                                                          increases to 2016 based on rumoured developments.

Source : BHA and Horwath HTL                              SUPPLY GROWTH 2012-2016

Not surprisingly with their high proportion of luxury
product, Jimbaran and Ubud are leading the pack for
ADR performance by region with average ADR of
around USD 300, YTD June 2013. Rates have been
consistently growing in these markets since 2009.
Legian/Seminyak and Nusa Dua/Tanjung Benoa are
around USD 100 lower and the remaining Kuta/Others
a further USD 50 lower. YTD June 2013,
Legian/Seminyak is up, recovering ground from a
decline in ADR in 2012 over 2011. Otherwise, ADR
growth has been quite flat YTD June 2013 across the       Source : BHA and Horwath HTL
board. Rates increase as the mass market orientation of
the region reduces. Candi Dasa, Sanur, and Tabanan all    Clearly investors still believe that Bali has growth
fall under Others and are in a developing stage with a    potential and the government is coming to the party
lack of international brand options.

www.horwathhtl.com             www.c9hotelworks.com                                      TM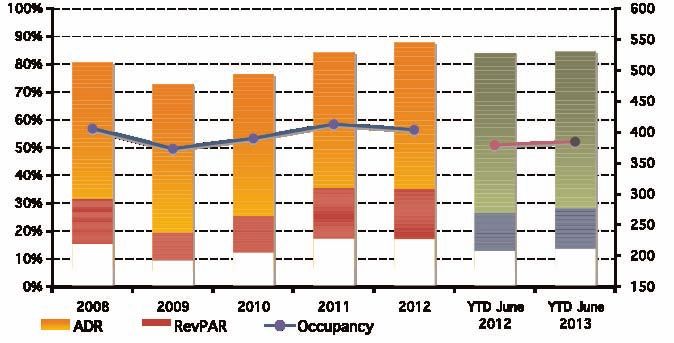
Bali Hotel & Branded Residences Update                                             November 2013

with long overdue infrastructure improvements                 Gridlock, raw sewage, power outages, rogue
namely; the airport expansion completed in time for           developments that ignore the no-new
the APEC conference in October 2013; and the Ngurah           development moratorium, lack of fresh water and
Rai – Tanjung Benoa toll road which was officially            trash are hampering growth in tourism arrivals.
opened in late September. There is however, as we all
know, a long way to go.                                    SUPPLY BY STAR 2012-2016

Of the rumoured new hotel developments to 2016,
50% is happening in the South: Nusa Dua, Bukit
(Uluwatu)-Pecatu, Tanjung Benoa, & Jimbaran. West
Bali, which already has the majority of hotel rooms, is
not far behind and will house 35% of the projected
new supply.

The remaining 15% of new supply will be dispersed
around the island, in the undersupplied north, central
and eastern areas.
                                                           Source : BHA and Horwath HTL
SUPPLY BY AREA 2012-2016
                                                           Looking at distribution of new hotels to 2016 by
                                                           positioning, the mix is well spread and maintains the
                                                           current proportions of 3, 4 and 5 star rooms. That said,
                                                           in 2012 the bulk of new properties are at the lower
                                                           end, 3 star or less and in 2013 there is a greater number
                                                           of 4/5 star properties scheduled to open their doors.

                                                           MONITORING ENERGY & WATER CONSUMPTION
                                                           Energy consumption has become a major concern
                                                           lately, with the government reducing electricity subsidies
                                                           further in 2013. Electricity is set to increase by 15% in
Source : BHA and Horwath HTL                               the coming year, in quarterly increments of 3.75%.

With this massive increase in supply there are going to    Our collection of energy and water statistics, in
be both occupancy and rate pressures in Bali over the      conjunction with the BHA only began in 2012 so the
coming years. It is believed that the keys to weathering   figures presented are for year-end 2012.
any potential storm that may rain down on Bali in the
next few years include:
• focussed development, build what makes sense
  in terms of positioning and size, examine the
  market, do the research;
• avoid price wars. Tourism numbers will increase,
  new properties will induce new demand, LCC will
  fly in more guests so resist dumping prices
  as occupancy slips; and
• continue lobbying the government to improve
  infrastructure. New roads to open up the north
  and improve access to the east would be a great          Source : BHA and Horwath HTL
  start.

www.horwathhtl.com             www.c9hotelworks.com                                       TM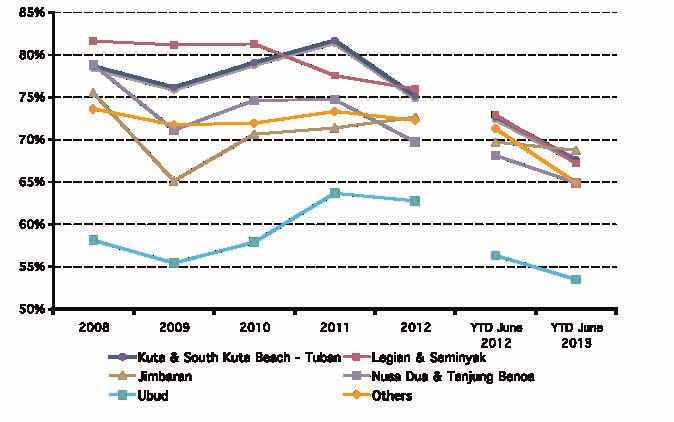
Bali Hotel & Branded Residences Update                                              November 2013

Not surprisingly, Luxury properties use significantly       Water cost is quite difficult to track in Bali as deep well
more electricity PAR than other hotel categories. This is   supply is free and as mentioned above hotels’
due to a combination of factors including the high          supplement mains water with the free water. Figures
proportion of standalone villas to block rooms, fewer       can therefore be misleading. That said, the figures we
keys to spread BOH and FOH power usage, general             have are shown below.
property size and plunge pools.

From electricity consumption to cost, luxury properties
are spending almost triple the upper upscale properties
in electricity PAR.

                                                            Source : BHA and Horwath HTL

                                                            HOTEL BRANDED RESIDENCES MARKET

                                                            Brand concentration sets the
Source : BHA and Horwath HTL                                stage for the Bali market’s
Mass resort development on the island has also
                                                            next step forward
affected fresh water supplies which is causing concern
                                                            Over the past few years, the Bali property market has
in the general community. Hotels & resorts still
                                                            witnessed a dramatic shift in demand towards hotel
supplement mains water with deep well water which
                                                            branded/managed projects across all segments. The
puts the local community at risk as they compete for
                                                            hospitality led residential property sector has been
this limited resource.
                                                            strengthened by domestic buyers which created strong
                                                            underlying demand and favorable market conditions.
                                                            With increasing access from Jakarta, Surabaya and
                                                            other domestic cities, Bali continues to be a popular
                                                            playground for Indonesians.

                                                            Looking forward a series of upcoming international
                                                            branded products with real estate offerings such as
                                                            Rosewood, Raffles, Jumeirah and Shangri-La will induce
                                                            more demand to the island. It is anticipated that the
                                                            Island of Gods will attract a wider base of international
                                                            visitors which will create sustained tourism and in turn
Source : BHA and Horwath HTL
                                                            spur real estate demand. Though there continues to be
                                                            a post GFC disconnect over low transactional levels of
For similar reasons as for power consumption, Luxury
                                                            hotel branded pool villas over the one million dollar
properties consume significantly more water than other
                                                            mark.
segments. Their water consumption is double that of
the upper upscale properties.

www.horwathhtl.com             www.c9hotelworks.com                                        TM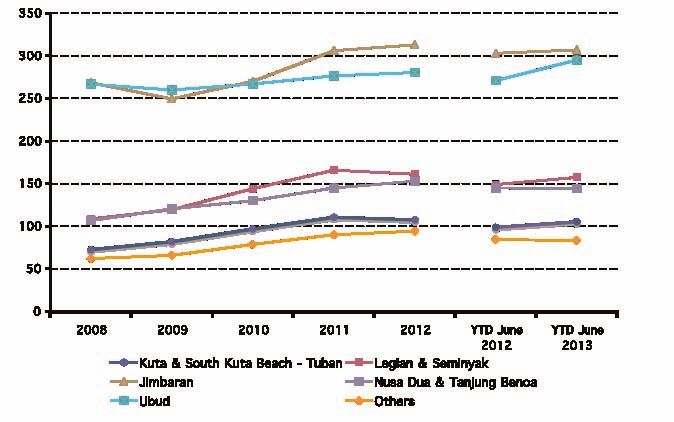
Bali Hotel & Branded Residences Update                                                 November 2013

The Bali residential market remains in a growth stage in      PRICING COMPARISON
its property cycle. Every new upper-tier resort
development in Bali continues to induce added levels
of demand to the island. This indicates the unrealized
potential of the market and supports well structured
and rational development as the market evolves. There
are warning signs though in the broad condominium
hotel market for products developed in tertiary
locations and offering guaranteed returns which may
not be sustainable in the long term. A significant
secondary market is looming in the not too distant            Source: C9 Hotelworks Market Research
future.

Looking forward, the growing middle class population
                                                              Bali achieved higher average
in Indonesia continues to view Bali favorably both in         selling price per Sq M at
aspirational and investment terms. While its expected
that the island’s real estate sector will remain relatively
                                                              US$5,432
healthy, the underlying concern remains regarding
overbuilding and a potential cooling down in the              HOTEL MANAGED APARTMENT/
property market.                                              CONDOMINIUM PROJECTS
                                                              A total of 800 units representing 8 projects which are
BALI VS. PHUKET HOTEL MANAGED                                 currently for sale are identified in our analysis.
APARTMENT/CONDOMINIUM PROJECTS

CURRENT INVENTORY AND
SALES PACE COMPARISON

                                                              Source: C9 Hotelworks Market Research

                                                              Two-thirds of inventory
                                                              is located in Seminyak
Source: C9 Hotelworks Market Research

Phuket outperformed Bali
with 9.8 units sold per month
compared to 8.4 units

www.horwathhtl.com           www.c9hotelworks.com                                               TM
Bali Hotel & Branded Residences Update November 2013
HOTEL BRANDED VILLA PROJECTS APARTMENT/CONDOMINIUM PROJECT METRICS
We identified 226 villas from 6 projects which are on
offer in the primary market segment. INVENTORY MIX
Source: C9 Hotelworks Market Research
55% of total units were Source: C9 Hotelworks Market Research
launched during 2009-2010
Studios and 1-bedroom units
HOTEL BRANDED VILLAS VS.
APARTMENTS/CONDOMINIUMS
most dominant with 49%
and 33% share respectively
INVENTORY MIX
AVERAGE PRICE PER SQUARE METER BY TYPE
Source: C9 Hotelworks Market Research
UNIT AVAILABILITY
Source: C9 Hotelworks Market Research
One and two bedroom types
premium priced with average
of US$6,159 per sqm
Source: C9 Hotelworks Market Research
www.horwathhtl.com www.c9hotelworks.com TMBali Hotel & Branded Residences Update November 2013 CURRENT INVENTORY & MARKET ABSORPTION HOTEL BRANDED VILLA PROJECTS BY TYPE UNIT SIZE BY TYPE Source: C9 Hotelworks Market Research Source: C9 Hotelworks Market Research One bedroom type most 60% of all villas are one popular with average sales bedroom configurations pace of 3.3 units per month BRANDED VS. NON-BRANDED AVERAGE PRICE PER SQUARE METER BY TYPE Source: C9 Hotelworks Market Research Source: C9 Hotelworks Market Research Hotel branded units Built up price per square accounted for 35% of meter averaged US$4,041 total inventory, achieving higher monthly sales pace of 3.5 units www.horwathhtl.com www.c9hotelworks.com TM
Bali Hotel & Branded Residences Update                                       November 2013

CURRENT INVENTORY & MARKET ABSORPTION               CURRENT INVENTORY & MARKET ABSORPTION
BY VILLA TYPE                                       BY LOCATION

Source: C9 Hotelworks Market Research               Source: C9 Hotelworks Market Research

Average sales absorption rate Villa design and views are
recorded at 0.4 per month,    the most important factors
led by one bedroom units      driving project success

www.horwathhtl.com           www.c9hotelworks.com                                     TM
TM

ASIA PACIFIC                             EUROPE                      NORTH/CENTRAL AMERICA
AUCKLAND, NEW ZEALAND                    AMSTERDAM, NETHERLANDS      ATLANTA, USA
auckland@horwathhtl.com                  info@horwathhtl.com         mbeadle@horwathhtl.com

BANGKOK, THAILAND                        ANDORRA LA VELLA, ANDORRA   ATLANTA, USA
ishweder@horwathhtl.com                  vmarti@horwathhtl.com       pbreslin@horwathhtl.com

BEIJING, CHINA                           BARCELONA, SPAIN            ATLANTA, USA
beijing@horwathhtl.com                   vmarti@horwathhtl.com       pgrayboff@ horwathhtl.com

HONG KONG, SAR                           BUDAPEST, HUNGARY           DALLAS, USA
hongkong@horwathhtl.com                  mgomola@horwathhtl.com      jbinford@horwathhtl.com

JAKARTA, INDONESIA                       DUBLIN, IRELAND             CHICAGO, USA
jakarta@horwathhtl.com                   ireland@horwaththl.com      tmandigo@horwathhtl.com

KUALA LUMPUR, MALAYSIA                   FRANKFURT, GERMANY          DENVER, USA
kl@horwathhtl.com                        rknospe@horwathtl.com       jmontgomery@horwathhtl.com

MUMBAI, INDIA                            ISTANBUL, TURKEY            LOS ANGELES, USA
vthacker@horwathhtl.com                  merdogdu@horwathhtl.com     ynathraj@horwathhtl.com

SHANGHAI, CHINA                          LISBON, PORTUGAL            LAS VEGAS, USA
shanghai@horwathhtl.com                  drodrigues@horwathhtl.com   lboll@horwathhtl.com

SINGAPORE, SINGAPORE                     LONDON, UK                  MONTREAL, CANADA
singapore@horwathhtl.com                 eheiberg@horwathhtl.com     pgaudet@horwathhtl.com

SYDNEY, AUSTRALIA                        MADRID, SPAIN               MEXICO CITY, MEXICO
jsmith@horwathhtl.com                    vmarti@horwathhtl.com       mjgutierrez@horwathhtl.com

TOKYO, JAPAN                             MOSCOW, RUSSIA              NEW YORK, USA
tokyo@horwathhtl.com                     mohare@horwathhtl.com       sdavis@horwathhtl.com

                                         OSLO, NORWAY                PHOENIX, USA
                                         pewinther@horwathhtl.com    jreigle@horwathhtl.com
AFRICA
CAPE TOWN, SOUTH AFRICA                  PARIS, FRANCE               SAN FRANCISCO, USA
capetown@horwathhtl.com                  pdoizelet@horwathhtl.com    jhiser@horwathhtl.com

                                         ROME, ITALY                 DOMINICAN REPUBLIC
MIDDLE EAST                              zbacic@horwathhtl.com       sotero@horwathhtl.com
BEIRUT, LEBANON
kamelac@horwathtl.com                    SALZBURG, AUSTRIA           TORONTO, CANADA
                                         gkroell@horwathhtl.com      horwath@horwathhtl.com

                                         WARSAW, POLAND
                                         jmitulski@horwathhtl.com    SOUTH AMERICA
                                                                     BUENOS AIRES, ARGENTINA
                                         ZAGREB, CROATIA             mcarrizo@horwathhtl.com
                                         scizmar@horwathhtl.com
                                                                     SÃO PAULO, BRAZIL
                                         ZUG, SWITZERLAND            mcarrizo@horwathhtl.com
                                         hwerhle@horwathhtl.com
                                                                     SANTIAGO, CHILE
                                                                     cspinelli@horwathhtl.com

                                                                     BOGOTA, COLUMBIA
                                                                     mjgutierrez@horwathhtl.com
                C9 Hotelworks Company Ltd
                9 Lagoon Road, Cherngtalay,
                Thalang, Phuket 83110, Thailand
                T: +66 (0)81 956 1802
                E: bill@c9hotelworks.com
                www.c9hotelworks.com

www.horwathhtl.com
You can also read