UOL GROUP FY2020 RESULTS 26 FEBRUARY 2021 - SGX
←
→
Page content transcription
If your browser does not render page correctly, please read the page content below
UOL GROUP
   F Y 2 0 2 0 R E S U LT S
2 6 F E B R U A RY 2 0 2 1
DISCLAIMER
This presentation may contain forward-looking statements or financial information. Such forward-looking statements and financial
information may involve known and unknown risks, uncertainties, assumptions and other factors which may cause the actual results,
performance or achievements of UOL Group Limited, or industry results, to be materially different from any future results, performance or
achievements expressed or implied by such forward-looking statements and financial information.

Such forward-looking statements and financial information are based on assumptions including (without limitation) UOL Group Limited’s
present and future business strategies, general industry and economic conditions, interest rate trends, cost of capital and capital
availability, availability of real estate properties, competition from other companies, shifts in customer demands, customers and partners,
changes in operating expenses (including employee wages, benefits and training), governmental and public policy changes and the
continued availability of financing in the amounts and the terms necessary to support future business activities.

You are advised not to place undue reliance on these forward-looking statements and financial information, which are based on UOL
Group Limited’s current views concerning future events.

UOL Group Limited expressly disclaims any obligation or undertaking to release publicly any updates or revisions to any forward-looking
statements or financial information contained in this presentation to reflect any change in UOL Group Limited’s expectations with regard
thereto or any change in events, conditions or circumstances on which any such statement or information is based, subject to
compliance with all applicable laws and regulations and/or the rules of the SGX-ST and/or any other regulatory or supervisory body.

This presentation may include market and industry data and forecasts. You are again advised that there can be no assurance as to the
accuracy or completeness of such included information. While UOL Group Limited has taken reasonable steps to ensure that the
information is extracted accurately and in its proper context, UOL Group Limited has not independently verified any of the data or
ascertained the underlying assumptions relied upon therein.
AGENDA
• FY2020 KEY FINANCIALS
• O P E R AT I O N H I G H L I G H T S
• MARKET OUTLOOK
2020 REVIEW
Despite strong headwinds, delivered creditable set of results underpinned by strong
balance sheet
• PATMI fell 97% to $13.1 million for FY2020 (FY2019: $478.8 million) due mainly to
  attributable fair value and other losses of $246.7 million
• Excluding fair value and other losses, attributable profit fell 17% to $259.8 million as higher
  earnings from property development buffer decline in hotel operations due to pandemic
• Positive cash flow for hospitality business from alternative income streams
Achieved healthy residential sales with 794 units booked in Singapore
• Clavon sold about 70% of the total 640 units during launch weekend
Acquisitions and asset enhancement initiatives
• Replenished landbank with acquisition of Canberra Drive site for $270.2 million
• Acquired 158-key Pan Pacific Jakarta in Thamrin Nine, Jakarta for approximately
  $67.5 million
• Capitalised the downtime to refurbish some of its hotels and serviced suites
• Obtained in-principle approvals for the redevelopment of Faber House and asset
  enhancement of Odeon Towers

                                                                                                    4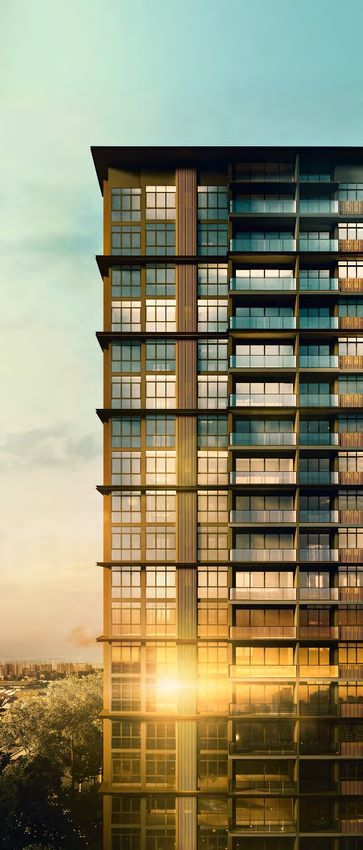
To update

              Avenue South Residence (artist’s impression)

FY2020 KEY FINANCIALS
KEY FINANCIALS

$m                                             FY2020    FY2019    % Change

Revenue                                        1,977.1   2,283.3     -13

Profit before fair value and other (losses)/
                                               443.2     536.1       -17
gains

Other (losses)/gains                            -41.2     28.1       -247

Fair value (losses)/gains on the Group’s
                                               -293.3    220.3       -233
investment properties

Profit before income tax                       108.7     784.5       -86

PATMI                                           13.1     478.8       -97

                                                                              6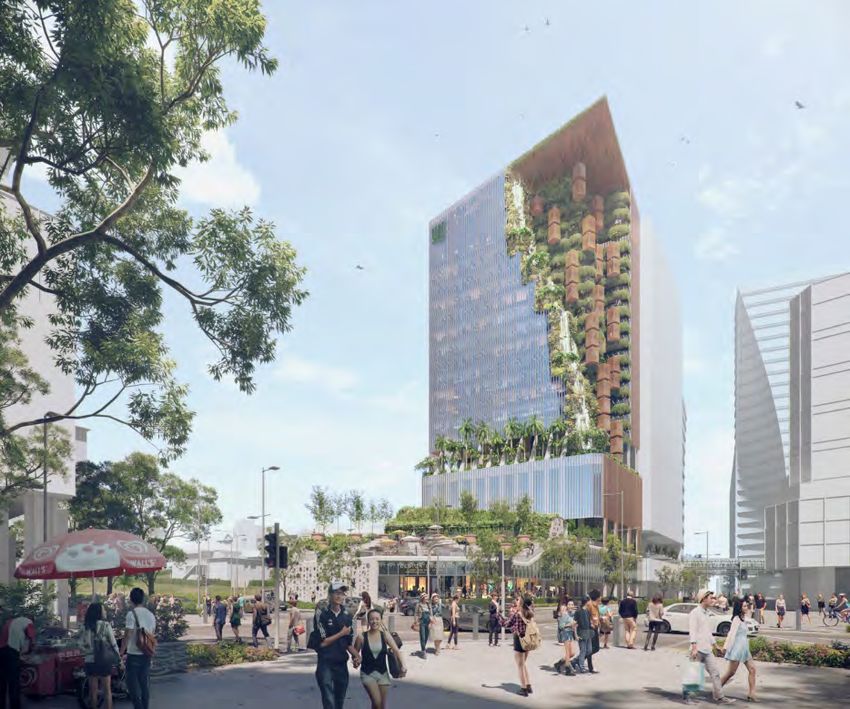
KEY FINANCIALS

                                            FY2020       FY2019      % Change

Earnings per share before fair value and
                                           30.8 cents   37.2 cents     -17
other (losses)/gains
Earnings per share                         1.6 cents    56.8 cents     -97

Net tangible asset value per share          $11.55       $11.86         -3
Return on equity before fair value and
                                             2.6%         3.2%         -19
other (losses)/gains
Return on equity                             0.1%         4.9%         -98

Total equity                               $14,101m     $14,334m        -2

Dividends per share - First and Final      15.0 cents   17.5 cents     -14

                                                                                7
CAPITAL MANAGEMENT
Healthy Balance Sheet as at 31 December 2020                   Total Debt ($m):
                                                                $5,126 million
Cash                        Net debt
$977 million                $4,149 million                                    >3 yrs
                                                                     429
                                                                              (8%)
FY2019: $717 million        FY2019: $4,234 million
                                                                    1,382
Gearing ratio               Average borrowing cost                            2-3 yrs
                                                                              (27%)
0.29                        1.35%

FY2019: 0.30                FY2019: 2.29%
                                                                    1,644
Average debt maturity       Unutilised credit facilities                      1-2 yrs
1.6 yrs                     $2.8 billion                                      (32%)

FY2019: 1.8 yrs             FY2019: $3.1 billion
                                                                    1,671
Term loan                   Interest cover                                    Within
                                                                              1 yr
86%                         (including interest capitalised)                  (33%)
                            8 times
FY2019: 85%
                            FY2019: 8 times
                                                                                   8
CONTRIBUTIONS BY BUSINESS SEGMENT
Revenue by Business Segment
            1200
                   (+11%)                              FY2020                                                FY2019
            1000   943.1
                                                                            847.1
            800
                                                                                            653.7
$ million

                            (-9%)
            600                                                                     551.7
                           503.3
                                    (-62%)
            400                              (+41%)
                                    246.5 225.7
            200                                       (-39%) (-11%)
                                                                                                    160.1
                                                      9.4 49.0                                              15.5 55.2
              0
                                Property development                  Property investments
                                Hotel operations                      Technology operations
                                Management services                   Investments
                                                            FY2020                             FY2019
Property development                                          48%                               37%
Property investments                                          25%                               24%
Hotel operations                                              12%                               29%
Technology operations                                         11%                                   7%
Management services                                            1%                                   1%
Investments                                                    3%                                   2%                  9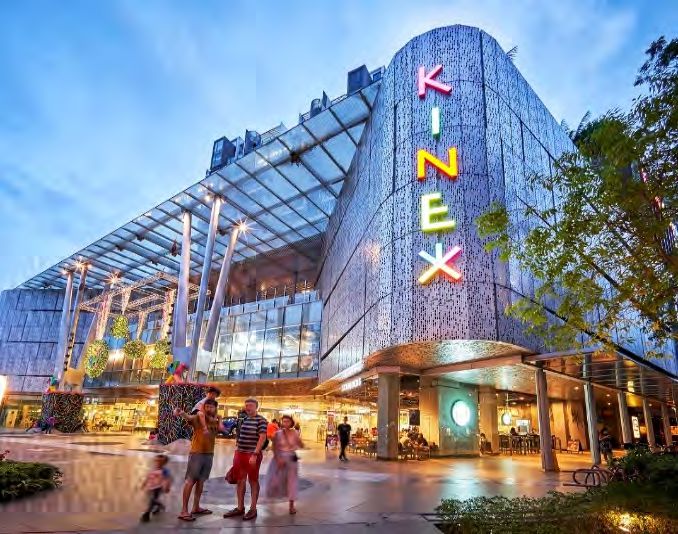
CONTRIBUTIONS BY BUSINESS SEGMENT
       Operating Profit by Business Segment
                                   (-7%)                                                                385.2
             400                   356.4                           FY2020                                                       FY2019
             350
             300
                          (+56%)
             250          206.3
             200
$ million

             150                                                                               132.1
             100                                                          (-12%)                                73.7
                                                      (+110%)             48.9                                                      55.3
              50                                      10.9                                                             5.2   11.9
               0
             -50                                                -4.3
                                                                (-136%)
            -100                            -74.8
                                            (-201%)
                                           Property development                  Property investments       Hotel operations
                                           Technology operations                 Management services        Investments
                                                                             FY2020                                    FY2019
            Property development                                               38%                                      20%
            Property investments                                               66%                                      58%
            Hotel operations                                                  -14%                                      11%
            Technology operations                                                  2%                                   1%
            Management services                                                  -1%                                    2%
                                                                                                                                           10
            Investments                                                            9%                                   8%
CONTRIBUTIONS BY GEOGRAPHY
(%)
Revenue 1 1
73 4 19 2
FY2020: $1,977.1m
80 1
FY2019: $2,283.3m 69 7 2 18 3
Adjusted EBITDA1
FY20202: $651.5m 76 3 19 4
1
FY2019: $856.3m 74 5 15 3 2
Total Asset Value3 1
FY2020: $20,373.5m 83 3 6 7
1
FY2019: $20,653.8m 84 3 6 6
Singapore Australia Malaysia
China United Kingdom Others
1 Excludes unallocated cost, other gains/(losses) and fair value gains/(losses) on investment properties
2 Malaysia and Others recorded negative values 11
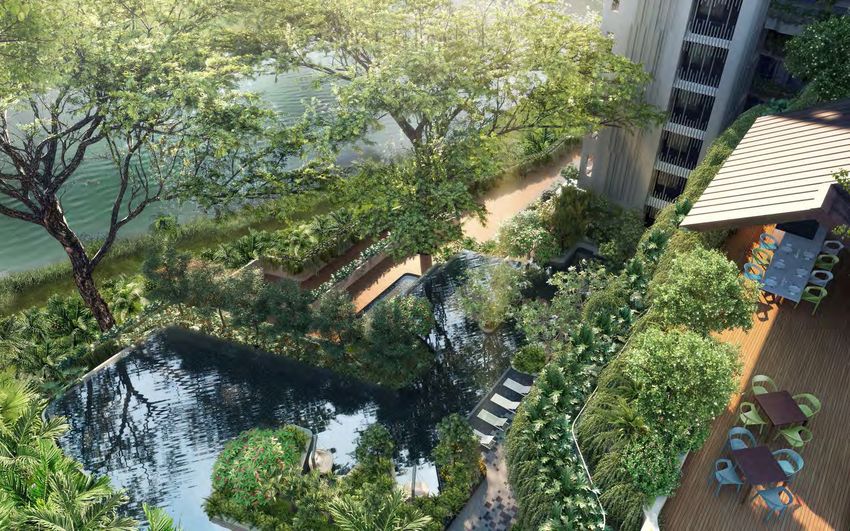
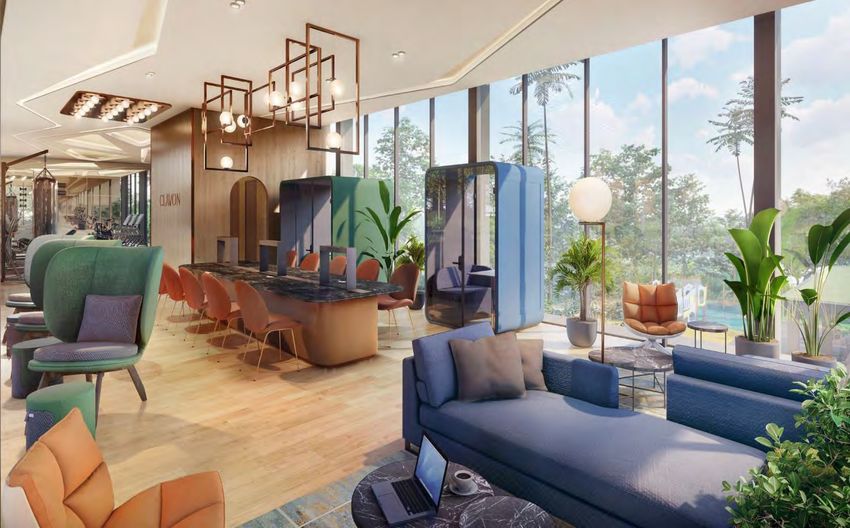
3 Others recorded less than 1% in contributionClavon (artist’s impression) O P E R AT I O N H I G H L I G H T S
PROPERTY DEVELOPMENT
Sales of 794 residential units in Singapore with total value of approximately
$1.24 billion based on bookings in 2020
Project Name         Launch      Total Units   Units Booked    Average psf
                      Date                        in 2020         Booked
                                                              (as at 31.12.20)
Under UOL
Clavon               Dec 2020       640            473            $1,640
Avenue South        Sept 2019                      179            $1,984
                                   1,074
Residence
MEYER HOUSE          May 2019        56             6             $2,490
The Tre Ver          Aug 2018       729             93            $1,596
Amber45              May 2018       139             23            $2,291
Subtotal                           2,638           774
Under UIC
V on Shenton         Jul 2012       510             18            $2,145
Mon Jervois          Apr 2013       109             2             $1,823
Subtotal                            619             20
Total                              3,257           794

                                                                                 13
PROPERTY DEVELOPMENT
Residential Units Booked as at 31 December 2020
Units Booked % Booked#
Total Units Effective Stake
(as at 31.12.20) (as at 31.12.20)
Singapore
Clavon 473 73.9% 640 90%
Avenue South
620 57.7% 1,074 65%
Residence
MEYER HOUSE 10 17.9% 56 50%
The Tre Ver 729 100.0% 729 75%
Amber45 136 97.8% 139 100%
United Kingdom
One Bishopsgate Plaza 36 22.5% 160 100%
China
Park Eleven
318 91.6% 347* 55%
(Phase 1 and 2)
#Based on bookings from date of launch 14
*Reflects number of units that have been launched thus far. 51 units have yet to be launchedPROPERTY DEVELOPMENT
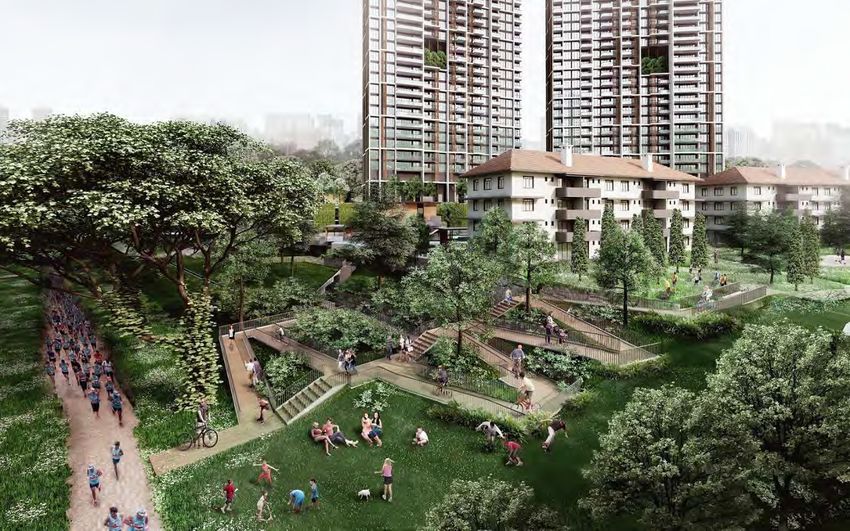
Singapore Residential Pipeline – Canberra Drive Site
• Awarded government land sales site in March
2020 for $270.2 million or $650 psf ppr
• 50:30:20 joint venture among UOL, UIC and
Kheng Leong; 65% effective stake
• Total GFA of 38,593 sqm; estimated 448
residential units
• Growing popularity of the area among young
families
• Close to Canberra MRT station; future North-
South Corridor to shorten travelling time to
the Central Business District
• Upcoming amenities include Bukit Canberra,
an integrated sports and community hub
• Targeted to launch in 2Q2021
Source: URA
15PROPERTY INVESTMENTS
Retail Portfolio – High Committed Occupancy and Shoppers’ Footfall
Retail Committed Occupancy (%) Shoppers’ Footfall (m)
as at 31 December 2020 (Q-o-Q) YTD 31 December 2020 (Y-o-Y)
100% 94.9% 93.5% 90 m
80%
60 m
60%
- 41.7%
40%
30 m
20%
0% 0m
4Q2020 * 3Q2020 YTD FY2020 YTD FY2019
% of Retail Portfolio NLA/NFA expiring in 2021
30%
(as at 31 December 2020)
*Retail Committed Occupancy as at 4Q2020 is inclusive of one lease which is under lease documentation
Note: Retail malls under the Group comprise United Square shopping mall, Velocity@Novena Square, KINEX, West Mall and Marina Square
shopping mall 16PROPERTY INVESTMENTS
Office Portfolio – High Committed Occupancy Maintained
Office Committed Occupancy (%)
as at 31 December 2020 (Q-o-Q)
100.0% 100.0%
100% 94.1% 94.9% 92.1% 93.3%
80%
60%
40%
20%
0%
Singapore Office Properties UK Office Properties Australia Office Property
4Q2020 3Q2020
% of Office Portfolio NLA/NFA expiring in 2021
21%
(as at 31 December 2020)
Notes:
(1) Singapore office properties under UOL Group comprise United Square, Novena Square, Odeon Towers, Faber House, 333 North Bridge Road,
One Upper Pickering, Tampines Plaza 1 and Tampines Plaza 2, Clifford Centre, SGX Centre 2, Singapore Land Tower, Stamford Court, The Gateway
and UIC Building
(2) UK office properties comprise 110 High Holborn and 120 Holborn Island in London 17
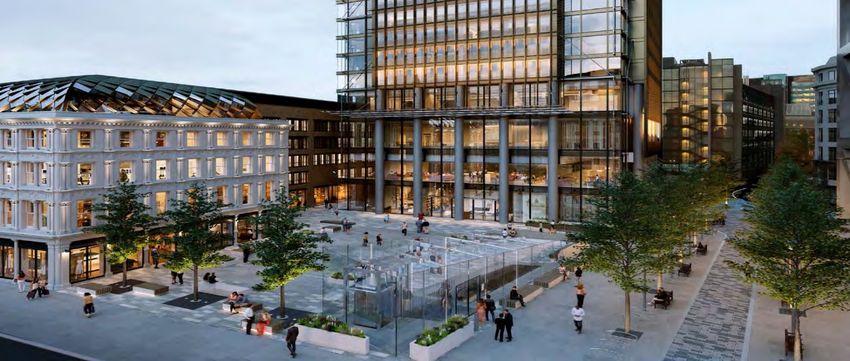
(3) Australia office property refers to 72 Christie Street in SydneyPROPERTY INVESTMENTS
333 North Bridge Road Site – Enlargement of Odeon Towers
• Received in-principle approval from URA to develop
333 North Bridge Road site, which was acquired for
$79.3 million in December 2019
• New standalone 7-storey building is an extension of
Odeon Towers and commands 50m frontage along
North Bridge Road, opposite Raffles Hotel
• New built comprises 5 floors of office space with retail
and F&B located over 4 floors including F&B at the
rooftop; part of existing basement 1 and 2 will be
converted into commercial space
• Total GFA of the combined property is approximately
7,237 sqm
• Features biophilic design elements such as garden
terraces and vertical greenery, and end-of-trip
facilities for bicycle parking
• Construction work is targeted to commence in
4Q2021; completion is targeted to be in 2 years
The enlarged Odeon Towers (artist’s impression) will have a
new seven-storey annex building.
18PROPERTY INVESTMENTS
Diversified Tenant Base of UOL and UIC
5%
5%
19%
22% 6% 25%
7%
4%
4% Office Retail*
7%
11%
5%
8%
6% 22%
8%
6%
8% 15%
7%
Banking, Insurance, Financial Services and Fund Management
Government Agency and Embassies Food and Beverage
Technology, Media and Telecommunications General Retail
Accounting , HR and Business Consultancy Education
Legal Leisure and Entertainment
Pharmaceutical, Medical and Healthcare Fashion and Accessories
F&B, Retail Products and Services Services
Shipping and Marine Sports
Real Estate and Property Services Home Furnishing
Co-working and Serviced Office Supermarket
Others
*Office use in retail malls is excluded 19HOTEL OPERATIONS
Owns and/or manages over 30 hotels with more than 10,000 rooms
• Comprises three highly-acclaimed brands – “Pan Pacific”, PARKROYAL COLLECTION
and PARKROYAL
Photo credit: Sebastien Nagy
PARKROYAL COLLECTION Pickering, Singapore Pan Pacific London, United Kingdom
PARKROYAL COLLECTION Marina Bay, Singapore PARKROYAL Penang Resort, Malaysia 20HOTEL OPERATIONS
Hospitality Performance Affected by International Travel Restrictions
Occupancy for Owned1 Hotels RevPar for Owned1 Hotels
(FY2020 vs FY2019) (FY2020 vs FY20192)
84% $231
83%
67% 68%
$168
59%
32% $90
$82
$76
$33
FY2020 FY2019 FY2020 FY2019 FY2020 FY2019 FY2020 FY2019 FY2020 FY2019 FY2020 FY2019
Singapore3 Oceania Others4 Singapore3 Oceania Others4
1Includes serviced suites and hotels partially owned by the Group
2Reported in Singapore dollars. For comparability, FY2019 RevPar has been translated at constant exchange rates (31 December 2020)
3Excludes PARKROYAL COLLECTION Marina Bay which was closed from March 2020 for major refurbishment. It reopened partially in December 2020
4Refers to the Group’s hotels in China, Vietnam, Malaysia and Myanmar. Excludes PARKROYAL Kuala Lumpur which was closed from June 2020
21
for major refurbishmentHOTEL OPERATIONS
Existing Pipeline
No. of Hotels No. of Rooms No. of Hotels No. of Rooms
By Brand
Pan Pacific 20 6,571 7 1,543
PARKROYAL COLLECTION 2 942 1 535
PARKROYAL 11 3,095 10 2,340
Others 4 1,384 1 250
Total 37 11,992 19 4,668
By Ownership Type
Owned 25 8,637 7 1,917
Managed 11 2,947 12 2,751
Marketing Partnership 1 408 - -
Total 37 11,992 19 4,668
Note: Includes serviced suites and hotels held by associated companies. PARKROYAL Kuala Lumpur was closed since June 2020 for major
refurbishment while as at 1 December 2020, PARKROYAL COLLECTION Marina Bay reopened partially for booking 22HOTEL OPERATIONS
Asset Enhancement Initiatives: Singapore
• As a strategic move, PPHG leveraged the downtime during the pandemic to invest in asset
enhancement initiatives for its hotels and serviced suites
PARKROYAL COLLECTION Marina Bay PARKROYAL on Beach Road PARKROYAL on Kitchener Road Pan Pacific Serviced Suites Orchard
• Transformed into ‘garden- • Refurbished guestrooms • Refurbished guestrooms • All 126 suites, including
in-a-hotel’ and lobby in tropical and lobby, including a 6 penthouses, are
• Added 8 guestrooms to garden design hospitality lounge for early renovated with modern
become a 583-room hotel • Renovated ballroom with arrivals designs
• Refurbished all modern design and • Added 10 guestrooms to • All suites are fitted with
guestrooms with stylish equipment for events become a 542-room hotel water filter taps to
and modern design • Refurbished hotel • Added meeting facilities reduce use of plastics
• Introduced farm-to-table restaurant with fresh, • Revamped hotel • Phased renovation; to
concept at hotel botanical theme restaurant with open complete works by April
restaurant • Completed renovation in kitchen concept 2021
• Partially reopened with January 2021 • Renovated Si Chuan Dou
250 rooms in Dec 2020; Hua to be a modern
renovation to complete by Chinese restaurant
May 2021 • Completed renovation in
November 2020
23HOTEL OPERATIONS
Asset Enhancement Initiatives: Overseas (Malaysia)
PARKROYAL COLLECTION Kuala Lumpur (artist’s impression). Studio Suite at PARKROYAL Serviced Suites Kuala Lumpur.
PARKROYAL COLLECTION Kuala Lumpur PARKROYAL Serviced Suites Kuala Lumpur
• Located in Bukit Bintang, PARKROYAL Kuala Lumpur • 287-suite serviced suites property is given a soft
will be rebranded as PARKROYAL COLLECTION refurbishment
Kuala Lumpur • Refreshed guestrooms with new furniture and
• Closed for major refurbishment since June 2020 upgraded fittings, and installed new air-conditioning
• Renovated guestrooms and converted office units at • Refurbished guest lift veneer panels and installed
its annex building President House to rooms new vinyl floor tiles
• 531-room hotel to reopen in 4Q2021 • Slated to complete by March 2021
Pan Pacific Serviced Suites Kuala Lumpur
• Redeveloped multi-storey car park at PARKROYAL
COLLECTION Kuala Lumpur to be a 210-suite
serviced suites property 24
• Slated to open in 1Q2022HOTEL OPERATIONS
Redevelopment of Faber House into a 250-key hotel
• Received URA’s in-principle approval under
the Strategic Development Initiative (SDI)
scheme
• Re-zoned of the site to hotel use
• Total GFA with plot ratio intensification is
11,025 sqm
• To redevelop into an 18-storey development
featuring a 250-key hotel with a bank, F&B
outlets and an urban verandah
• Construction works are planned to
commence in 1H2022
Faber House (artist’s impression) will be redeveloped into a hotel.
25HOTEL OPERATIONS: OPENINGS
Pan Pacific London
• First “Pan Pacific” hotel in Europe
• Located in Bishopsgate, London’s central financial district
• Part of a 41-storey luxury mixed-use development
• 237 rooms with dining, meeting, fitness and wellness
facilities
• Close to Liverpool Street Station
• Expected to open in 2H2021
Pan Pacific London Suite (artist’s impression).
PARKROYAL Monash Melbourne
• Growing hospitality footprint in Australia
• Located in Melbourne, the 237-room PARKROYAL
Monash Melbourne is part of M-City Monash, a mixed-use
development with office, residential, retail, and hotel
components
• Close to Monash University’s Clayton Campus, Monash
Medical Centre and Commonwealth Scientific and
Industrial Research Organisation
PARKROYAL Monash Melbourne (artist’s
impression). • Targeted to open in April 2021
26HOTEL OPERATIONS
Alternative Revenue Streams for Hospitality Business
• Most Singapore hospitality properties have opened for staycation:
- Pan Pacific Singapore (December 2020)
- PARKROYAL COLLECTION Marina Bay (December 2020)
- PARKROYAL COLLECTION Pickering (November 2020)
- PARKROYAL on Beach Road and Pan Pacific Serviced
Suites Beach Road (July 2020)
• Extension of government quarantine contracts for five hotels in 2021:
- Pan Pacific Melbourne, Pan Pacific Perth, PARKROYAL
Darling Harbour and PARKROYAL Melbourne Airport in Australia
- PARKROYAL on Kitchener Road in Singapore
• Food & Beverage online orders and deliveries
• Hybrid seminars and virtual events such as wedding shows
27
Note: PARKROYAL COLLECTION Marina Bay was closed from March 2020 for major refurbishment and partially reopened in December 2020MARKET OUTLOOK
Global economic recovery is expected to be gradual and uneven with uncertainties
arising from COVID-19 and other headwinds, including any possible prolonged tensions
between the United States and China
Residential
• Sale of new private homes is likely to remain resilient but uneven with stronger demand for smaller units
and in the upgrader market.
• The construction sector is likely to see rising costs due to manpower shortage and safe distancing
measures on-site.
Office
• Office demand is expected to be subdued as firms remain cautious in their expansion plans. However, the
downward pressure on office rents is likely to be mitigated by limited new supply.
Retail
• Retail outlook remains uncertain as safe distancing measures will continue and retailers’ sentiments stay
cautious.
Hospitality
• According to World Tourism Organization, improved traveller confidence following the distribution of
COVID-19 vaccines will see a gradual recovery in international travel. Consequently, visitor arrivals to
Singapore and the rest of Asia Pacific region might see a modest return by the later part of 2021.
• Given the uncertainties brought about by Brexit and the global pandemic, the commercial and hospitality
sectors in the United Kingdom are likely to remain under pressure in the near term.
28CORE BUSINESSES
Property Property Hotel
development investments operations
• Wholly-owned projects • Wholly-owned • Wholly-owned hotels
• Joint-venture projects properties • Joint-venture hotels
• UIC-owned projects • Joint-venture properties • UIC-owned hotels
• UIC-owned properties • Aquamarina Hotel Private
• Marina Centre Holdings Limited – 71.17%*
Pte Ltd – 61.56%*
Notes:
- *Effective interest including interests owned by UIC as at 31 December 2020
- UOL’s other businesses are management services (project management, facilities management, hotel and other management), technology
operations and investments in securities
29COMPANY OVERVIEW
• UOL Group Limited (UOL) was founded in 1963 and listed on the Singapore Exchange in
1964
• Total assets of $20.4 billion as at 31 December 2020
• Geographical presence in 14 countries - Singapore, Australia, UK, China, Malaysia,
Indonesia, Thailand, Vietnam, Myanmar, Cambodia, Bangladesh, Japan, USA and Canada
• Through hotel subsidiary, Pan Pacific Hotels Group Limited, UOL owns and/or manages
over 30 hotels, resorts and serviced suites in Asia, Oceania, Europe and North America
under three acclaimed brands: “Pan Pacific”, PARKROYAL COLLECTION and
PARKROYAL
• Through Singapore-listed property subsidiary, United Industrial Corporation Limited, UOL
owns an extensive portfolio of prime commercial assets in Singapore and has interests in
Pan Pacific Singapore, PARKROYAL COLLECTION Marina Bay and Mandarin Oriental,
Singapore
• Award-winning developer known for corporate, architectural and design excellence
30AWARDS & ACCOLADES
Corporate
UOL Group Limited Pan Pacific Hotels Group Limited
EdgeProp Singapore Excellence Awards 2020 World Travel Awards 2020
• Top Developer • Asia's Leading Lifestyle Hotel Brand
• China's Leading Lifestyle Hotel Brand
BCA Green Mark Awards 2020 Travel Weekly Asia Readers’ Choice Awards 2020
• Green Mark Champion • Best Regional Hotel Chain
Patron of the Arts Awards 2020
• Patron of the Arts
Product, Design and Architectural Excellence
Clavon PARKROYAL COLLECTION Pickering
PropertyGuru Asia Property Awards Grand Final World Travel Awards 2020
2020 • Asia’s Leading Green Hotel
• Country Winner - Best High Rise Condo • World’s Leading Green City Hotel
Architectural Design (Asia)
Avenue South Residence Pan Pacific Orchard
EdgeProp Singapore Excellence Awards 2020 BCA Green Mark Awards 2020
• People’s Choice Award (Residential) • Green Mark Platinum
MEYER HOUSE
International Property Awards (Asia Pacific) 2020
• Winner - Apartment/Condominium Singapore 31BEST IN CLASS PROPERTIES
Award-winning and Quality Properties across Residential, Commercial
and Hospitality Asset Classes
Nassim Park Residences, Singapore
One Bishopsgate Plaza,
London, UK
PARKROYAL COLLECTION The Clement Canopy, Singapore
Pickering, Singapore
32Q&A
You can also read