Investor Presentation - October 2020 - Keppel Corporation
←
→
Page content transcription
If your browser does not render page correctly, please read the page content below
Investor Presentation

October 2020
Outline
                                                                                                                                                                                               Constituent of:
        ▪ Overview                                                                                                                                                             3

        ▪ 3Q 2020 Update                                                                                                                                                       5                 FTSE ST Large &
                                                                                                                                                                                                  Mid Cap Index

        ▪ Market Review                                                                                                                                                      15

        ▪ Additional Information                                                                                                                                             21                  FTSE EPRA Nareit
                                                                                                                                                                                               Global Developed Index
IMPORTANT NOTICE: The past performance of Keppel REIT is not necessarily indicative of its future performance. Certain statements made in this presentation may not be based on
historical information or facts and may be “forward-looking” statements due to a number of risks, uncertainties and assumptions. Representative examples of these factors include
(without limitation) general industry and economic conditions, interest rate trends, cost of capital and capital availability, competition from similar developments or shifts in expected
levels of property rental income, changes in operating expenses, including employee wages, benefits and training, property expenses and governmental and public policy changes, and
the continued availability of financing in the amounts and terms necessary to support future business.
                                                                                                                                                                                                     GPR 250
Prospective investors and unitholders of Keppel REIT (“Unitholders”) are cautioned not to place undue reliance on these forward-looking statements, which are based on the current                 Index Series
view of Keppel REIT Management Limited, as manager of Keppel REIT (the “Manager”) on future events. No representation or warranty, express or implied, is made as to, and no
reliance should be placed on, the fairness, accuracy, completeness or correctness of the information, or opinions contained in this presentation. None of the Manager, the trustee of
Keppel REIT or any of their respective advisors, representatives or agents shall have any responsibility or liability whatsoever (for negligence or otherwise) for any loss howsoever
arising from any use of this presentation or its contents or otherwise arising in connection with this presentation. The information set out herein may be subject to updating, completion,
revision, verification and amendment and such information may change materially. The value of units in Keppel REIT (“Units”) and the income derived from them may fall as well as rise.
Units are not obligations of, deposits in, or guaranteed by, the Manager or any of its affiliates. An investment in Units is subject to investment risks, including the possible loss of the
principal amount invested.
                                                                                                                                                                                                 MSCI Singapore
Investors have no right to request the Manager to redeem their Units while the Units are listed. It is intended that Unitholders may only deal in their Units through trading on Singapore       Small Cap Index
Exchange Securities Trading Limited (“SGX-ST”). Listing of the Units on SGX-ST does not guarantee a liquid market for the Units.

                                                                                                                                                                                                                  2
Sustainable Pan-Asian Portfolio with Income Resilience

  98.3% occupancy                                        7.1 years WALE                                               Green portfolio
                                                                                                               BCA Green Mark Platinum award for
  Grade A commercial portfolio with                     Long portfolio weighted average
                                                                                                              all Singapore assets; 5 Stars NABERS
    strong committed occupancy                               lease expiry (WALE)
                                                                                                              Energy rating for most Australian assets

         AUM(1) by Geography                                       Marina Bay                         One Raffles     Ocean Financial
                                                                Financial Centre                        Quay              Centre
          (As at 30 Sep 2020)

                                  Singapore,
                                    75.9%

South
Korea,         $8.4b
3.6%

  Australia,
   20.5%

                 Note: Information as of 30 Sep 2020.
                 (1) As at 30 Sep 2020, assuming the inclusion of Pinnacle Office Park in Sydney which was announced on 13 Sep 2020 and targeted for
                                                                                                                                                         3
                 acquisition completion in 4Q 2020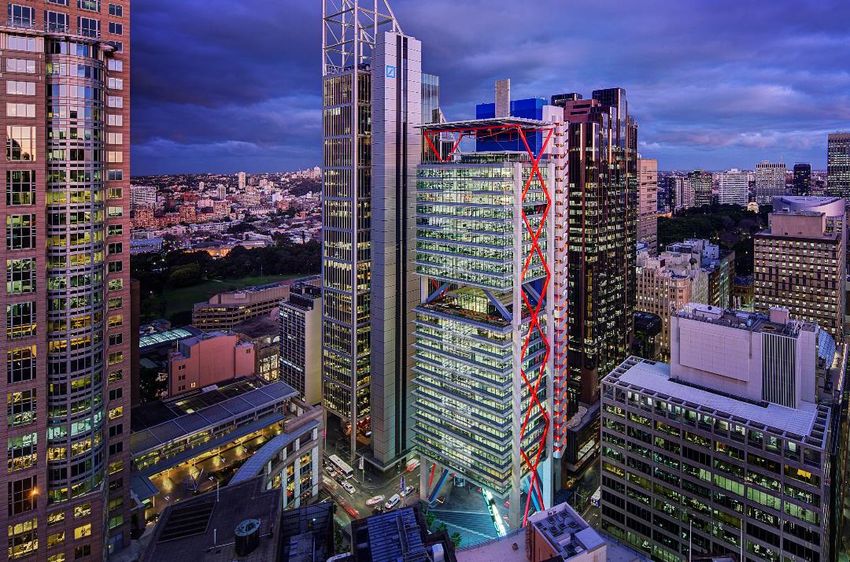
Resilient Portfolio Anchored by Singapore CBD Assets
                       $8.4 billion portfolio in key business districts of Singapore, Australia and South Korea
                                        enhances income diversification and long-term stability

                                                                                                             T Tower, Seoul
                        8 Chifley Square,                                                                    99.4% Interest
                                                    Pinnacle Office
                             Sydney                                              South Korea                Occupancy: 94.7%
                                                     Park, Sydney
                             50% Interest                                                                                                            Ocean Financial
                           Occupancy: 100%
                                                  100% Interest                      3.6%
                                                Occupancy: 96.3%(1)                                                                                      Centre
                                                                                                                                                      79.9% Interest
                                                                                                                                                     Occupancy: 97.8%
311 Spencer Street,
    Melbourne
    50% Interest
  Occupancy: 100%                                                                                      Singapore                                               Marina Bay
                                                                                                                                                            Financial Centre

8 Exhibition Street,
    Melbourne
   50% Interest
                                    Australia
                                     20.5%                                                           75.9%                                                   33.3% Interest
                                                                                                                                                            Occupancy: 98.8%

 Occupancy: 98.2%

                                                                                                                                                      One Raffles Quay
       275 George Street,                                 David Malcolm                                                                                 33.3% Interest
           Brisbane                                       Justice Centre,                                                                              Occupancy: 98.4%
          50% Interest                                         Perth
        Occupancy: 96.5%                                    50% Interest
                                                          Occupancy: 100%

                           Note: Information as of 30 Sep 2020 and assuming the inclusion of Pinnacle Office Park in Sydney which was announced on
                           13 Sep 2020 and targeted for acquisition completion in 4Q 2020.                                                                              4
                           (1) As at 30 Jun 2020.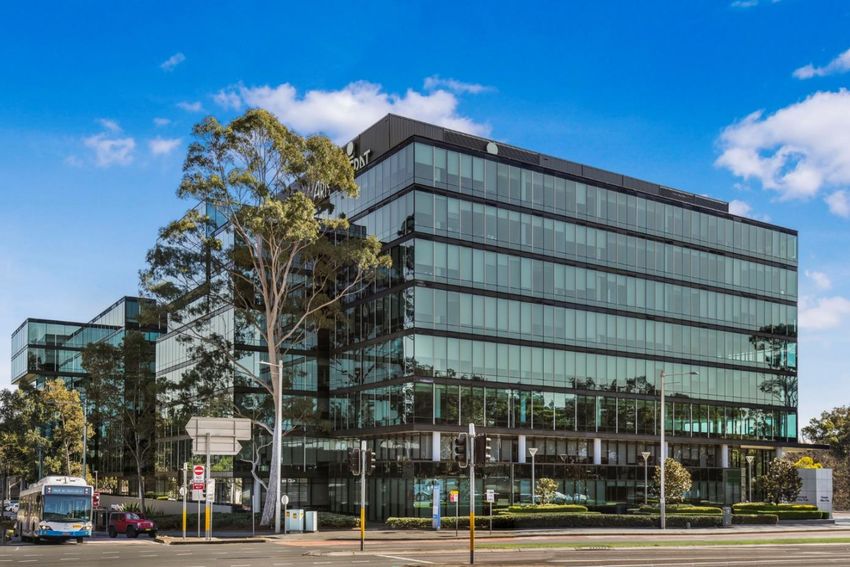
Active Portfolio Optimisation
▪     Portfolio optimisation to improve yield and create long-term value for Unitholders
▪     Holding quality assets across different markets enhances income diversification and long-term stability

                                                                                                               Jul 2020: Completed                Sep 2020: Acquiring
      Dec 2018: Divested                May 2019: Acquired                 Nov 2019: Divested
                                                                                                                311 Spencer Street                Pinnacle Office Park
    20% of Ocean Financial               T Tower in Seoul                Bugis Junction Towers
                                                                                                                   in Melbourne                        in Sydney
      Centre in Singapore                (Acquisition Price:                  in Singapore
                                                                                                                 (Carrying Amount:               (Agreed Property Value:
     (Sale Price: $537.3m)                  $292.0m(1))                   (Sale Price: $547.7m)
                                                                                                                     $372.5m(2))                       $303.3m(3))

(1) Based on an exchange rate of KRW 1,000 to $1.156 used for payment.
(2) Based on “as is” valuation as at 31 December 2019, as well as progress payments and capitalised costs from 1 January 2020 to 9 July 2020. Includes A$5.4 million of
    estimated final payment to be made after 9 July 2020. Based on an exchange rate of A$1 to S$0.9695 as at 9 July 2020.
(3) Based on an exchange rate of A$1.00 to S$0.9912 as at 9 September 2020.

                                                                                                                                                                          5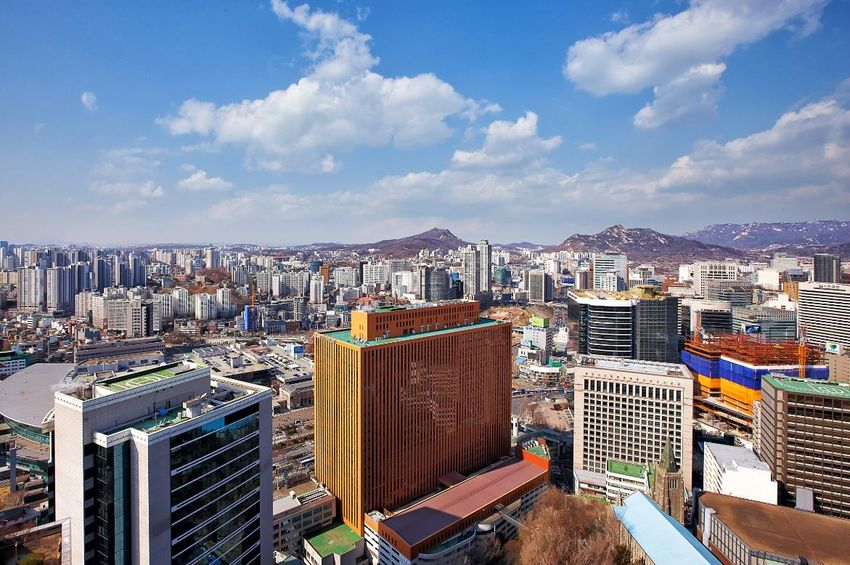
3Q 2020
Update

Marina Bay Financial Centre,
Singapore

                               6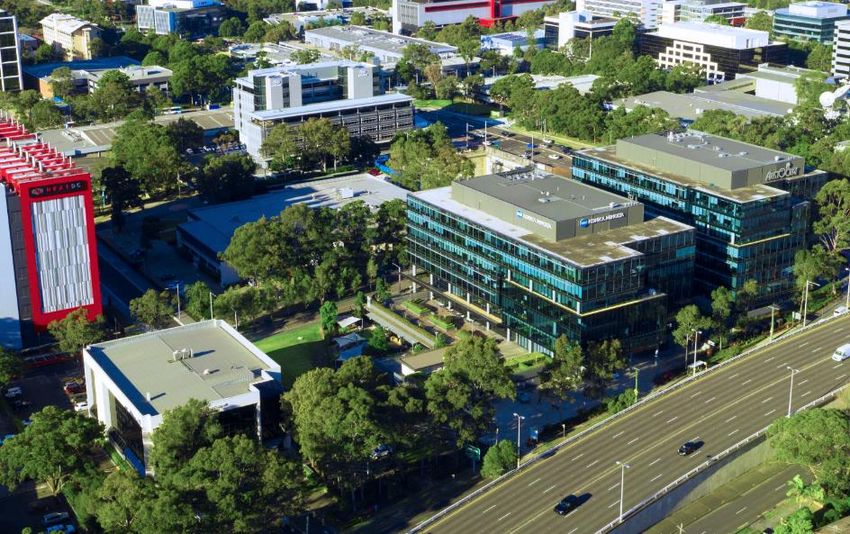
3Q 2020 Key Highlights

 $47.6m                                              98.3%
 3Q 2020 Distributable income                        High portfolio committed occupancy
 from operations(1)                                  as at 30 Sep 2020
 Up 12.0% q-o-q; up 4.6% y-o-y

 $142.4m                                             7.1 years
 9M 2020 Distributable income,                       Long portfolio weighted average lease expiry
 including $10.0m capital gains(1)                   as at 30 Sep 2020
 Up 0.2% y-o-y                                       Extended from 4.6 years to 7.1 years in 3Q 2020

 $300m                                               311 Spencer Street                                                Pinnacle Office Park
                                                                                                                        Optimising portfolio and expanding into
 3.15% perpetual securities issued                   Commencement of income contribution in                          Sydney Grade A metropolitan office space with
                                                     3Q 2020, after practical completion on 9 Jul 2020
                                                                                                                        acquisition announced on 13 Sep 2020

                 (1)   As Keppel REIT has adopted half-yearly distributions from 2H 2020 onwards, any distribution
                       of capital gains for 2H 2020 will be disclosed at the FY 2020 results announcement.
                                                                                                                                                            7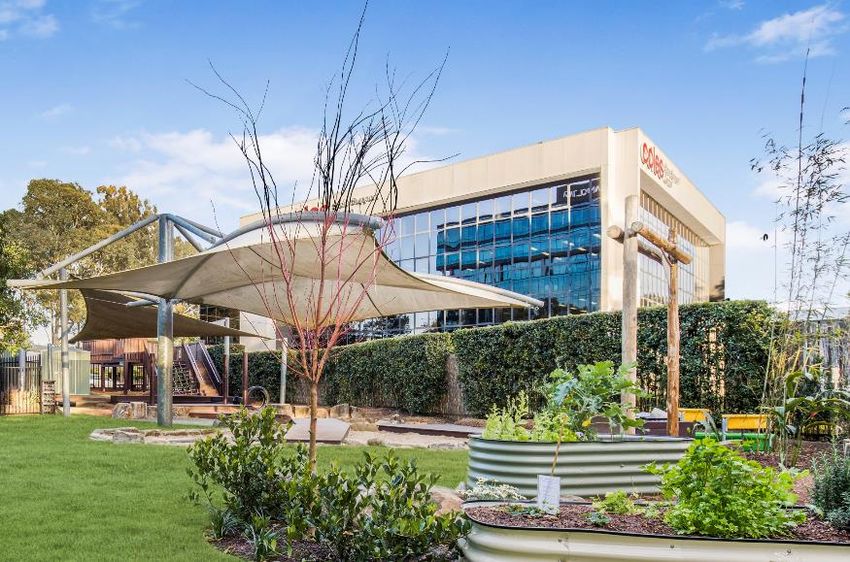
Financial Performance
Stable distributable income for 9M 2020 due mainly to:
▪ Contributions from T Tower and 311 Spencer Street, commencement of major Singapore leases, capital gains distribution,
  and lower borrowing costs
▪ Offset by the impact of the divestment of Bugis Junction Towers in Nov 2019, COVID‐19 tenant relief measures and
  the cessation of rental support

Distributable Income ($m)                                                                                  3Q 2020         3Q 2019               +/(-)      9M 2020         9M 2019               +/(-)
       Distributable Income
                                             Property Income(1)                                             $44.8m           $42.4m           +5.7%         $120.3m         $122.3m          (1.6%)
         from Operations
               +4.6%                                                                                        $35.6m           $33.2m           +7.2%          $94.6m           $95.5m         (0.9%)
      47.5               47.6                Net Property Income (NPI)
      2.0                                                                                                   ($4.3m)          ($4.2m)          +2.4%        ($12.7m)         ($12.5m)         +1.6%
                                              Less: Attributable to
                                                    Non-controlling Interests
                                             NPI Attributable to Unitholders                                $31.3m           $29.0m           +7.9%           $81.9m          $83.0m         (1.3%)
      45.5                47.6
                                             Share of Results of Associates(2)                              $23.1m           $21.3m           +8.5%           $63.6m          $60.4m         +5.3%
                                             Share of Results of Joint Ventures(3)                            $8.2m            $7.3m        +12.3%            $21.9m          $21.6m         +1.4%
    3Q 2019             3Q 2020
                                             Distributable Income from Operations                           $47.6m           $45.5m           +4.6%         $132.4m         $134.1m          (1.3%)
        From operations
        Capital gains distribution           Capital Gains Distribution                                       N.a.(4)          $2.0m            N.m.       $10.0m(4)           $8.0m        +25.0%

 N.m. = Not meaningful
 (1) Property income relates to income from directly-held properties including Ocean Financial Centre, 50% interest in 275 George Street, 50% interest in 8 Exhibition Street office building
      and 100% interest in the three adjacent retail units, T Tower after it was acquired on 27 May 2019, Bugis Junction Towers before it was divested on 29 Nov 2019 and 311 Spencer Street
      after it achieved practical completion on 9 Jul 2020.
 (2) Share of results of associates relates to Keppel REIT’s one-third interests in One Raffles Quay and Marina Bay Financial Centre.                                                         8
 (3) Share of results of joint ventures relates to Keppel REIT’s 50% interests in 8 Chifley Square and David Malcolm Justice Centre.
 (4) As Keppel REIT has adopted half-yearly distributions from 2H 2020 onwards, any distribution of capital gains for 2H 2020 will be disclosed at the FY 2020 results announcement.
Prudent Capital Management
▪ All-in interest rate reduced year-on-year to 2.39% p.a. from 2.82% p.a.
▪ Issued $300m(1) of 3.15% perpetual securities to refinance $150m of 4.98% perpetual securities(2) and increase financial flexibility
▪ Approximately $894m of undrawn credit facilities available, including $426m of committed facilities
▪ Capital gains available from past divestments to enhance stability of distributions

    Debt Maturity Profile (As at 30 Sep 2020)                                                                                            As at 30 Sep 2020

                                                       36%                                             Adjusted NAV per Unit(3)                                                             $1.34
                                                      $200m
                                                                       27%
                                                       $75m
                                                                                                       Interest Coverage Ratio(4)                                                               3.9x
                                       16%
                       11%                            $774m           $775m
                                                                                                       All-in Interest Rate                                                          2.39% p.a.
          9%           $50m
                                      $455m                                            1%
         $269m        $277m
                                                                                      $15m             Aggregate Leverage(5)                                                               35.0%
         2021          2022            2023            2024            2025            2026
         Bank loans                                 $50m 7-year MTN at 3.15%
                                                                                                       Weighted Average Term to Maturity                                               3.3 years
                                                    (Issued in Feb 2015)
         $75m 7-year MTN at 3.275%                 $200m 5-year convertible bonds at 1.9%              Borrowings on Fixed Rates                                                                80%
         (Issued in Apr 2017)                      (Issued in Apr 2019)

                      (1)   $150m was issued on 11 Sep 2020 while another $150m was issued on 7 Oct 2020.
                      (2)   $150m of 4.98% perpetual securities will be redeemed on 2 Nov 2020.
                      (3)   Excluded the distributable income for the period 1 Jul 2020 to 30 Sep 2020 to be paid in Feb 2021.
                      (4)   Computed as trailing 12 months EBITDA (excluding effects of any fair value changes of derivatives and investment properties, and foreign exchange translation),
                            over trailing 12 months interest expense and borrowing-related fees, as defined in the Code on Collective Investment Schemes revised by the MAS on 16 Apr 2020.     9
                      (5)   Assuming the acquisition of Pinnacle Office Park is completed as at 30 Sep 2020 and taking into account the effects of the issuance of $150m perpetual securities
                            on 7 Oct 2020 and the redemption of $150m perpetual securities on 2 Nov 2020, the aggregate leverage would have been 36.9%.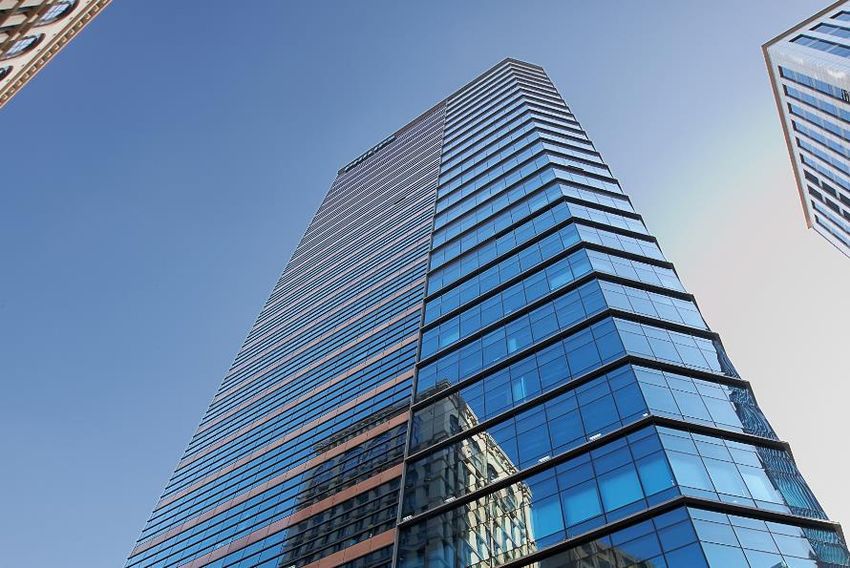
DPU-Accretive Acquisition of Pinnacle Office Park, Sydney
▪   Acquiring a 100% interest in Pinnacle Office Park, a freehold Grade A commercial property comprising
    three office buildings near the Macquarie Park Metro Station

▪   Acquisition at a 5.25% initial NPI yield is part of ongoing portfolio optimisation to improve income resilience
    and portfolio yield

                                Transaction Overview

     Agreed Property Value(1)           A$306.0m ($303.3m)(2)

                                        100% funded by AUD-denominated loan
     Funding Structure
                                        for natural hedge

     Initial NPI Yield                  5.25%(3)

     DPU Accretion                      +4.5%(4)

     Expected Completion                4Q 2020

                (1) Includes A$2.1m of rental guarantee until the later of 31 Dec 2021 and 12 (or 6) months after the date of completion, depending on the relevant
                    vacant premises.
                (2) Based on an exchange rate of A$1.00 = S$0.9912 as at 9 Sep 2020. Including estimated transaction costs, the acquisition consideration would
                    be A$329.0m ($326.1m).
                (3) Based on the estimated NPI for a year from completion of the acquisition, including rental guarantee by the vendor for the same period.           10
                (4) On a pro forma basis for FY 2019 as if the acquisition was completed on 1 Jan 2019. DPU accretion would be +3.2% had the acquisition been
                    funded by AUD-denominated loan and $150m of perpetual securities issued on 11 Sep 2020.
Investment Merits Click to view property video
1. Portfolio optimisation to improve income resilience and portfolio yield
2. DPU-accretive acquisition that will enhance the REIT’s distributions
3. Opportunity to gain exposure to a key Australian metropolitan office market
4. Expansion into Grade A metropolitan office space for tenants seeking cost-effective or hub-and-spoke
business models
5. Potential partial re-development opportunity in the medium term
11Managing the COVID-19 Situation
▪ Keppel REIT’s quality office portfolio and high-quality tenant profile continue to provide income stability
and resilience
▪ Portfolio committed occupancy remained high at 98.3%(1). Portfolio weighted average lease expiry was
extended to 7.1 years(1); Top 10 tenants’ WALE was 12.3 years(1)
▪ Safety measures in place to facilitate the return of tenants to the workplace
▪ To support tenants, and in line with government measures, measures were implemented to alleviate
tenants’ cashflow and cost pressures
(3)
(2)
Tenant relief measures
Rental collection Rental deferrals
Approx. $13.8m
97% $1.7m including estimated $10.0m of
in 3Q 2020 as at 30 Sep 2020 government property tax rebates
and cash grant
(1) Based on portfolio NLA as at 30 Sep 2020.
(2) Rental deferrals are excluded from rental collection in 3Q 2020. 12
(3) Estimates as at 30 Sep 2020. Final tenant eligibility will be dependent on the assessment by the authorities.Established and Diversified Tenant Base
▪ Keppel REIT has a diversified tenant ▪ Top 10 tenants take up 43.3% of NLA
base of 342(1) tenants, many of which are and contribute 38.0% of gross rent
established blue-chip corporations
Top 10 Tenants
Tenant Business Sector
State of Victoria 11.3%
Banking, insurance and financial services 36.2%
DBS 6.0%
Government agency 17.6%
Government of
Technology, media and telecommunications 12.0% GOWA
Western Australia 4.8%
Legal 7.9%
Standard Chartered 3.9%
Energy, natural resources, shipping and marine 7.3%
Real estate and property services 5.7% Ernst & Young 3.7% 311 Spencer Street
Accounting and consultancy services 5.3% 8 Exhibition Street
BNP Paribas 3.7%
Services 3.5% Marina Bay
Financial Centre
Manufacturing and distribution 2.1% Telstra 3.1%
David Malcolm
Retail and food & beverage 1.6% Justice Centre
UBS 2.3%
Hospitality and leisure 0.1% One Raffles Quay
Others 0.7% Drew & Napier 2.3% Ocean Financial Centre
275 George Street
Total 100% ANZ 2.2%
Note: All data as at 30 Sep 2020 and based on portfolio committed NLA.
(1) Tenants with multiple leases were accounted as one tenant. 139M 2020 Leasing Update
Leases Committed Leases Committed New leasing demand and expansions from:
by Geography(2) by Type(2)
Total Leases Committed Real estate and property services 38.2%
Australia, Renewal,
~955,600 sf Singapore,
24.3% 54.1% Technology, media and telecommunications 23.7%
(Attributable ~413,100 sf) 62.3% Banking, insurance and financial services 21.1%
South
Korea, Energy, natural resources, shipping and marine 11.5%
Retention Rate 13.4%
New,
81%(1) 16.7% Accounting and consultancy services 3.5%
Rent review,
29.2%
Retail and F&B 2.0%
Lease Expiries and Rent Reviews(2) ▪ Average signing rent for Singapore
Expiring Leases office leases concluded in 9M 2020
Rent Review Leases 42.0%
was $11.03(3) psf pm
▪ Average expiring rents(4) of
14.6% 17.6% 16.5%
11.7% 11.5% Singapore office leases (psf pm):
5.9%
0.9% 0.0% 0.0% 0.2% 0.3% $9.72 in 2021, $10.25 in 2022
2020 2021 2022 2023 2024 2025 and beyond and $11.00 in 2023
(1) For 9M 2020. Retention rate for 3Q 2020 was 94%.
(2) Based on committed attributable area. 14
(3) Based on a weighted average calculation. Simple average signing rent was $11.81 psf pm.
(4) Weighted average based on attributable NLA of office lease expiries and reviews in Singapore.Market
Review
8 Chifley Square,
Sydney
15Singapore Office Market
▪ Average Grade A office rents registered a decrease to $10.70 psf pm in 3Q 2020 while average
occupancy in core CBD decreased to 93.9%
Grade A Rent and Core CBD Occupancy Demand and Supply
2.1 1.9 1.7
1.3
94.8% 95.8% 93.8% 94.8% 95.8% 95.4% 94.4% 93.9% 0.8 0.8 1.0 0.9 0.9
$15 100% 0.7 0.7
0.4 0.4 0.3
0.02
$12 $11.55 $11.50 $11.15 80%
$10.40 $10.80 $10.70 2015 2016 2017 2018 2019 2020 2021 2022 2023 2024
$9.10 $9.40 (1) (1) (2)
Net Supply Net Demand Forecast Supply
$9 60%
Key Upcoming Supply in CBD(2) sf
$6 40%
Afro-Asia i-Mark 140,000
2021 CapitaSpring 635,000
$3 20% Hub Synergy Point Redevelopment 131,200
$0 0% 2022 Guoco Midtown 650,000
Dec Dec Dec Dec Dec Mar Jun Sep
2023 Central Boulevard Towers 1,258,000
2015 2016 2017 2018 2019 2020 2020 2020
Average Grade A Rent ($ psf pm) Keppel Towers Redevelopment 522,800
2024
Core CBD Average Occupancy (%) Shaw Towers Redevelopment 407,000
(1) Based on URA data on historical net demand and supply of office space in Downtown Core
Source: CBRE, 3Q 2020. and Rest of Central Area. Supply is calculated as net change of stock over the year and
may include office stock removed from market due to demolitions or change of use.
(2) Based on CBRE data on CBD Core and CBD Fringe.
16Australia Office Market
94.9% 96.0% 95.2% 94.5% 93.0% 94.0% 97.0% 98.2% 98.2% 92.5%
91.8% 91.3% 89.7% 100% 90.1% 92.1% 87.9% 100%
1,200 1,045 1,200 90%
1,032 1,058 1,028 80% 80%
964 946
Sydney CBD 900 799 60%
Melbourne CBD 900
70%
60%
679
503 538 573 575 559 553 50%
600 40% 600 448 40%
406
30%
Prime Grade occupancy
300 20% Prime Grade occupancy
300 20%
10%
was lower at 89.7% 0 0% was lower at 87.9% 0 0%
4Q15 4Q16 4Q17 4Q18 4Q19 1Q20 2Q20 3Q20 4Q15 4Q16 4Q17 4Q18 4Q19 1Q20 2Q20 3Q20
Prime Gross Effective Rent (AUD psm/year) Prime Gross Effective Rent (AUD psm/year)
Prime Grade Occupancy (%) Prime Grade Occupancy (%)
94.3% 94.3% 93.7% 93.6% 94.7% 92.2% 94.8% 89.6% 92.8% 91.5% 89.2% 89.0% 88.2% 100%
100% 86.8% 86.0%
89.3% 1,200
1,200 80%
80%
Macquarie Park 900 60%
Brisbane CBD 900 60%
600 409 418 417 40%
600 40% 397 389 386 396 411
344 367 391 392 386 377
305 321 300 20%
Prime Grade occupancy
300 20% Prime Grade occupancy
0 0%
was lower at 89.3% 0 0% was lower at 88.2% 4Q15 4Q16 4Q17 4Q18 4Q19 1Q20 2Q20 3Q20
4Q15 4Q16 4Q17 4Q18 4Q19 1Q20 2Q20 3Q20
Prime Gross Effective Rent (AUD psm/year)
Prime Gross Effective Rent (AUD psm/year)
Prime Grade Occupancy (%)
Prime Grade Occupancy (%)
84.0% 86.5% 85.6% 84.7% 84.1% 100%
77.7% 81.4%
1,200 76.5%
80%
Perth CBD 900 60%
600 491 431 435 447 453 456 456 444 40%
Prime Grade occupancy
300 20%
was lower at 84.1% 0 0%
4Q15 4Q16 4Q17 4Q18 4Q19 1Q20 2Q20 3Q20
Prime Gross Effective Rent (AUD psm/year)
Prime Grade Occupancy (%)
Source: JLL Research, 3Q 2020. 17Seoul Office Market
▪ CBD Grade A occupancy remained stable at 85.1% in 3Q 2020
CBD Grade A Rent and Occupancy
200,000 90.9% 91.3% 100%
87.7% 85.3% 86.9% 85.1% 85.1%
83.1%
160,000 80%
120,000 60%
95,765 95,175 91,851 92,331 91,662 93,578 95,066 97,164
80,000 40%
40,000 20%
0 0%
4Q15 4Q16 4Q17 4Q18 4Q19 1Q20 2Q20 3Q20
CBD Grade A Net Effective Rent (KRW per py pm)
CBD Grade A Occupancy (%)
Source: JLL Research, 3Q 2020. 18Operating in the New Environment
▪ Physical offices will remain a necessity, although the form and functions of the office will evolve
Varying ▪ Many firms will likely incorporate work-from-home Keppel REIT will continue to optimise the
considerations in their future office planning. However, portfolio and calibrate its leasing strategy to
adoption of many functions will still require office spaces for social
telecommuting interaction, client engagement and collaboration. meet potential shifts in occupier demand
▪ Space required for each employee may need to increase
Reversal of to incorporate social distancing within office layout,
densification reversing the densification trend in the last two decades. Robust Best-in-class,
portfolio in safe and
quality well- technologically
networked -sound work
Shifts at ▪ Impact on office demand will likely be at a measured locations environments
pace as tenants re-assess their space requirements with
measured consideration of their existing leases, which are typically
pace of three to five years duration.
Proactive tenant
engagement to find
Potential ▪ Ongoing developments may be delayed by social solutions that best
distancing restrictions at construction sites. Future support occupier
deferral of developments may also be deferred or changed to non- needs
supply office use as developers re-assess their projects.
19Committed to Delivering Stable Income & Sustainable Returns
Portfolio Optimisation
• Portfolio optimisation to improve yield, while maintaining exposure to
Singapore CBD Portfolio
• Hold quality assets across different markets for improved income stability Optimisation
and to provide more long-term growth opportunities
Asset Performance Asset
Performance
• Drive individual asset performance with proactive leasing and
cost management strategies
• Implement initiatives to future proof assets and enhance sustainability
Capital
Efficiency
Capital Efficiency
• Optimise capital structure to reduce borrowing costs and improve returns
• Manage debt maturities and hedging profiles to reduce risk
20Additional
Information
One Raffles Quay,
Singapore
21Growth Since Listing in 2006
Expanded footprint to Australia: Expanded footprint
77 King Street (100%), Sydney, and to South Korea:
275 George Street (50%), Brisbane T Tower (99.4%), Seoul
Listed on SGX
>$600m AUM
4 assets in Acquired Acquired Acquired Acquired Acquiring
Singapore - 8 Chifley Square (50%), - David Malcolm Justice three retail units at 311 Spencer Street Pinnacle Office
Sydney Centre (50%), Perth 8 Exhibition Street, development (50%), Park (100%),
- Ocean Financial Centre - 8 Exhibition Street (50%), Melbourne Melbourne Sydney
(87.5%), Singapore Melbourne
2018
2019 2020
2016 2017
2013
2014
2015
$8.4b(1) AUM
2006 2011
2012 10 assets in Singapore,
2010
2007
2009 Australia & South Korea
Acquired Increased Asset swap: Increased stake Divested Divested Divested Divested
One Raffles stake in Keppel Towers and in Ocean Financial Prudential Tower, 77 King Street, 20% minority stake Bugis Junction
Quay (33.3%), Prudential GE Tower for Centre (to 99.9%), Singapore Sydney in Ocean Financial Towers, Singapore
Singapore Towers, MBFC Towers 1 & 2 Singapore Centre (to 79.9%),
Acquired
Singapore and MBLM (33.3%), Singapore
MBFC Tower 3 (33.3%),
Singapore
Singapore
1) Based on assets under management as at 30 Sep 2020, and assuming the inclusion of Pinnacle Office Park in Sydney which was
22
announced on 13 Sep 2020 and targeted for acquisition completion in 4Q 2020.Pinnacle Office Park: Well-Located Freehold Grade A Office
Near Macquarie Park Metro
Station Short walk to bus interchange On-site end-of-trip facilities On-site café
Building Completion 2008 (2 and 4 Drake Avenue), 2011(1) (6 Giffnock Avenue)
Attributable NLA 35,132 sm (378,165 sf)
Occupancy 96.3% committed(2), with rental guarantee(3) for relevant vacant premises
WALE 4.8 years(2)
No. of Tenants 14(2)
Green Awards 4-Star NABERS Energy Rating
▪ Close to the Macquarie Park Metro Station and major bus interchange
Accessibility
▪ Well served by public transportation and major arterial roads providing direct links to the CBD
▪ On-site amenities include a childcare centre, a gymnasium, end-of-trip facilities and a café
Amenities
▪ Close to retail, food and entertainment options at Macquarie Centre, Sydney’s largest suburban shopping centre
(1) Last refurbishment.
(2) As at 30 Jun 2020. 23
(3) A$2.1 million of rental guarantee until the later of 31 December 2021 and 12 (or 6) months after the date of completion, depending on the
relevant vacant premises.Pinnacle Office Park: Opportunity to Gain Exposure to a Key
Australian Metropolitan Office Market
A vibrant metropolitan office market benefitting from
infrastructure investments:
▪ Macquarie Park is the second largest office market in
New South Wales(1) and has benefitted from improvements
in transport infrastructure
▪ The new Northwest metro line which began operations
in 2019 has enhanced connectivity of Macquarie Park
to Sydney’s northwest growth corridor
▪ The expected completion of the City and Southwest
metro rail in 2024 will also improve the commuting
time between Macquarie Park and the CBD to just
20 minutes
(1) Property Council of Australia, Office Market Report Jul 2020 24Pinnacle Office Park: Expansion into Grade A Metropolitan Office Space
for Tenants Seeking Cost-Effective or Hub-and-Spoke Business Models
▪ Acquisition of Pinnacle Office Park will enable Keppel REIT to
provide quality metropolitan office space, complementing its
prime CBD offering
▪ More tenants are likely to seek cost-effective solutions or
adopt hub-and-spoke business models with secondary offices
in locations like Macquarie Park becoming more common
▪ Macquarie Park is expected to benefit from its location, local
amenity, connectivity as well as its rental levels in comparison
(1)
to other suburban markets
(1) Urbis, 21 Aug 2020 25Pinnacle Office Park: Potential Partial Re-Development Opportunity
▪ One of the three free-standing buildings,
6 Giffnock Avenue, has the potential to be
re-developed into a new office building with 2 Drake Avenue
(8 floors)
higher NLA in future*, subject to approval by 4 Drake Avenue
(7 floors)
local authorities
NLA Before After
6 Giffnock Avenue
2 Drake Avenue 15,524 sm (4 floors)
4 Drake Avenue 15,668 sm
6 Giffnock Avenue 3,940 sm Up to 17,000 sm
Total NLA 35,132 sm Up to 48,192 sm
NLA Increase Approx. +37%
* Under Ryde Local Environmental Plan 2014 26Portfolio Information: Singapore
As at Marina Bay
Ocean Financial Centre One Raffles Quay
30 Sep 2020 Financial Centre(4)
Attributable NLA 700,504 sf 1,024,238 sf 441,475 sf
Ownership 79.9% 33.3% 33.3%
BNP Paribas, DBS Bank, Deutsche Bank,
Principal tenants(1) ANZ, Standard Chartered Bank, Ernst & Young,
Drew & Napier Barclays UBS
99 years expiring
99 years expiring 99 years expiring
Tenure 10 Oct 2104(5) and
13 Dec 2110 12 Jun 2100
7 Mar 2106(6)
Purchase Price S$1,426.8m(5)
S$1,838.6m(3) S$941.5m
(on acquisition) S$1,248.0m(6)
S$1,695.3m(5)
Valuation(2) S$2,099.8m S$1,254.3m
S$1,297.0m(6)
3.63%(7); 4.50%(8);
Capitalisation rates 3.50% 3.63%
3.60%(6)
1) On committed gross rent basis. 5) Refers to MBFC Towers 1 and 2 and MBLM.
2) Valuation as at 31 Dec 2019 based on Keppel REIT’s interest in the respective properties. 6) Refers to MBFC Tower 3.
3) Based on Keppel REIT’s 79.9% of the historical purchase price. 7) Refers to MBFC Towers 1 and 2.
4) Comprises Marina Bay Financial Centre (MBFC) Towers 1, 2 and 3 and Marina Bay Link Mall (MBLM). 8) Refers to MBLM.
27Portfolio Information: Australia & South Korea
Pinnacle Office
As at 8 Exhibition David Malcolm
8 Chifley Square, 311 Spencer 275 George Park, Sydney T Tower,
30 Sep 2020 Street(3), Justice Centre,
Sydney Street, Melbourne Street, Brisbane (Pending Seoul
Melbourne Perth
completion)
Attributable
104,055 sf 244,659 sf 364,180 sf 224,537 sf 167,784 sf 378,165 sf 226,949 sf
NLA
Ownership 50.0% 50.0% 50.0% 50.0% 50.0% 100.0% 99.4%
Telstra, Minister for Aristocrat
Corrs Chambers Ernst & Young, Hankook
Minister for Queensland Gas Works - Technologies,
Principal Westgarth, Amazon, Minister Corporation, SK
Company, Government of
tenants(1) Quantium, for Finance - Finance - State of Konica Minolta,
Communications,
Victoria The State of Western Coles
QBE Insurance State of Victoria Philips Korea
Queensland(8) Australia Supermarkets
99 years expiring 99 years expiring
Tenure Freehold Freehold Freehold Freehold Freehold
5 Apr 2105 30 Aug 2114
Purchase Price A$165.0m A$168.8m A$347.8m A$166.0m A$165.0m A$306.0m KRW252.6b
(on acquisition) S$197.8m S$201.3m(3) S$362.4m(6) S$209.4m S$208.1m S$303.3m(9) S$292.0m(11)
A$240.0m A$265.3m A$384.3m A$250.0m A$232.5m A$306.0m KRW259.0b
Valuation(2)
S$222.2m S$245.6m(3) S$372.5m(7) S$231.4m S$215.2m S$303.3m(9,10) S$299.9m
Capitalisation
4.75% 5.00%(4); 4.50%(5) 4.50% 5.00% 5.38% 5.25% 4.50%
rates
1) On committed gross rent basis. 6) Based on the aggregate consideration paid-to-date and to be paid, including development costs of the building,
2) Valuation as at 31 Dec 2019 based on Keppel REIT’s interest in the respective properties and at the exchange rate of A$1=S$1.042 as disclosed in the announcement dated 29 Jun 2017.
on the exchange rates of A$1 = S$0.9257 and KRW 1,000 = S$1.158. 7) Carrying amount based on “as is” valuation as at 31 Dec 2019, as well as progress payments and
3) Keppel REIT owns a 50% interest in the 8 Exhibition Street office building and a 100% interest in capitalised costs from 1 Jan 2020 to 9 Jul 2020. Includes A$5.4m of estimated final payment to be made
the three adjacent retail units. after 9 Jul 2020. Based on the exchange rate of A$1 = S$0.9695 as at 9 Jul 2020.
4) Refers to Keppel REIT’s 50% interest in the office building. 8) Refers to the Department of Housing and Public Works – The State of Queensland.
5) Refers to Keppel REIT’s 100% interest in the three adjacent retail units. 9) Based on an exchange rate of A$1 = S$0.9912 as at 9 Sep 2020.
10) Valuation as at 31 Aug 2020.
11) Based on Keppel REIT’s interest in T Tower and an exchange rate of KRW 1,000 = S$1.156 28
used for payment.Keppel REIT Structure
Keppel Capital Keppel Land
Institutional and
The REIT Manager can leverage
The REIT Manager can leverage Public Investors
the Sponsor‘s expertise and
the scale and resources of a larger 50.9%
asset management platform
5.5% track record in this industry
43.6%
100%
Management Acting on behalf of
services Unitholders
REIT Manager Trustee
Trustee’s
Management fees Keppel REIT fees
Keppel REIT RBC Investor Services Trust
Management Limited Singapore Limited
Ownership of Income
assets contribution
Property
management
services
Property Managers Properties
Property
management fees
Note: As of 30 Jun 2020. 29Thank You
For more information, please visit:
www.keppelreit.com
Connect with us on:
T Tower,
Seoul
30You can also read