Webinar with Syfe 13 August 2020 - Keppel Corporation

Page created by Angel Johnston
 
CONTINUE READING
Webinar with Syfe 13 August 2020 - Keppel Corporation
Webinar with Syfe
13 August 2020
Webinar with Syfe 13 August 2020 - Keppel Corporation
Sustainable Pan-Asian Portfolio with Income Resilience

               98.6%
      Strong committed occupancy with
long weighted average lease expiry of 4.6 years
                                                                                  Marina Bay                            One Raffles   Ocean Financial
                                                                               Financial Centre                           Quay           Centre

                             (1)
               5.1%
        Annualised distribution yield of
        Grade A commercial portfolio

    Green Awards
    BCA Green Mark Platinum award for
   all Singapore assets; 5 Stars NABERS
   Energy rating for most Australian assets

                    Note: Data as at 30 June 2020.
                    (1) Based on an annualised DPU and the market closing price of $1.10 per Unit as at 30 June 2020.
                                                                                                                                                    2
                                                                                                                                                        2
Webinar with Syfe 13 August 2020 - Keppel Corporation
Portfolio Anchored by Singapore CBD Assets
                $7.9 billion portfolio in key business districts of Singapore, Australia and South Korea
                                enhances income diversification and long-term stability
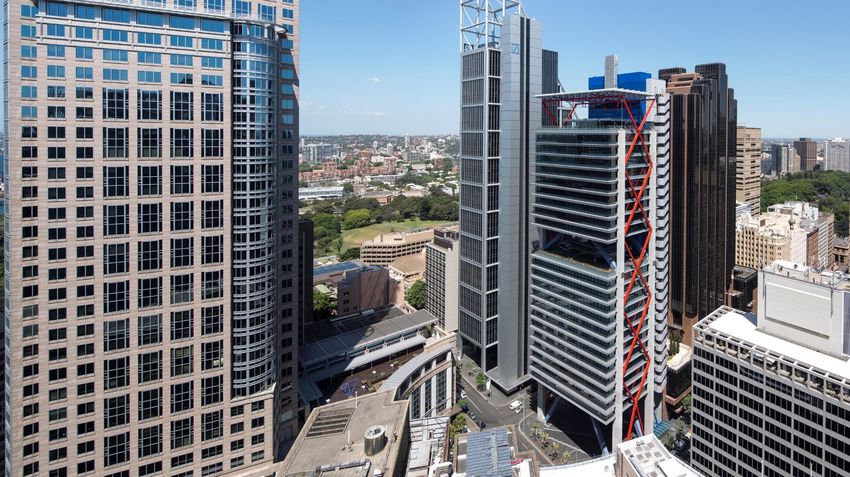
                                      311 Spencer Street,                                        T Tower, Seoul
                                           Melbourne                                             99.4% Interest
                                          50% Interest                           South Korea
                                  (Achieved practical completion                                                  Ocean Financial
                                                                                     3.7%
                                         on 9 July 2020)                                                              Centre
        8 Exhibition Street,                                                                                       79.9% Interest
            Melbourne
           50% Interest

275 George Street,
                                                                                               Singapore                    Marina Bay
                                                                                                                         Financial Centre
    Brisbane
   50% Interest
                                    Australia
                                     16.3%                                                     80.0%                      33.3% Interest

   David Malcolm
   Justice Centre,
                                                                                                                   One Raffles Quay
        Perth
                                               8 Chifley Square,                                                    33.3% Interest
    50% Interest
                                                    Sydney
                                                  50% Interest

                               Note: Based on assets under management as at 30 June 2020.                                           3
Webinar with Syfe 13 August 2020 - Keppel Corporation
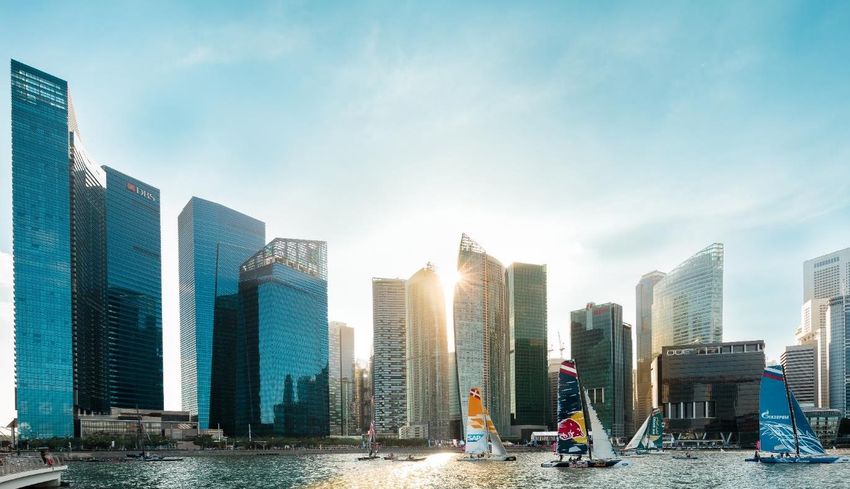
Resilient and Diversified Tenant Base
 ▪ Keppel REIT has a diversified tenant                                        ▪ Top 10 tenants take up 37.9% of NLA
   base of 340(1) tenants, many of which are                                     and contribute 34.9% of gross rent
   established blue-chip corporations
                                                                                                     Top 10 Tenants
      Tenant Business Sector
                                                                                             DBS                                            6.6%
         Banking, insurance and financial services            40.3%                Government of
                                                                                          GOWA
                                                                                 Western Australia                                  5.3%
         Technology, media and telecommunications             13.3%
         Legal                                                 8.8%            Standard Chartered                            4.4%
         Energy, natural resources, shipping and marine        8.0%                Ernst & Young                         4.2%
         Government agency                                     7.9%
         Real estate and property services                     6.4%                    BNP Paribas                       4.1%
         Accounting and consultancy services                   5.9%                                                                        Marina Bay
                                                                                           Telstra                    3.4%                 Financial Centre
         Services                                              4.4%
                                                                                                                                           David Malcolm
         Manufacturing and distribution                        2.3%                          UBS                2.6%                       Justice Centre
         Retail and food & beverage                            1.8%
                                                                                   Drew & Napier               2.5%                        One Raffles Quay
         Hospitality and leisure                               0.1%                                                                        8 Exhibition Street
         Others                                                0.8%                           ANZ              2.5%                        Ocean Financial Centre
         Total                                                 100%                                                                        275 George Street
                                                                                         Deutsche             2.3%

             Note: All data as at 30 June 2020 and based on portfolio committed NLA.                                                                             4
             (1) Tenants with multiple leases were accounted as one tenant.
Webinar with Syfe 13 August 2020 - Keppel Corporation
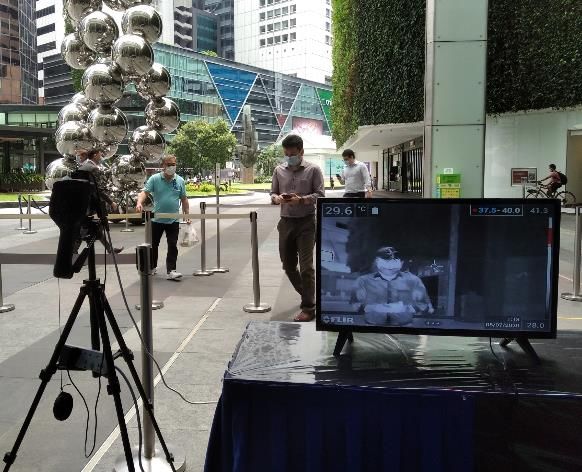
2Q 2020 Key Highlights
                                                                                              AUM by Geography
  ▪     2Q 2020 Distribution per Unit (DPU) was 1.40 cents, an increase of 0.7%
                                                                                              (As at 30 Jun 2020)
        compared to 2Q 2019 and stable compared to 1Q 2020

  ▪     Implemented tenant support measures during the COVID-19 outbreak                               3.7%
                                                                                                   16.3%            Singapore
                                                                                                                    Australia
  ▪     Borrowing cost was lower with                                                                               South Korea
        all-in interest rate of 2.48% p.a.,                                                              80.0%

        down from 2.86% year-on-year

  ▪     Building occupancy remains high
        with a committed occupancy of                                                         Committed NLA by Asset Type
        98.6% and a long portfolio                                                            (As at 30 Jun 2020)
        weighted average lease expiry of
        4.6 years                                                                                     1.8%

                                                                                                                     Office
  ▪     Achieved practical completion of
                                                                                                                     Retail
        311 Spencer Street development
        in Melbourne on 9 July 2020                                    311 Spencer Street             98.2%
                                                                      (Artist’s Impression)

                                                                                                                         5
(1) Includes capital gains distribution of $5.0 million for 2Q 2020
Webinar with Syfe 13 August 2020 - Keppel Corporation
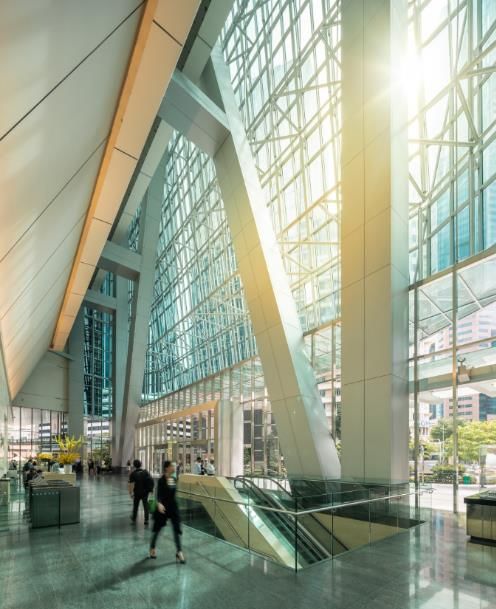
Navigating the COVID-19 Situation
Developments on the ground                                                                                                                               Across Keppel REIT’s portfolio:

             ▪   Gradual return of tenants to offices after the two-month “Circuit Breaker”; site visits                                                                 SMEs
                                                                                                                                                                                    (2)
                                                                                                                                                                                          in portfolio
                 by prospective tenants can resume with adherence to social distancing requirements
             ▪   On 5 June 2020, the COVID-19 (Temporary Measures) (Amendment) Bill was
                                                                                                                                                                         5.6%
                                                                                                                                                                         of portfolio NLA
                 passed in Parliament and provides for co-sharing of rental waiver to eligible small
                 and medium enterprises (SMEs) by the government and the landlord:
                                                                                                                                                                                                         (2)
Singapore          o    Eligible retail SMEs, gyms and clinics: two-month rental waiver by landlord,
                                                                                                                                                                         Tenant relief measures
                        in addition to the pass-through of the 100% property tax rebate and cash grant                                                                   Approx. $12.5m
                        from the government which amounts to approximately two months of rental                                                                          including estimated $9.2m of
                   o    Eligible office SMEs: one-month rental waiver by landlord, on top of the                                                                         government property tax rebates
                                                                                                                                                                         and cash grant
                        pass-through of the 30% property tax rebate and cash grant from the
                        government which amounts to approximately one month of rental
                                                                                                                                                                         Rental collection
             ▪   Facilitating return of tenants to offices as restrictions are gradually eased in most
                 states
                                                                                                                                                                         98%
                                                                                                                                                                         in 2Q 2020
 Australia   ▪   “Mandatory Code of Conduct” issued by the National Cabinet, focusing on SMEs
                 with turnover below $50m, which seeks to protect eligible tenants from termination of                                                                   Rental deferrals
                 leases and entitles eligible tenants(1) to rent waivers and deferrals
                                                                                                                                                                         $1.6m
  South      ▪   Most tenants have been operating from T Tower, with adherence to social distancing                                                                      as at 30 Jun 2020
  Korea          advisory

                    (1) Only applicable to SMEs with turnover of $50m or less, and who are eligible for the federal Jobkeeper program. One of the main criteria for a business to be eligible
                        for the program is a projected reduction of revenue by more than 30% due to COVID-19. Rent reductions may consist of a combination of waivers and deferrals where           6
                        rental waiver must be no less than 50% of the total rent reduction.                                                               6
                    (2) Estimates as at 30 June 2020. Final tenant eligibility will be dependent on the assessment by the authorities.
Webinar with Syfe 13 August 2020 - Keppel Corporation
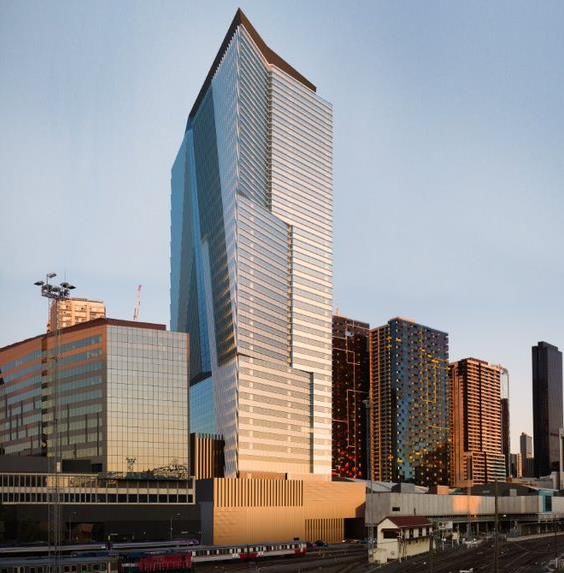
Facilitating Return to Workplaces
Examples of measures in place:

▪   Temperature scanning and              ▪       Regular purging of air
    contact tracing measures                      from building
▪   Interlinked building card access      ▪       Maintaining good air
    and lift destination control                  quality with advanced
    systems facilitate contactless                air filtration systems
    entry and social distancing
                                          High
                                                                                                                              Safe distancing reminders on
                                       indoor air                                    Thermal scanning at entrances
                                                                                                                                 patrolling RoboGuard
Safe access                              quality

                   Increased                           Technologically
                  disinfection                             -sound
                                                        environment
▪   Increased cleaning frequency of           ▪    Equipped with appropriate
    high contact areas                             broadband network
                                                   infrastructure to support         Hand sanitisers at        Safe distancing           Disinfection of high
▪   Hand sanitisers at common areas                                                     lift lobbies         reminders at gantries          contact areas
                                                   internet bandwidth for tenants’
                                                   video conferencing and
                                                   meeting facilities
                                                                                                                                                      7
Webinar with Syfe 13 August 2020 - Keppel Corporation
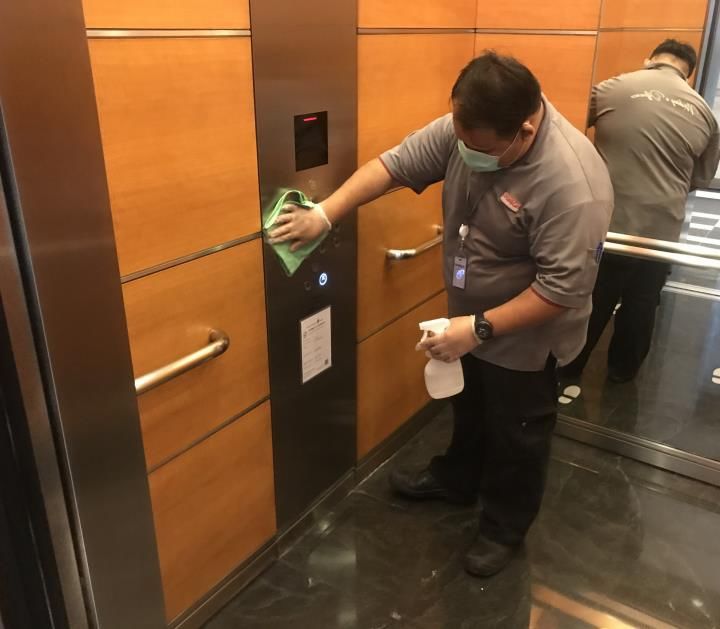
Office Remains a Necessity
▪ Physical offices will remain a necessity, although the form and functions of the office will evolve

                                                                                    Keppel REIT will continue to optimise the
Varying adoption     ▪ While firms will likely incorporate work-from-home,
                       many functions will still require office space for social   portfolio and calibrate its leasing strategy to
of telecommuting       interaction, client engagement and collaboration.            meet potential shifts in occupier demand

  Reversal of        ▪ Space required for each employee may need to
                       increase to incorporate social distancing, reversing the
  densification        densification trend in the last two decades.
                                                                                              Robust          Best-in-class,
                                                                                            portfolio in         safe and
                                                                                           quality well-     technologically
  Shifts at          ▪ Impact on office demand will likely be at a measured                 networked          -sound work
                       pace as existing leases are typically three to five years             locations        environments
measured pace          in duration.

                     ▪ Ongoing developments may be delayed by social
Potential deferral     distancing restrictions at construction sites. Future
                                                                                                   Proactive tenant
                       developments may also be deferred or changed to                            engagement to find
    of supply                                                                                     solutions that best
                       non-office use.
                                                                                                   support occupier
                                                                                                         needs

                                                                                                                               8
Webinar with Syfe 13 August 2020 - Keppel Corporation
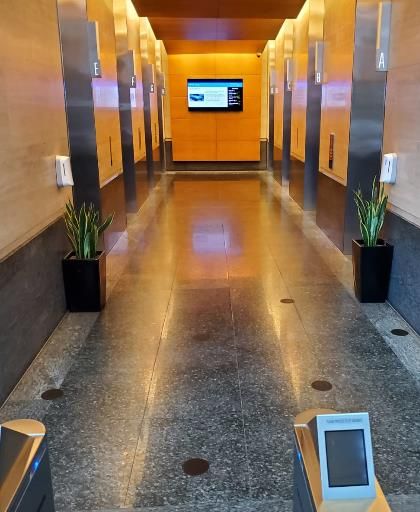
Singapore Office Market
      ▪ Average Grade A office rents registered a decrease to $11.15 psf pm in 2Q 2020 while average
        occupancy in core CBD decreased to 94.4%
        Grade A Rent and Core CBD Occupancy                                      Demand and Supply
                                                                                              2.1          1.9                                               1.9
                                                                                                                        1.7
        94.8%     95.8%             94.8%     95.8%     95.4%    94.4%                                                                     1.1
$15                        93.8%                                          100%                                0.8 0.8                0.7             0.8
                                                                                        0.4      0.4                                                                             0.5
                                                                                                                               0.3
                                                                                 0.02                                                                                     0.0
$12                                           $11.55    $11.50   $11.15   80%
        $10.40                      $10.80                                         2015        2016        2017    2018         2019       2020      2021    2022         2023   2024
                  $9.10     $9.40                                                                                   (1)                     (1)                     (2)
                                                                                                           Net Supply         Net Demand          Forecast Supply
$9                                                                        60%
                                                                                  Key Upcoming Supply in CBD(2)                                                                             sf
$6                                                                        40%      2H 2020             Afro-Asia i-Mark                                                                140,000

$3                                                                        20%
                                                                                                       CapitaSpring                                                                    635,000
                                                                                        2021
                                                                                                       Hub Synergy Point Redevelopment                                                 131,200

$0                                                                        0%                           Central Boulevard Towers                                                   1,258,000
                                                                                        2022
       Dec-2015 Dec-2016 Dec-2017 Dec-2018 Dec-2019 Mar-2020 Jun-2020                                  Guoco Midtown                                                                650,000
                                                                                        2023           -
                           Average Grade A Rent ($ psf pm)
                           Core CBD Average Occupancy (%)                               2024           Keppel Towers Redevelopment                                                     541,600
                                                                                  (1) Based on URA data on historical net demand and supply of office space in Downtown Core
       Source: CBRE, 2Q 2020.                                                         and Rest of Central Area. Supply is calculated as net change of stock over the year and
                                                                                      may include office stock removed from market due to demolitions or change of use.
                                                                                  (2) Based on CBRE data on CBD Core and CBD Fringe.

                                                                                                                                                                                           9
Webinar with Syfe 13 August 2020 - Keppel Corporation
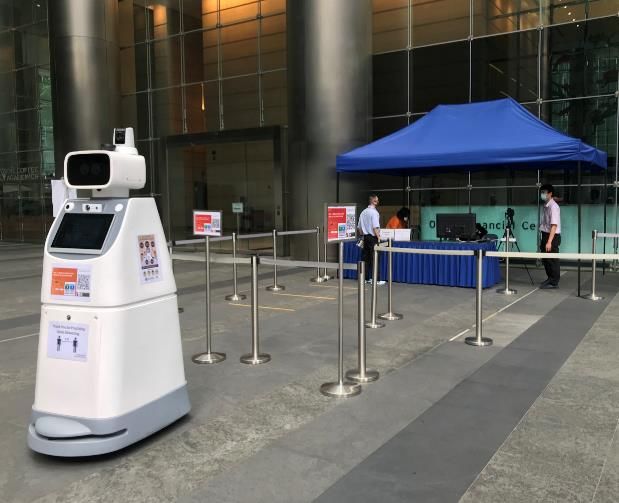
Committed to Delivering Stable Income & Sustainable Returns
   Portfolio Optimisation
• Portfolio optimisation to improve yield, while maintaining exposure to
  Singapore CBD                                                                          Portfolio
• Hold quality assets across different markets for improved income stability and        Optimisation
  to provide more long-term growth opportunities

    Asset Performance                                                                 Asset
                                                                                   Performance
• Drive individual asset performance with proactive leasing and cost
  management strategies
• Implement initiatives to future proof assets and enhance sustainability
                                                                                          Capital
                                                                                         Efficiency
     Capital Efficiency
• Optimise capital structure to reduce borrowing costs and improve returns
• Manage debt maturities and hedging profiles to reduce risk

                                                                                                 10
Thank You
For more information, please visit:
www.keppelreit.com

Connect with us on:

8 Chifley Square,
Sydney

                                      11
Additional
Information

T Tower, Seoul

                 12
Growth since Listing in 2006
                     Expanded footprint to Australia:                                                                                       Expanded footprint
                     77 King Street (100%), Sydney, and                                                                                     to South Korea:
                     275 George Street (50%), Brisbane                                                                                      T Tower (99.4%), Seoul

Listed on SGX
 >$600m AUM
  4 assets in
  Singapore
                                         Acquired                    Acquired                        Acquired                Acquired                         $7.9b(1) AUM
                                         - 8 Chifley Square (50%),   - David Malcolm Justice         three retail units at   311 Spencer Street               9 assets in Singapore,
                                         Sydney                      Centre (50%), Perth             8 Exhibition Street,    development (50%),              Australia & South Korea
                                         - Ocean Financial Centre    - 8 Exhibition Street (50%),    Melbourne               Melbourne
                                         (87.5%), Singapore          Melbourne                                                                                       2020
                                                                                                                                                      2019
                                                                                                                                          2018
                                                                                                                 2016         2017
                                                                                                    2015
                                                                                    2014
                                                                       2013
   2006                                       2011
                                                          2012
                     2009         2010
           2007

    Acquired        Increased      Asset swap:            Increased stake         Divested                     Divested          Divested             Divested
    One Raffles     stake in       Keppel Towers and      in Ocean Financial      Prudential Tower,            77 King Street,   20% minority stake   Bugis Junction
    Quay (33.3%),   Prudential     GE Tower for           Centre (to 99.9%),      Singapore                    Sydney            in Ocean Financial   Towers, Singapore
    Singapore       Towers,        MBFC Towers 1 & 2      Singapore                                                              Centre (to 79.9%),
                                                                                  Acquired
                    Singapore      and MBLM (33.3%),                                                                             Singapore
                                                                                  MBFC Tower 3 (33.3%),
                                   Singapore
                                                                                  Singapore

                      1)    Based on assets under management as at 30 June 2020.                                                                                        13
Financial Performance
                                                       2Q 2020              2Q 2019              +/(-)         1H 2020             1H 2019            +/(-)
Property Income                                         $36.8 m             $39.9 m            (7.9%)           $75.5 m            $79.9 m          (5.6%)
Net Property Income (NPI)                             $28.8 m(1)            $31.1 m            (7.2%)          $59.0 m             $62.4 m          (5.4%)
 Less: Attributable to Non-controlling Interests       ($4.1 m)             ($4.2 m)           (2.4%)          ($8.4 m)            ($8.3 m)         +2.2%
 NPI Attributable to Unitholders                        $24.7 m              $26.9 m           (8.0%)           $50.6 m             $54.1 m         (6.6%)
Share of Results of Associates
                                                       $28.3 m(2)           $27.0 m            +4.8%            $54.2 m            $53.4 m          +1.5%
and Joint Ventures
Distribution to Unitholders                            $47.5 m(3)          $47.3 m(4)          +0.4%          $94.8 m(3)          $94.6 m(4)        +0.2%
DPU (cents)                                                1.40                1.39            +0.7%              2.80                2.78          +0.7%

                                           (1) NPI was lower year-on-year due mainly to the divestment of Bugis Junction Towers in November 2019 and tenant
    2Q 2020 Distribution Timetable             relief measures implemented in view of COVID-19 outbreak, offset by contribution from T Tower which was
                                               acquired in May 2019.
Ex-Date: Mon, 27 Jul 2020                  (2) Share of results of associates was higher year-on-year due mainly to lower borrowing costs, offset by tenant relief
                                               measures and lower carpark income during the COVID-19 outbreak.
                                               Share of results of joint ventures was lower year-on-year due mainly to depreciation of Australian dollar against
Record Date: Tue, 28 Jul 2020                  Singapore dollar.
                                           (3) Includes capital gains distribution of $5.0 million for 2Q 2020 and $10.0 million for 1H 2020.
Payment Date: Fri, 28 Aug 2020
                                           (4) Includes capital gains distribution of $3.0 million for 2Q 2019 and $6.0 million for 1H 2019.

                                                                                                                                                         14
Income Contribution
                                                                                                             1H 2020           1H 2019
                                                                                                                          %                 %
                                                                                                               $’000             $’000
  Breakdown by Geography
       (For 1H 2020)                                 Ocean Financial Centre                                   33,365    29.3    32,796    27.0
                                                     Marina Bay Financial Centre                              38,241    33.6    42,373    34.9
 73.8%                                               One Raffles Quay                                         12,468    10.9    12,313    10.1
                                                     Bugis Junction Towers(1)                                      -       -     8,003     6.6
                                                     8 Chifley Square                                          6,362     5.6     6,214     5.1
                                                     8 Exhibition Street                                       5,448     4.8     6,355     5.2
                                       20.2%         275 George Street                                         4,861     4.3     5,651     4.7
                                                     David Malcolm Justice Centre                              6,296     5.5     6,399     5.3
                       6.0%
                                                     T Tower(2)                                                6,868     6.0     1,311     1.1
  Singapore       Australia     South Korea
                                                     Total                                                   113,909   100.0   121,415   100.0

(1) Bugis Junction Towers was divested on 29 November 2019.
(2) Reflects the amount attributable to Unitholders based on an interest of 99.4% acquired on 27 May 2019.

                                                                                                                                          15
Balance Sheet

                                                                                As at 30 Jun 2020                   As at 31 Mar 2020                  +/(-)

                                            (1)
         Deposited Property                                                            $8,078 m                             $8,013 m                   +0.8%

         Total Assets                                                                  $7,482 m                             $7,437 m                   +0.6%

         Borrowings(2)                                                                 $2,932 m                             $2,898 m                   +1.2%

         Total Liabilities                                                             $2,349 m                             $2,312 m                   +1.6%

         Unitholders’ Funds                                                            $4,556 m                             $4,545 m                   +0.2%

         Adjusted NAV per Unit(3)                                                         $1.33                                $1.33                     -

(1) Included interests in associates and joint ventures.
(2) Included borrowings accounted for at the level of associates and excluded the unamortised portion of upfront fees in relation to the borrowings.
(3) For 30 June 2020 and 31 March 2020, these excluded the distributions to be paid in August 2020 and paid in May 2020 respectively.

                                                                                                                                                               16
Prudent Capital Management
▪ All-in interest rate reduced year-on-year from 2.86% to 2.48%
▪ Approximately $938m of undrawn credit facilities available, including $369m of committed facilities
▪ Capital gains available from past divestments to enhance stability of distributions

                             As at 30 Jun 2020                                                       Debt Maturity Profile (As at 30 Jun 2020)

 Interest Coverage Ratio(1)                                             3.5x                                                                                          38%
                                                                                                       Completed                                                     $200m
 All-in Interest Rate                                              2.48% p.a.                          refinancing                                                   $75m           26%
                                                                                                      of 2020 loans
 Aggregate Leverage                                                   36.3%                                                                               16%
                                                                                                              0%                                                     $833m
                                                                                                                                           10%                                     $775m
 Weighted Average Term to Maturity                                  3.6 years                                                8%            $50m
                                                                                                            $400m                                       $484m
                                                                                                                           $238m          $230m                                                    2%
                                                                                                                                                                                                  $47m
 Borrowings on Fixed Rates                                              79%
                                                                                                             2020           2021           2022          2023         2024          2025          2026
                                                                                                              Bank loans                                      $50m 7-year MTN at 3.15%
 Unencumbered Assets                                                    72%                                                                                   (Issued in February 2015)
                                                                                                              $75m 7-year MTN at 3.275%                       $200m 5-year convertible bonds at 1.9%
                      (2)                                     SOR 50bps
 Sensitivity to SOR                                                                                           (Issued in April 2017)                          (Issued in April 2019)
                                                           = DPU ~0.07 cents

               (1)   Computed as trailing 12 months EBITDA (excluding effects of any fair value changes of derivatives and investment properties, and foreign exchange translation), over trailing
                     12 months interest expense and borrowing-related fees, as defined in the Code on Collective Investment Schemes revised by the Monetary Authority of Singapore on 16 April 2020. 17
               (2)   Based on the Group’s borrowings including those accounted for at the level of associates, and number of Units in issue as at 30 June 2020.
1H 2020 Leasing Update
                                                                       Total Leases Committed                      Leases Committed by Geography(4)
                                                                                                                                           7.5%

                                                                          ~623,200 sf                                                               19.8%

                                                                       (Attributable ~267,800 sf)
                                                                                                                              72.7%
                                                                             Retention Rate
                                                                                 71%(3)                                    Singapore   Australia   South Korea

                                                                  Leases Committed by Type(4)                       New leasing demand and expansions from:

                                                                                                               Real estate and property services                      41.9%
     Average signing rent for                                            37.7%
                                                                                                               Technology, media and telecommunications               27.0%
     Singapore office leases
                                                                                               22.6%
                    (1)                                                                                        Banking, insurance and financial services              15.2%
  ~$11.86                 psf pm                                                                               Energy, natural resources, shipping and marine         9.5%
above Grade A core CBD market average                                    39.7%
                                                                                                               Accounting and consultancy services                    4.0%
          of $11.15(2) psf pm
                                                                              Renewal leases                   Retail and F&B                                         2.4%
                                                                              New leases
                                                                              Rent review leases

             (1)   For the Singapore office leases concluded in 1H 2020 and based on a simple average calculation. Weighted average signing rent was $10.91 psf pm.
             (2)   Source: CBRE, 2Q 2020.
             (3)   For 1H 2020. Retention rate for 2Q 2020 was 91%.                                                                                              18
             (4)   Based on committed attributable area.
High Occupancy and Long WALE
▪ HSBC Singapore’s 10-year lease at Marina Bay Financial Centre commenced in May 2020
▪ High portfolio committed occupancy of 98.6%
▪ Long overall portfolio WALE of 4.6 years (Singapore portfolio: 3.5 years, Australia portfolio: 8.5 years,
  South Korea portfolio: 1.9 years); Top 10 tenants’ WALE was 6.5 years

 High Portfolio Committed Occupancy
 (As at 30 Jun 2020)
                        Singapore                                                                   Australia                                            South Korea      Overall
                          98.7%                                                                      98.3%                                                 97.7%          98.6%
         98.8%               99.1%                98.0%                                      98.2%               100.0%                100.0%               97.7%           98.6%
                                                                      96.5%

                    Singapore’s core CBD                                                  Australia’s national CBD                                  Seoul’s CBD average
                 average occupancy: 94.4%(1)                                            average occupancy: 91.6%(2)                                 occupancy: 91.2%(2)

     Ocean Financial   Marina Bay Financial   One Raffles Quay   275 George Street,   8 Exhibition Street,   8 Chifley Square,   David Malcolm Justice     T Tower,        Portfolio
         Centre              Centre                                  Brisbane             Melbourne              Sydney              Centre, Perth          Seoul

Sources: (1) CBRE, 2Q 2020 (2) JLL Research, 1Q 2020
Note: Based on committed attributable area.

                                                                                                                                                                                       19
Lease Expiry Profile and Expiring Rents
▪ Only 2.2% of leases expiring and 0.5% due for rent review for the remainder of 2020(1)
▪ Average expiring rents(2) of Singapore office leases (psf pm): $10.45 in 2020, $9.73 in 2021 and $10.22 in 2022

                                                                                                                                           32.2%
Lease Expiries and Rent Reviews
(Based on Committed Attributable NLA)
                                                                                    22.4%
                                                              18.0%
     Expiring Leases
                                                                                                                         12.8%
                                                                                                          11.0%
     Rent Review Leases
                                                                      6.5%                                                                         6.8%
                                        2.2%
                                               0.5%                                         0.0%                  0.2%           0.3%

                                          2020                  2021                   2022                  2023          2024         2025 and beyond
 Lease Expiries and Rent Reviews (Based on Committed Attributable Gross Rent)
 Expiring leases                2.4%          18.0%            22.4%          12.5%                                       14.3%             30.4%
 Rent review leases             0.5%           7.0%               -            0.2%                                        0.4%             6.6%
 Geographic Breakdown of Expiries and Rent Reviews (1)
 Singapore                      2.3%          19.6%            16.0%          10.0%                                       11.6%             17.9%
 Australia                      0.1%           1.8%             3.3%           0.9%                                       1.5%              20.8%
 South Korea                    0.3%           3.1%             3.1%           0.3%                                          -              0.3%

                   Note: All data as at 30 June 2020.
                                                                                                                                                          20
                   (1) Based on committed attributable NLA.
                   (2) Weighted average based on attributable NLA of office lease expiries and reviews in Singapore.
311 Spencer Street Achieves Practical Completion

                                                  ▪ Commencement of the 30-year lease for Victoria Police’s new
                                                    headquarters contributes a steady income stream to Keppel REIT

                                                  ▪ The Grade A office tower is designed to be an eco-icon in Melbourne
                                                    and is powered by 100% renewable electricity as part of the City of
                                                    Melbourne’s second Melbourne Renewable Energy Project

                                                                       Victoria Police Centre at 311 Spencer Street, Melbourne

                                                        Ownership                                     50.0%

                                                        Attributable NLA                              364,180 sf​ (33,833 sm)

                                                        Tenure                                        Freehold

                                                        Committed Occupancy                           100% ​

                                                        Carrying Amount                               A$384.3 million(1) (S$372.5 million)(2)

                                                        Initial NPI Yield                             4.4%(3)

        (1) Based on “as is” valuation as at 31 December 2019, as well as progress payments and capitalised costs from 1 January 2020 to 9 July 2020.
            Includes A$5.4 million of estimated final payment to be made after 9 July 2020.                                                             21
        (2) Based on the exchange rate of A$1 = S$0.9695 as at 9 July 2020.
        (3) Based on the carrying amount as at 9 July 2020 and expected NPI for the first 12 months of the lease.
Australia Office Market
▪ National CBD office market occupancy decreased slightly quarter-on-quarter from 91.7% as at
  end December 2019 to 91.6% as at end March 2020

                                                       94.9%      96.0%        95.2%        94.5%                                                                      92.8%      91.5%      89.2%
                                     91.8%   91.3%                                                  100%                             86.8%     86.0%       89.6%                                        100%
                           1,200                                                                                             1,200
                                                                   1,032      1,045         1,058   80%                                                                                                 80%
                                                         964
  Sydney CBD                 900               799                                                  60%    Brisbane CBD       900                                                                       60%
                                      679
                             600                                                                                              600                                                                       40%
                                                                                                    40%                               397       389         386         396        409           418
  Prime Grade occupancy300                                                                          20%    Prime Grade occupancy
                                                                                                                              300                                                                       20%
  was lower at 94.5%                                                                                       was lower at 89.2%   0                                                                       0%
                                 0                                                                  0%
                                      4Q15    4Q16       4Q17       4Q18       4Q19         1Q20                                      4Q15      4Q16        4Q17       4Q18        4Q19          1Q20

                                                Prime Gross Effective Rent (AUD psm/year)                                                            Prime Gross Effective Rent (AUD psm/year)
                                                Prime Grade Occupancy (%)                                                                            Prime Grade Occupancy (%)

                                                                               98.2%        98.2%
                                             92.1%     94.0%       97.0%                                                                                              84.0%       86.5%      85.6%      100%
                                     90.1%                                                          100%                                     77.7%         81.4%
                            1,200                                                                   90%                      1,200 76.5%
                                                                                                    80%                                                                                                 80%

  Melbourne CBD              900
                                                                                                    70%
                                                                                                    60%
                                                                                                           Perth CBD          900                                                                       60%
                                                                                573          575    50%
                             600                          503        538                                                      600     491                   435         447        453           456    40%
                                       406     448                                                  40%                                         431
  Prime Grade occupancy300                                                                          30%    Prime Grade occupancy
                                                                                                                              300                                                                       20%
                                                                                                    20%
  was maintained at 98.2% 0                                                                         10%    was lower at 85.6%
                                                                                                    0%                          0                                                                       0%
                                      4Q15    4Q16       4Q17       4Q18       4Q19         1Q20                                     4Q15      4Q16         4Q17       4Q18       4Q19       1Q20
                                                 Prime Gross Effective Rent (AUD psm/year)                                                       Prime Gross Effective Rent (AUD psm/year)
                                                 Prime Grade Occupancy (%)                                                                       Prime Grade Occupancy (%)

Source: JLL Research, 1Q 2020.

                                                                                                                                                                                                  22
Seoul Office Market
▪ CBD Grade A occupancy improved from 90.7%(1) as at end December 2019 to 91.2% as at
  end March 2020

                                                                                               CBD Grade A Rent and Occupancy
                                                                                                                                                                 (1)
                                                                                     200,000                                                             90.7%         91.2%         100%
                                                                                                87.5%          84.9%         86.5%
                                                                                                                                           82.7%
                                                                                     160,000                                                                                         80%

                                                                                     120,000                                                                                         60%
                                                                                                95,618         95,164                                    91,484        93,498
                                                                                                                             91,704        92,148
                                                                                      80,000                                                                                         40%

                                                                                      40,000                                                                                         20%

                                                                                          0                                                                                          0%
                                                                                                 4Q15          4Q16          4Q17           4Q18          4Q19         1Q20

                                                                                                                   CBD Grade A Net Effective Rent (KRW per py pm)

                                                                                                                   CBD Grade A Occupancy (%)

Source: JLL Research, 1Q 2020.
(1) Based on JLL’s revised 4Q 2019 Seoul CBD Grade A occupancy rate of 90.7% (previously reported as 90.0%).

                                                                                                                                                                                23
Portfolio Information: Singapore
                                                                                           Marina Bay
                                               Ocean Financial Centre                                                     One Raffles Quay
                                                                                        Financial Centre(4)
                       Attributable NLA                            700,504 sf                         1,024,238 sf                        441,424 sf
                              Ownership                                 79.9%                               33.3%                              33.3%

                                                                BNP Paribas,                        DBS Bank,                       Deutsche Bank,
                     Principal   tenants(1)                            ANZ,           Standard Chartered Bank,                       Ernst & Young,
                                                               Drew & Napier                          Barclays                                 UBS

                                                                                                99 years expiring
                                                            99 years expiring                                                      99 years expiring
                                   Tenure                                                      10 Oct 2104(5) and
                                                                13 Dec 2110                                                            12 Jun 2100
                                                                                                    7 Mar 2106(6)
                        Purchase Price                                                               S$1,426.8m(5)
                                                               S$1,838.6m(3)                                                              S$941.5m
                        (on acquisition)                                                             S$1,248.0m(6)
                                                                                                     S$1,695.3m(5)
                             Valuation(2)                        S$2,099.8m                                                             S$1,254.3m
                                                                                                     S$1,297.0m(6)
                                                                                                3.63%(7); 4.50%(8);
                    Capitalisation rates                                3.50%                                                                  3.63%
                                                                                                           3.60%(6)

1) On committed gross rent basis.                                                                             5) Refers to MBFC Towers 1 and 2 and MBLM.
2) Valuation as at 31 December 2019 based on Keppel REIT’s interest in the respective properties.             6) Refers to MBFC Tower 3.
3) Based on Keppel REIT’s 79.9% of the historical purchase price.                                             7) Refers to MBFC Towers 1 and 2.
4) Comprises Marina Bay Financial Centre (MBFC) Towers 1, 2 and 3 and Marina Bay Link Mall (MBLM).            8) Refers to MBLM.

                                                                                                                                                           24
Portfolio Information: Australia & South Korea
                                                                                                                                               311 Spencer Street,
                           8 Chifley Square, 8 Exhibition Street,                  275 George Street,             David Malcolm                    Melbourne                      T Tower,
                               Sydney           Melbourne(3)                           Brisbane                Justice Centre, Perth            (Practical completion on           Seoul
                                                                                                                                                      9 July 2020)

   Attributable NLA                   104,055 sf                  244,659 sf                   224,537 sf                     167,784 sf                   364,180 sf                226,949 sf
           Ownership                       50.0%                        50.0%                       50.0%                          50.0%                         50.0%                     99.4%
                              Corrs Chambers                Ernst & Young,           Telstra, Queensland                                                                            Hankook
                                                                                                                  Minister for Works -
                                   Westgarth,            Amazon, Minister                  Gas Company,                                        Minister for Finance          Corporation, SK
 Principal tenants(1)                                                                                                 Government of
                                    Quantium,           for Finance - State                   The State of                                       - State of Victoria        Communications,
                                                                                                                   Western Australia
                               QBE Insurance                     of Victoria                Queensland(6)                                                                      Philips Korea
                             99 years expiring                                                                       99 years expiring
                Tenure                                               Freehold                    Freehold                                                    Freehold                  Freehold
                                   5 Apr 2105                                                                            30 Aug 2114
     Purchase Price                   A$165.0m                   A$168.8m                      A$166.0m                       A$165.0m                    A$347.8m                 KRW252.6b
     (on acquisition)                 S$197.8m                  S$201.3m(3)                    S$209.4m                       S$208.1m                   S$362.4m(7)               S$292.0m(9)
                                      A$240.0m                   A$265.3m                      A$250.0m                       A$232.5m                    A$384.3m                 KRW259.0b
          Valuation(2)
                                      S$222.2m                  S$245.6m(3)                    S$231.4m                       S$215.2m                   S$372.5m(8)                S$299.9m
Capitalisation rates                       4.75%         5.00%(4); 4.50%(5)                         5.00%                          5.38%                         4.50%                     4.50%

1) On committed gross rent basis.                                                           7) Based on the aggregate consideration paid-to-date and to be paid, including development costs of the
2) Valuation as at 31 December 2019 based on Keppel REIT’s interest in the respective         building, at the exchange rate of A$1=S$1.042 as disclosed in the announcement dated 29 June 2017.
  properties and on the exchange rates of A$1 = S$0.9257 and KRW 1,000 = S$1.158.           8) Carrying amount based on “as is” valuation as at 31 December 2019, as well as progress payments and
3) Keppel REIT owns a 50% interest in the 8 Exhibition Street office building and a 100%      capitalised costs from 1 January 2020 to 9 July 2020. Includes A$5.4 million of estimated final payment
  interest in the three adjacent retail units.                                                to be made after 9 July 2020. Based on the exchange rate of A$1 = S$0.9695 as at 9 July 2020.
4) Refers to Keppel REIT’s 50% interest in the office building.                             9) Based on Keppel REIT’s interest in T Tower and an exchange rate of KRW 1,000 = S$1.156 used for
5) Refers to Keppel REIT’s 100% interest in the three adjacent retail units.                  payment.
6) Refers to the Department of Housing and Public Works – The State of Queensland.

                                                                                                                                                                                           25
Keppel REIT Structure

              Keppel Capital                                   Keppel Land
                                                                                                                 Institutional and
         The REIT Manager can leverage
                                                         The REIT Manager can leverage                            Public Investors
                                                           the Sponsor‘s expertise and
        the scale and resources of a larger                                                                             50.9%
           asset management platform
                                              5.5%         track record in this industry

                                                                                     43.6%
                            100%
                                                 Management                                                                     Acting on behalf of
                                                   services                                                                         Unitholders
                REIT Manager                                                                                                                                   Trustee
                                                                                                                                     Trustee’s
                                                Management fees                            Keppel REIT                                 fees
                Keppel REIT                                                                                                                           RBC Investor Services Trust
             Management Limited                                                                                                                           Singapore Limited

                                                                        Ownership of                     Income
                                                                              assets                     contribution
                                                  Property
                                                 management
                                                   services
            Property Managers                                                              Properties
                                                   Property
                                                management fees
Note: As of 30 June 2020.

                                                                                                                                                                           26
IMPORTANT NOTICE: The past performance of Keppel REIT is not necessarily indicative of its future performance. Certain statements made in this presentation may not be based on historical
information or facts and may be “forward-looking” statements due to a number of risks, uncertainties and assumptions. Representative examples of these factors include (without limitation) general
industry and economic conditions, interest rate trends, cost of capital and capital availability, competition from similar developments or shifts in expected levels of property rental income, changes in
operating expenses, including employee wages, benefits and training, property expenses and governmental and public policy changes, and the continued availability of financing in the amounts and
terms necessary to support future business.

Prospective investors and unitholders of Keppel REIT (“Unitholders”) are cautioned not to place undue reliance on these forward-looking statements, which are based on the current view of Keppel
REIT Management Limited, as manager of Keppel REIT (the “Manager”) on future events. No representation or warranty, express or implied, is made as to, and no reliance should be placed on, the
fairness, accuracy, completeness or correctness of the information, or opinions contained in this presentation. None of the Manager, the trustee of Keppel REIT or any of their respective advisors,
representatives or agents shall have any responsibility or liability whatsoever (for negligence or otherwise) for any loss howsoever arising from any use of this presentation or its contents or otherwise
arising in connection with this presentation. The information set out herein may be subject to updating, completion, revision, verification and amendment and such information may change materially.
The value of units in Keppel REIT (“Units”) and the income derived from them may fall as well as rise. Units are not obligations of, deposits in, or guaranteed by, the Manager or any of its affiliates. An
investment in Units is subject to investment risks, including the possible loss of the principal amount invested.

Investors have no right to request the Manager to redeem their Units while the Units are listed. It is intended that Unitholders may only deal in their Units through trading on Singapore Exchange
Securities Trading Limited (“SGX-ST”). Listing of the Units on SGX-ST does not guarantee a liquid market for the Units.

                                                                                                                                                                                                    27
You can also read