Morgan Stanley Virtual ASEAN Best Conference - 30 June 2020 - Keppel REIT

Page created by Calvin Hunt
 
CONTINUE READING
Morgan Stanley Virtual ASEAN Best Conference - 30 June 2020 - Keppel REIT
Morgan Stanley Virtual
ASEAN Best Conference

30 June 2020
Morgan Stanley Virtual ASEAN Best Conference - 30 June 2020 - Keppel REIT
Outline

       • Overview                                                                                                                                                    3

       • Navigating the COVID-19 Situation                                                                                                                          11

       • Additional Information                                                                                                                                     16

IMPORTANT NOTICE: The past performance of Keppel REIT is not necessarily indicative of its future performance. Certain statements made in this presentation may not be based on historical information or facts and may be
“forward-looking” statements due to a number of risks, uncertainties and assumptions. Representative examples of these factors include (without limitation) general industry and economic conditions, interest rate trends, cost of
capital and capital availability, competition from similar developments or shifts in expected levels of property rental income, changes in operating expenses, including employee wages, benefits and training, property expenses
and governmental and public policy changes, and the continued availability of financing in the amounts and terms necessary to support future business.

Prospective investors and unitholders of Keppel REIT (“Unitholders”) are cautioned not to place undue reliance on these forward-looking statements, which are based on the current view of Keppel REIT Management Limited, as
manager of Keppel REIT (the “Manager”) on future events. No representation or warranty, express or implied, is made as to, and no reliance should be placed on, the fairness, accuracy, completeness or correctness of the
information, or opinions contained in this presentation. None of the Manager, the trustee of Keppel REIT or any of their respective advisors, representatives or agents shall have any responsibility or liability whatsoever (for
negligence or otherwise) for any loss howsoever arising from any use of this presentation or its contents or otherwise arising in connection with this presentation. The information set out herein may be subject to updating,
completion, revision, verification and amendment and such information may change materially. The value of units in Keppel REIT (“Units”) and the income derived from them may fall as well as rise. Units are not obligations of,
deposits in, or guaranteed by, the Manager or any of its affiliates. An investment in Units is subject to investment risks, including the possible loss of the principal amount invested.

Investors have no right to request the Manager to redeem their Units while the Units are listed. It is intended that Unitholders may only deal in their Units through trading on Singapore Exchange Securities Trading Limited (“SGX-
ST”). Listing of the Units on SGX-ST does not guarantee a liquid market for the Units.

                                                                                                                                                                                                                     2
Morgan Stanley Virtual ASEAN Best Conference - 30 June 2020 - Keppel REIT
Overview

Marina Bay Financial Centre,
Singapore

                               3
Morgan Stanley Virtual ASEAN Best Conference - 30 June 2020 - Keppel REIT
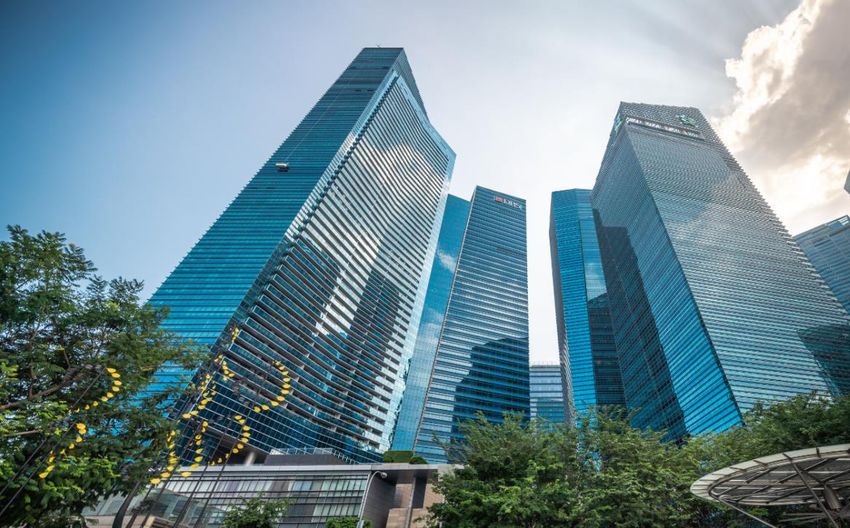
Portfolio Anchored by Singapore CBD Assets
                 $7.9 billion portfolio in key business districts of Singapore, Australia and South Korea
                                 enhances income diversification and long-term stability

                                                                                    T Tower, Seoul
                                    311 Spencer Street,
                                                                                    99.4% Interest
                                         Melbourne
                                                                    South Korea
                                        50% Interest                                                 Ocean Financial
                                     (Under development)              3.8%
                                                                                                         Centre
        8 Exhibition Street,                                                                          79.9% Interest
            Melbourne
           50% Interest

275 George Street,
                                                                                  Singapore                    Marina Bay
                                                                                                            Financial Centre
    Brisbane
   50% Interest
                                  Australia
                                   15.7%                                          80.5%                      33.3% Interest

   David Malcolm
   Justice Centre,
                                                                                                      One Raffles Quay
        Perth
                                             8 Chifley Square,                                         33.3% Interest
    50% Interest
                                                  Sydney
                                                50% Interest

      Note: Based on assets under management as at 31 March 2019.

                                                                                                                       4
Morgan Stanley Virtual ASEAN Best Conference - 30 June 2020 - Keppel REIT
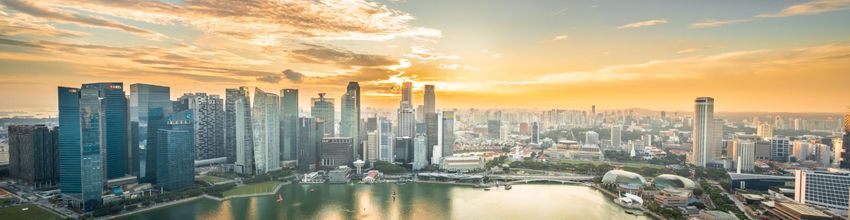
Active Portfolio Optimisation
 ▪     Portfolio optimisation in FY 2019 to improve yield and create long-term value for Unitholders
 ▪     Holding quality assets across different markets improves income diversification and growth
       opportunities in the long term
                                                              Portfolio Optimisation in FY 2019

              May 2019: Acquisition of                                 Nov 2019: Divestment of                           Expected by end 2Q 2020: Completion of
                 T Tower in Seoul                                 Bugis Junction Towers in Singapore                        311 Spencer Street in Melbourne
 • Acquisition Price: $292.0 million(1)                     • Sale Price: $547.7 million(2)                             • Acquisition Price: $362.4m(3) million
 • NPI yield: 4.7%                                          • NPI yield: 3.0%                                           • NPI yield: 4.9%(4)
 (1) Based on an exchange rate of KRW 1,000 to $1.156 used for payment.
 (2) The sale price was adjusted upwards from $547.5 million to $547.7 million, arising from an increase in leased area post-announcement of the divestment. The sale price
     per square foot (psf) remained unchanged at $2,200 psf.
 (3) Based on an exchange rate of A$1 to S$1.042 as disclosed in the announcement dated 29 June 2017.
 (4) Initial NPI yield of 4.9%, which translates to a stable average NPI yield of 6.4% over the first 15 years of the lease after taking into account annual rental escalation.

                                                                                                                                                                             5
Morgan Stanley Virtual ASEAN Best Conference - 30 June 2020 - Keppel REIT
1Q 2020 Key Highlights
▪   Distributable income was $47.3 million(1); DPU was 1.40 cents
▪   Aggregate leverage was 36.2% and all-in interest rate was 2.58% p.a.
▪   Refinanced majority of loans due in 2020 and received commitments for the remainder
▪   High portfolio committed occupancy of 98.9% and long portfolio WALE of 4.7 years
▪   Announced measures to support tenants during the COVID-19 outbreak and safeguard long-term
    interests of all stakeholders

              Marina Bay                 One Raffles       Ocean Financial
           Financial Centre                Quay                Centre

                (1) Includes capital gains distribution of $5.0 million for 1Q 2020.         6
Morgan Stanley Virtual ASEAN Best Conference - 30 June 2020 - Keppel REIT
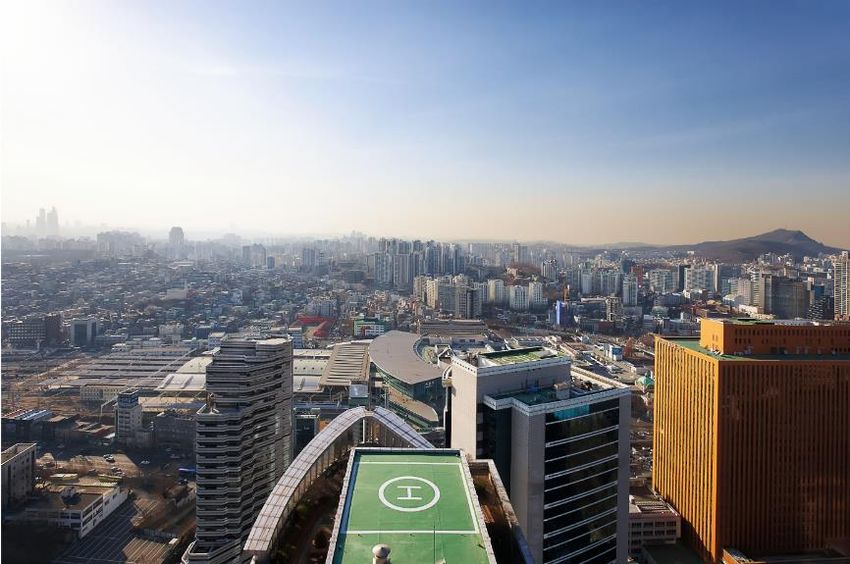
1Q 2020 Leasing Update
                                                                    Total Leases Committed                       Leases Committed by Geography(4)

                                                                        ~170,600 sf                                                                18.6%
                                                                      (Attributable ~75,200 sf)
                                                                                                                          81.4%
                                                                           Retention Rate
                                                                               50%(3)                                         Singapore       Australia

                                                                Leases Committed by Type(4)                       New leasing demand and expansions from:

                                                                                                            Real estate and property services                       55.0%
     Average signing rent for
                                                                                                            Banking, insurance and financial services               22.8%
     Singapore office leases                                                                  53.7%
                 (1)                                                                                        Technology, media and telecommunications                10.7%
  ~$12.16               psf pm                                     46.3%
                                                                                                            Accounting and consultancy services                     6.0%
above Grade A core CBD market average
                                                                                                            Energy, natural resources, shipping and marine          3.7%
          of $11.50(2) psf pm
                                                                                                            Retail and F&B                                          1.8%
                                                                      Renewal leases    New leases

             (1) For the Singapore office leases concluded in 1Q 2020 and based on a simple average calculation. Weighted average signing rent was $12.08 psf pm.
             (2) Source: CBRE, 1Q 2020.
             (3) Lower tenant retention rate for 1Q 2020 due mainly to non-renewals at 275 George Street in Brisbane, as well as at Marina Bay Financial Centre
                                                                                                                                                                7
                 and One Raffles Quay in Singapore. The majority of the non-renewed spaces have been leased to new and expanding tenants.
             (4) Based on committed attributable area.
Morgan Stanley Virtual ASEAN Best Conference - 30 June 2020 - Keppel REIT
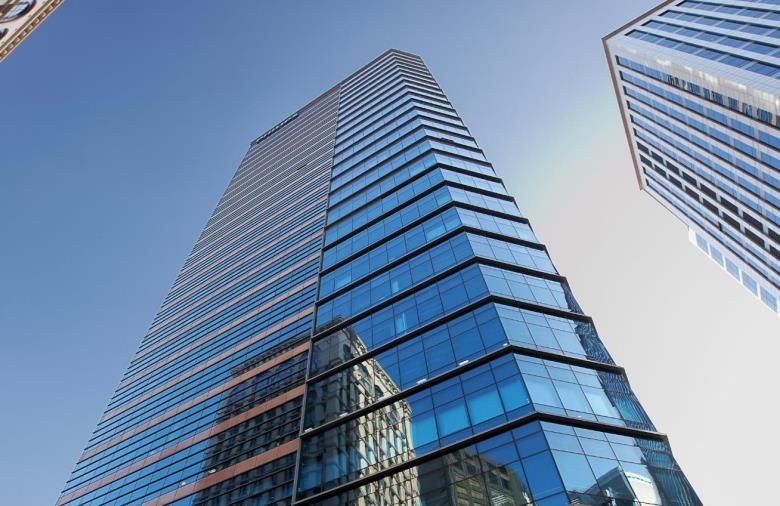
High Occupancy and Long WALE
▪ High portfolio committed occupancy of 98.9%
▪ Long overall portfolio WALE of 4.7 years (Singapore portfolio: 3.7 years, Australia portfolio: 8.8 years,
  South Korea portfolio: 1.6 years); Top 10 tenants’ WALE was 6.7 years

 High Portfolio Committed Occupancy
 (As at 31 March 2020)

                        Singapore                                                                   Australia                                            South Korea       Overall
                          98.8%                                                                      98.8%                                                 100.0%          98.9%

         98.8%               99.1%                98.2%               98.1%                  98.2%               100.0%                100.0%              100.0%            98.9%

                    Singapore’s core CBD                                                  Australia’s national CBD
                 average occupancy: 95.4%(1)                                            average occupancy: 91.7%(2)
                                                                                                                                                     Seoul CBD average
                                                                                                                                                     occupancy: 90.0%(2)

     Ocean Financial   Marina Bay Financial   One Raffles Quay   275 George Street,   8 Exhibition Street,   8 Chifley Square,   David Malcolm Justice     T Tower,         Portfolio
         Centre              Centre                                  Brisbane             Melbourne              Sydney              Centre, Perth          Seoul

Sources: (1) CBRE, 1Q 2020 (2) JLL Research, 4Q 2019
Note: Based on committed attributable area.

                                                                                                                                                                                        8
Morgan Stanley Virtual ASEAN Best Conference - 30 June 2020 - Keppel REIT
Lease Expiry Profile and Expiring Rents
▪ Only remaining 4.9% of leases expiring and 3.9% due for rent review in 2020(1)
▪ Average expiring rents(2) of Singapore office leases (psf pm): $9.37 in 2020, $9.75 in 2021 and $10.20 in 2022
                                                                                                                                          31.6%

Lease Expiries and Rent Reviews
                                                                                   22.3%
(Based on Committed Attributable NLA)
                                                             16.3%
     Expiring Leases                                                                                                    13.3%
                                                                                                         10.5%
     Rent Review Leases                                              6.5%                                                                         6.8%
                                        4.9% 3.9%
                                                                                           0.0%                  0.2%           0.3%

                                          2020                  2021                   2022                  2023         2024         2025 and beyond
 Lease Expiries and Rent Reviews (Based on Committed Attributable Gross Rent)
 Expiring leases                4.7%          16.7%            22.4%          11.8%                                      14.8%             29.6%
 Rent review leases             3.7%           7.0%               -            0.2%                                       0.4%             6.7%
 Geographic Breakdown of Expiries and Rent Reviews (1)
 Singapore                      6.2%          19.8%            16.0%           9.5%                                      11.6%             17.7%
 Australia                      0.4%           1.4%             3.2%           0.9%                                      2.0%              20.7%
 South Korea                    2.2%           1.6%             3.1%           0.3%                                         -                -

                  Note: All data as at 31 March 2020.
                                                                                                                                                         9
                  (1) Based on committed attributable NLA.
                  (2) Weighted average based on attributable NLA of office lease expiries and reviews in Singapore.
Morgan Stanley Virtual ASEAN Best Conference - 30 June 2020 - Keppel REIT
Prudent Capital Management
▪ Low aggregate leverage of 36.2%, with interest coverage                                                                                        As at 31 March 2020
  ratio at 3.2x(1)
                                                                                                                        Interest Coverage Ratio(1)                                             3.2x
▪ No further loan refinancing for FY 2020                                                                               All-in Interest Rate                                              2.58% p.a.
▪ Renewal of Unit buy-back mandate                                                                                      Aggregate Leverage                                                   36.2%
                                                                                                                        Weighted Average Term to Maturity                                  3.8 years
    Debt Maturity Profile (As at 31 March 2020)
                                                                                                                        Unencumbered Assets                                                    72%
                                                                         38%
  Obtained facilities to                                                $200m
                                                                                                                                     Managing interest rate exposure
refinance all 2020 loans(2)                                              $75m             27%

                                                         16%
           0%
                                         11%                            $818m
                                                                                                                                                                        Sensitivity to SOR(3)
                                                                                        $775m
                         8%             $50m
                                                       $484m                                                                             79%                        Every 50 bps                in SOR
          $400m
                        $234m          $262m                                                                                        Borrowings on
                                                                                                                                     Fixed Rates                              translates to
           2020         2021            2022            2023             2024            2025
                                                       $50m 7-year MTN at 3.15%
                                                                                                                                                                    ~0.07 cents               in DPU
           Bank loans
                                                       (Issued in February 2015)
           $75m 7-year MTN at 3.275%                   $200m 5-year convertible bonds at 1.9%
           (Issued in April 2017)                      (Issued in April 2019)

                  (1)   Computed as trailing 12 months EBITDA (excluding effects of any fair value changes of derivatives and investment properties, and foreign exchange translation), over trailing
                        12 months interest expense and borrowing-related fees, as defined in the Code on Collective Investment Schemes revised by the Monetary Authority of Singapore on 16 April 2020. 10
                  (2)   Comprised loans refinanced in 1Q 2020 and facilities obtained to refinance the remaining loans due in 2020.
                  (3)   Based on the Group’s borrowings including those accounted for at the level of associates, and number of Units in issue as at 31 March 2020.
Navigating
the COVID-19
Situation

Ocean Financial Centre
lit in blue in support of the
#SeeItBlue campaign that
highlights importance of
mental well-being and thanks
frontline workers battling the
COVID-19 outbreak

                                 11
Navigating the COVID-19 Situation
   Keppel REIT’s properties in Singapore, Australia and South Korea                                                                            AUM by Geography
  remain accessible to tenants that are operational during COVID-19                                                                            (As at 31 March 2020)

Certain measures implemented by the Government:                                                                                                              3.8%
                                                                                                                                                         15.7%                        Singapore
                   South Korea                                                                                                                                                        Australia
                   ▪ Social distancing advisory from the government but there is currently no                                                                                         South Korea
                      general government measure mandating the closure of all office buildings                                                                    80.5%

                   Singapore
                   ▪ Temporary closure of non-essential businesses during “Circuit Breaker”
                   ▪ “COVID-19 (Temporary Measures) Act 2020” may provide temporary relief
                                                                                                                                               Committed NLA by Asset Type
                      during prescribed period to tenants unable to fulfil contractual obligations
                      where the inability is to a material extent caused by COVID-19(1)                                                        (As at 31 March 2020)

                   Australia                                                                                                                                   1.8%
                   ▪ Temporary closure of non-essential services amidst lockdown measures
                   ▪ “Mandatory Code of Conduct” issued by the National Cabinet, focusing on                                                                                             Office
                      SMEs with turnover below A$50m, which seeks to protect eligible tenants                                                                                            Retail
                      from termination of leases and entitles eligible tenants to rent reductions(2)
                                                                                                                                                              98.2%

                 Note: Measures as at publication of 1Q 2020 results announcement on 22 April 2020.
                 (1) Tenant’s obligations are not cancelled, instead rental payments will continue to accrue. Applicable to contracts in which the obligations have to be performed on or
                     after 1 February 2020, excluding those entered into on or after 25 March 2020.
                 (2) Only applicable to SMEs with turnover of A$50m or less, and who are eligible for the federal Jobkeeper program. One of the main criteria for a business to be eligible       12
                     for the program is a projected reduction of revenue by more than 30% due to COVID-19. Rent reductions may consist of a combination of waivers and deferrals where
                     rental waiver must be no less than 50% of the total rent reduction.
Navigating the COVID-19 Situation (Cont’d)
    Keppel REIT’s established tenants from diversified sectors, high portfolio committed occupancy and
                    long WALE will continue to support the REIT’s income resilience
▪ Retail and F&B sector takes up approximately 1.8% of attributable NLA, while office sub-sectors(1) that are
  more affected by lower footfall and tourism form less than 5%
▪ Top 10 tenants take up 37.8% of NLA and contribute 34.8% of gross rent
                                                                                                                Top 10 Tenants
                     Banking, insurance and financial services                 40.2%
                                                                                                       DBS                                                   6.6%
                                                                                              Government of
                     Technology, media and telecommunications                  12.9%                 GOWA
                                                                                            Western Australia                                        5.3%
                     Legal                                                      8.8%
                                                                                          Standard Chartered                                  4.3%
                     Government agency                                          8.3%
                     Energy, natural resources, shipping and marine             8.1%          Ernst & Young                                 4.2%
    Tenant
                     Real estate and property services                          6.2%
   Business                                                                                     BNP Paribas                                 4.1%
                                                                                                                                                        Marina Bay
                     Accounting and consultancy services                        5.9%
    Sector           Services                                                   4.4%
                                                                                                     Telstra                           3.4%
                                                                                                                                                        Financial Centre

                                                                                                                                                        David Malcolm
                     Manufacturing and distribution                             2.3%                   UBS                      2.6%                    Justice Centre
                     Retail and food & beverage                                 1.8%                                                                    One Raffles Quay
                                                                                              Drew & Napier                    2.5%
                     Hospitality and leisure                                    0.1%                                                                    8 Exhibition Street
                     Others                                                     1.0%                    ANZ                    2.5%                     Ocean Financial Centre
                     Total                                                     100%                Deutsche                   2.3%                      275 George Street

               Note: All data as at 31 March 2020 and based on portfolio committed NLA.                                                                                    13
               (1) Such as tourism-related technology, co-working & serviced offices, gyms, medical clinics, hospitality-related sectors.
Navigating the COVID-19 Situation (Cont’d)
                                                                Supporting Interests of                                                 Effective
           Safety as Priority
                                                                   All Stakeholders                                               Capital Management

• Precautionary health and safety                  • Tenant support measures rolled out                                   • Refinanced majority of loans
  measures implemented across                        to support business continuity :                                       due in 2020 and received
  all properties                                       - Retail tenants in Singapore: Full pass-through                     commitments for the remainder
                                                         of the 100% property tax rebate; Eligible retail
• With social distancing measures:                       tenants also given full rental waiver for April                  • ~$966 million of undrawn credit
                                                         2020(2), as well as ability to utilise one month’s
 - Construction works continue                           security deposit to offset rent payment                            facilities, of which ~$400 million
   at 311 Spencer Street but at a                                                                                           are committed facilities
                                                       - Office tenants in Singapore: Full pass-through
   slower pace. Expected                                 of the 30% property tax rebate
   handover by end-2Q 2020
                             (1)
                                                       - Australia & Korea tenants: Support measures
                                                                                                                          • Capital gains available from
                                                         in line with the relevant government advisories                    past divestments to enhance
 - Leasing activities have slowed                        will also be extended to all qualifying tenants                    stability of distributions
   with site visits stopped and
   companies more cautious                         • ~$9.5 million of relief measures inclusive
                                                                                          (3)
                                                     of government property tax rebates

                 Note: Measures as at publication of 1Q 2020 results announcement on 22 April 2020.
                 (1) Subject to any further COVID-19 related measures that may be imposed by the Australian Government.                                 14
                 (2) This replaces earlier announced relief measures so as to provide tenants with more immediate assistance.
                 (3) Estimated property tax rebates from the Singapore Government amount to ~$8.2 million.
Committed to Delivering Stable Income & Sustainable Returns
   Portfolio Optimisation
• Portfolio optimisation to improve yield, while maintaining exposure to
  Singapore CBD                                                                          Portfolio
• Hold quality assets across different markets for improved income stability and        Optimisation
  to provide more long-term growth opportunities

    Asset Performance                                                                 Asset
                                                                                   Performance
• Drive individual asset performance with proactive leasing and cost management
  strategies
• Implement initiatives to future proof assets and enhance sustainability
                                                                                          Capital
                                                                                         Efficiency
     Capital Efficiency
• Optimise capital structure to reduce borrowing costs and improve returns
• Manage debt maturities and hedging profiles to reduce risk

                                                                                                 15
Additional
Information

One Raffles Quay,
Singapore

                    16
Milestones since Listing
                                                       Acquired
 Listed on                Increased       Acquired     87.5% of     Acquired 50% of David
    SGX                    Stake in        50% of        Ocean     Malcolm Justice Centre in          Acquired            Acquired 50% of      Expanded footprint to
 with over                Prudential      8 Chifley    Financial           Perth and             three retail units at   311 Spencer Street     South Korea with
                          Towers in       Square in    Centre in      8 Exhibition Street       8 Exhibition Street in     development in            99.4% of
$600m AUM                 Singapore        Sydney                        in Melbourne                Melbourne               Melbourne           T Tower in Seoul
                                                       Singapore

               2007                    2010                     2012                 2014                        2016                   2018                     2020

  2006                     2009                    2011                   2013                      2015                    2017                    2019         $7.9b(1)
                                                                                                                                                                  AUM

        Maiden                                                Increased stake   Divested        Acquired          Divested         Divested 20%       Divested
       Acquisition:                           Asset swap of     to 99.9% for     stake in      one-third of    77 King Street     minority stake in Bugis Junction
       One Raffles Expanded footprint to      Keppel Towers Ocean Financial     Prudential       MBFC            in Sydney        Ocean Financial     Towers in
        Quay in          Australia with      and GE Tower for     Centre in      Tower in      Tower 3 in                            Centre in        Singapore
       Singapore 77 King Street in Sydney      one-third of      Singapore      Singapore      Singapore                            Singapore
                    and 275 George Street in MBFC Phase 1 in
                           Brisbane             Singapore
  1)    Based on assets under management as at 31 March 2020.

                                                                                                                                                               17
Financial Performance
                                                                                          1Q 2020                  1Q 2019                     +/(-)
 Property Income                                                                           $38.7 m                 $40.0 m                   (3.3%)
 Net Property Income (NPI)                                                               $30.2 m(1)                $31.3 m                   (3.7%)
  Less: Attributable to Non-controlling Interests                                         ($4.3 m)                 ($4.1 m)                  +6.9%
  NPI Attributable to Unitholders                                                          $25.9 m                 $27.2 m                   (5.2%)
 Share of Results of Associates and Joint Ventures                                         $25.9 m                 $26.4 m                   (1.9%)

 Distribution to Unitholders                                                              $47.3 m(2)               $47.3 m(3)                 N.m.

 DPU (cents)                                                                                  1.40                    1.39                   +0.7%

    1Q 2020 Distribution Timetable          (1) NPI was lower due mainly to the divestment of Bugis Junction Towers in November 2019, offset by contribution
                                                from T Tower which was acquired in May 2019.
Ex-Date: Wed, 29 Apr 2020                   (2) Includes capital gains distribution of $5.0 million for 1Q 2020.
                                            (3) Includes capital gains distribution of $3.0 million for 1Q 2019.
Record Date: Thu, 30 Apr 2020
                                            N.m. = Not meaningful
Payment Date: Fri, 29 May 2020

                                                                                                                                                       18
Income Contribution
                                                                                                             1Q 2020           1Q 2019
                                                                                                                          %                 %
                                                                                                               $’000             $’000
  Breakdown by Geography
       (For 1Q 2020)                                 Ocean Financial Centre                                   17,159    30.0    16,129    26.0
                                                     Marina Bay Financial Centre                              19,127    33.5    22,266    35.9
 73.4%                                               One Raffles Quay                                          5,689     9.9     6,173     9.9
                                                     Bugis Junction Towers(1)                                      -       -     4,997     8.1
                                                     8 Chifley Square                                          3,368     5.9     3,084     5.0
                                                     8 Exhibition Street                                       2,858     5.0     3,454     5.6
                                       20.7%         275 George Street                                         2,457     4.3     2,674     4.3
                                                     David Malcolm Justice Centre                              3,166     5.5     3,203     5.2
                       5.9%
                                                     T Tower(2)                                                3,353     5.9         -         -
  Singapore       Australia     South Korea
                                                     Total                                                    57,177   100.0    61,980   100.0

(1) Bugis Junction Towers was divested on 29 November 2019.
(2) Reflects the amount attributable to Unitholders based on an interest of 99.4% acquired on 27 May 2019.

                                                                                                                                          19
Balance Sheet

                                                                                As at 31 Mar 2020                   As at 31 Dec 2019                   +/(-)

                                            (1)
         Deposited Property                                                            $8,013 m                             $8,032 m                   (0.2%)

         Total Assets                                                                  $7,437 m                             $7,449 m                   (0.2%)

         Borrowings(2)                                                                 $2,898 m                             $2,879 m                   +0.7%

         Total Liabilities                                                             $2,312 m                             $2,286 m                   +1.1%

         Unitholders’ Funds                                                            $4,545 m                             $4,585 m                   (0.9%)

         Adjusted NAV per Unit(3)                                                         $1.33                                $1.35                   (1.5%)

(1) Included interests in associates and joint ventures.
(2) Included borrowings accounted for at the level of associates and excluded the unamortised portion of upfront fees in relation to the borrowings.
(3) For 31 March 2020 and 31 December 2019, these excluded the distributions to be paid in May 2020 and paid in February 2020 respectively.

                                                                                                                                                                20
Singapore Office Market
▪ Average Grade A office rents registered slight decrease to $11.50 psf pm. Average occupancy in
  core CBD decreased to 95.4% in 1Q 2020
      Grade A Rent and Core CBD Occupancy                                         Demand and Supply
                                                                                             2.1      1.9                                          1.9
        94.8%      95.8%        93.8%      94.8%      95.8%      95.4%                                           1.7
$15                                                                        100%
                                                                                                                                    1.1
                                                                                                        0.8 0.8               0.7          0.8
                                                      $11.55     $11.50               0.4      0.4                      0.3
$12                                        $10.80                          80% 0.02                                                                         0.0      0.0
        $10.40
                   $9.10        $9.40
                                                                                   2015      2016     2017    2018       2019       2020   2021    2022     2023     2024
$9                                                                         60%
                                                                                                     Net Supply(1)     Net Demand (1) Forecast Supply (2)

$6                                                                         40%    Key Upcoming Supply in CBD(2)                                                            sf
                                                                                   Apr-Dec          Afro-Asia i-Mark                                               140,000
$3                                                                         20%      2020            79 Robinson Road                                               514,000
                                                                                                    CapitaSpring                                                   635,000
$0                                                                         0%         2021
       Dec-2015   Dec-2016     Dec-2017   Dec-2018   Dec-2019   Mar-2020                            Hub Synergy Point Redevelopment                                128,000
                                                                                                    Central Boulevard Towers                                      1,258,000
                                                                                      2022
                        Average Grade A Rent ($ psf pm)                                             Guoco Midtown                                                   650,000
                        Core CBD Average Occupancy (%)
                                                                                  (1) Based on URA data on historical net demand and supply of office space in Downtown
      Source: CBRE, 1Q 2020.                                                          Core and Rest of Central Area. Supply is calculated as net change of stock over the year
                                                                                      and may include office stock removed from market due to demolitions or change of use.
                                                                                  (2) Based on CBRE data on CBD Core and CBD Fringe.

                                                                                                                                                                                21
Australia Office Market
▪ National CBD office market occupancy decreased slightly quarter-on-quarter from 91.9% as at
  end September 2019 to 91.7% as at end December 2019

                                                         94.9%     96.0%    96.4%   95.9% 95.2%       95.2%                                                                    92.8%    92.1%   92.3%   93.2%      91.5%    100%
                                         91.8% 91.3%                                                          100%                                86.8%      86.0%    89.6%
                           1,200                                                                                                          1,200
                                                                   1,032    1,039   1,041   1,041     1,045   80%                                                                                                           80%
                                                            964
Sydney CBD                   900                  799                                                         60%    Brisbane CBD          900                                                                              60%
                                          679
                             600                                                                                                           600                                                                              40%
                                                                                                              40%                                      397    389       386     396      400     403      406         409
Prime Grade occupancy        300                                                                              20%    Prime Grade occupancy300                                                                               20%
was maintained at 95.2%                                                                                              was lower at 91.5%     0                                                                               0%
                                 0                                                                            0%
                                         4Q15     4Q16     4Q17     4Q18    1Q19    2Q19    3Q19      4Q19                                        4Q15       4Q16      4Q17     4Q18    1Q19    2Q19     3Q19      4Q19

                                                         Prime Gross Effective Rent (AUD psm/year)                                                                     Prime Gross Effective Rent (AUD psm/year)
                                                         Prime Grade Occupancy (%)                                                                                     Prime Grade Occupancy (%)

                                                                    97.0%    97.6% 97.5%    97.9%     98.2%
                                         90.1% 92.1%      94.0%                                                                                                               84.0%    84.7%    85.1%   85.6%      86.5%    100%
                                                                                                              100%                                       77.7%        81.4%
                             1,200                                                                            90%                        1,200 76.5%
                                                                                                              80%                                                                                                           80%

Melbourne CBD                    900
                                                                                                              70%
                                                                                                              60%
                                                                                                                     Perth CBD            900                                                                               60%
                                                                     538      539    544     563       573    50%                                 491
                                 600               448       503                                                                          600                431       435     447      447      447     447        453     40%
                                            406                                                               40%
Prime Grade occupancy            300
                                                                                                              30%    Prime Grade occupancy300                                                                               20%
                                                                                                              20%
rose to 98.2%                                                                                                 10%    rose to 86.5%
                                     0                                                                        0%                            0                                                                               0%
                                           4Q15    4Q16     4Q17     4Q18    1Q19   2Q19    3Q19      4Q19                                        4Q15       4Q16     4Q17     4Q18    1Q19     2Q19    3Q19       4Q19
                                                          Prime Gross Effective Rent (AUD psm/year)                                                                  Prime Gross Effective Rent (AUD psm/year)
                                                          Prime Grade Occupancy (%)                                                                                  Prime Grade Occupancy (%)

Source: JLL Research, 4Q 2019.

                                                                                                                                                                                                                 22
Seoul Office Market
    ▪ CBD Grade A occupancy improved from 85.1% as at end September 2019 to 90.0% as at
      end December 2019

          CBD Grade A Rent and Occupancy
200,000                                                                         90.0%    100%
          87.5%    84.9%     86.5%                                      85.1%
                                        82.7%     82.5%      84.5%

160,000                                                                                  80%

120,000                                                                                  60%
          95,618   95,164    91,704    92,148     91,665     89,514    88,623   91,484
 80,000                                                                                  40%

 40,000                                                                                  20%

     0                                                                                   0%
          4Q15     4Q16      4Q17       4Q18       1Q19      2Q19       3Q19    4Q19

                            CBD Grade A Net Effective Rent (KRW per py pm)

                            CBD Grade A Occupancy (%)

    Source: JLL Research, 4Q 2019.

                                                                                                23
Portfolio Information: Singapore
                                                                                           Marina Bay
                                               Ocean Financial Centre                                                     One Raffles Quay
                                                                                        Financial Centre(4)
                       Attributable NLA                            700,504 sf                         1,024,238 sf                        441,424 sf
                              Ownership                                 79.9%                               33.3%                              33.3%

                                                                BNP Paribas,                        DBS Bank,                       Deutsche Bank,
                     Principal   tenants(1)                            ANZ,           Standard Chartered Bank,                       Ernst & Young,
                                                               Drew & Napier                          Barclays                                 UBS

                                                                                                99 years expiring
                                                            99 years expiring                                                      99 years expiring
                                   Tenure                                                      10 Oct 2104(5) and
                                                                13 Dec 2110                                                            12 Jun 2100
                                                                                                    7 Mar 2106(6)
                        Purchase Price                                                               S$1,426.8m(5)
                                                               S$1,838.6m(3)                                                              S$941.5m
                        (on acquisition)                                                             S$1,248.0m(6)
                                                                                                     S$1,695.3m(5)
                             Valuation(2)                        S$2,099.8m                                                             S$1,254.3m
                                                                                                     S$1,297.0m(6)
                                                                                                3.63%(7); 4.50%(8);
                    Capitalisation rates                                3.50%                                                                  3.63%
                                                                                                           3.60%(6)

1) On committed gross rent basis.                                                                             5) Refers to MBFC Towers 1 and 2 and MBLM.
2) Valuation as at 31 December 2019 based on Keppel REIT’s interest in the respective properties.             6) Refers to MBFC Tower 3.
3) Based on Keppel REIT’s 79.9% of the historical purchase price.                                             7) Refers to MBFC Towers 1 and 2.
4) Comprises Marina Bay Financial Centre (MBFC) Towers 1, 2 and 3 and Marina Bay Link Mall (MBLM).            8) Refers to MBLM.

                                                                                                                                                           24
Portfolio Information: Australia & South Korea
                                                                                                                                      311 Spencer Street,
                         8 Chifley Square, 8 Exhibition Street,               275 George Street,           David Malcolm                                              T Tower,
                                                                                                                                          Melbourne
                             Sydney           Melbourne(3)                        Brisbane              Justice Centre, Perth                                          Seoul
                                                                                                                                       (Under development)
  Attributable NLA                 104,055 sf                 244,490 sf                   224,537 sf                 167,784 sf                 358,683 sf              226,945 sf
         Ownership                      50.0%                      50.0%                      50.0%                        50.0%                      50.0%                   99.4%
                           Corrs Chambers               Ernst & Young,         Telstra, Queensland                                                                       Hankook
                                                                                                           Minister for Works -
                                Westgarth,           Amazon, Minister                Gas Company,                                     Minister for Finance        Corporation, SK
Principal tenants(1)                                                                                           Government of
                                 Quantium,          for Finance - State                 The State of                                    - State of Victoria      Communications,
                                                                                                            Western Australia
                            QBE Insurance                    of Victoria              Queensland(6)                                                                 Philips Korea
                           99 years expiring                                                                  99 years expiring
              Tenure                                            Freehold                    Freehold                                               Freehold                Freehold
                                 5 Apr 2105                                                                       30 Aug 2114
    Purchase Price                 A$165.0m                  A$168.8m                      A$166.0m                   A$165.0m                   A$347.8m               KRW252.6b
    (on acquisition)               S$197.8m                 S$201.3m(3)                    S$209.4m                   S$208.1m                  S$362.4m(7)             S$292.0m(9)
                                   A$240.0m                  A$265.3m                      A$250.0m                   A$232.5m                   A$349.5m               KRW259.0b
         Valuation(2)
                                   S$222.2m                 S$245.6m(3)                    S$231.4m                   S$215.2m                  S$323.5m(8)              S$299.9m
Capitalisation rates                    4.75%        5.00%(4); 4.50%(5)                       5.00%                        5.38%                      4.50%                   4.50%

1) On committed gross rent basis.                                                           6) Refers to the Department of Housing and Public Works – The State of Queensland.
2) Valuation as at 31 December 2019 based on Keppel REIT’s interest in the respective       7) Based on the aggregate consideration paid-to-date and to be paid, including
  properties and on the exchange rates of A$1 = S$0.9257 and KRW 1,000 = S$1.158.              development costs of the building, at the exchange rate of A$1=S$1.042 as disclosed
3) Keppel REIT owns a 50% interest in the 8 Exhibition Street office building and a 100%      in the announcement dated 29 June 2017.
  interest in the three adjacent retail units.                                              8) Based on “as is” valuation as at 31 December 2019. Includes A$102m of development
4) Refers to Keppel REIT’s 50% interest in the office building.                               cost capitalised in 2019.
5) Refers to Keppel REIT’s 100% interest in the three adjacent retail units.                9) Based on Keppel REIT’s interest in T Tower and an exchange rate of KRW 1,000 to
                                                                                               S$1.156 used for payment.

                                                                                                                                                                              25
Keppel REIT Structure

             Keppel Capital                                   Keppel Land
                                                                                                                Institutional and
        The REIT Manager can leverage
                                                        The REIT Manager can leverage                            Public Investors
                                                          the Sponsor‘s expertise and
       the scale and resources of a larger                                                                             50.8%
          asset management platform
                                             5.5%         track record in this industry

                                                                                    43.7%
                           100%
                                                Management                                                                     Acting on behalf of
                                                  services                                                                         Unitholders
               REIT Manager                                                                                                                                   Trustee
                                                                                                                                    Trustee’s
                                               Management fees                            Keppel REIT                                 fees
               Keppel REIT                                                                                                                           RBC Investor Services Trust
            Management Limited                                                                                                                           Singapore Limited

                                                                       Ownership of                     Income
                                                                             assets                     contribution
                                                 Property
                                                management
                                                  services
           Property Managers                                                              Properties
                                                  Property
                                               management fees
Note: As of 31 March 2020.

                                                                                                                                                                          26
Thank You

8 Chifley Square,
Sydney

                    27
You can also read