CITYCON PRESENTATION Q3/2017

Page created by Bonnie Graves
 
CONTINUE READING
CITYCON PRESENTATION Q3/2017
19.10.2017

CITYCON PRESENTATION
      Q3/2017
CITYCON PRESENTATION Q3/2017
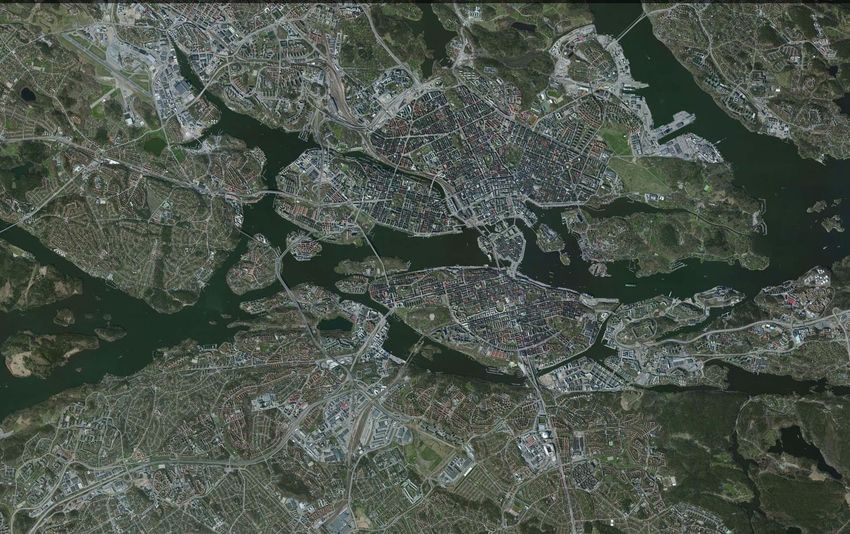
LEADING OWNER, MANAGER AND DEVELOPER OF
SHOPPING CENTRES IN THE NORDICS AND BALTICS

    –     49 shopping centres1)                                            –    200 million visitors p.a.
    –     13 managed/rented assets                                         –    Market cap close to EUR 2
    –     GLA 1.2 million sq.m.                                                 billion
                                                                           –
                                                                                                                                                FINLAND
                                                                                Credit ratings: Baa1 & BBB
    PORTFOLIO VALUE
                                  Estonia and
                                   Denmark                                                                       NORWAY         SWEDEN           18
                                      7%
                                                                                                                                                          2
                     Sweden1)                                                                                        18                     9
                                                                      Finland                                                                     ESTONIA
                        28%
                                             5                         36 %

                                         EUR billion

                                                                                                             DENMARK
                                                                                                                            2
                                         Norway
                                          29%
2       Key figures 30 September 2017   1) Including Kista Galleria                                            Number of shopping centres
CITYCON PRESENTATION Q3/2017
ENRICHING URBAN CROSSPOINTS

                RIGHT                              RESPONSIBLE SHOPPING
               ASSETS                               CENTRE MANAGEMENT
          Necessity-based                            Sustainable space
        shopping centres in                           for retailers and
        growing urban areas                             communities

                           WHAT                OUR
                           WE DO               APPROACH

        STRONG CAPITAL BASE                           RETAIL EXPERTS
                                      OUR
           Efficient capital       RESOURCES       Creating attractive
         allocation enabling                    retail locations that serve
      continuous development                      as enjoyable parts of
      of the property portfolio                  people’s everyday lives

3
CITYCON PRESENTATION Q3/2017
TRUE PAN-NORDIC LEADER
      340
                       140                125                  95                   90
                                                                                                     FINLAND
                      SPONDA               ELO                KEVA              IDEAPARK

      300               260
                                           210
                                                               155                 150                                                                                              #1
                                                                                                    SWEDEN
      ATRIUM         UNIBAIL-                             OLAV THON          STEEN &STROM
    LJUNGBERG       RODAMCO
      970                                                                                                                                        #2                    #3                #2
                        340               205                  140                  95              NORWAY
     OLAV                           STEEN & STROM            SALTO               SCALA
     THON

       145
                              100                       80
                                                                         ESTONIA
      ASTRI                                          LINSTOW

                                    Source: Company reports, Pangea Property Partners analysis, as per April 2017 and Finnish Shopping Centres 2017. Includes only majority-owned
4    Retail GLA (thousand sq.m.)
                                     shopping centres. Includes some assumptions on retail proportion out of total GLA, where retail data not available.
CITYCON PRESENTATION Q3/2017
URBAN CROSSPOINTS
DRIVEN BY STRONG DEMOGRAPHICS

                                CORE ASSETS:
                                – Urban
                                  environments,
                                  located where
                                  people live and work
                                – Strong population
                                  growth and natural
                                  footfall
                                – Integrated with
                                  public
                                  transportation
                                – Shared access to
                                  education, health
                                  care, culture,
                                  municipal services
5
CITYCON PRESENTATION Q3/2017
STRONG GROCERY-ANCHORING
    ‒ OVER 100 GROCERY STORES 1)
                                                 2% 1%

                                          9%
                                                                24%

                       9%                                               Home and leisure
                                                                        Fashion
                                                Rental income           Groceries
                                                                        Services and offices

               13%
                                                 269                    Health and beauty
                                                                        Cafés and restaurants
                                                   MEUR                 Specialty stores
                                                                        Department stores

                                                                  24%

                                          18%

    As per 31 December 2016
6
    1) Including   Kista Galleria (50%)
CITYCON PRESENTATION Q3/2017
90% OF CITYCON’S SHOPPING CENTRES ARE LOCATED IN CAPITAL
            OR MAIN CITIES

                ISO OMENA,                         KISTA GALLERIA,    LILJEHOLMSTORGET      KOSKIKESKUS,   HERKULES,
                HELSINKI AREA       1)               STOCKHOLM   2)
                                                                      GALLERIA, STOCKHOLM      TAMPERE       SKIEN

GLA, sq.m.         101,000                             92,500               40,500             33,100       49,300
Visitors,
million               9                                  19                   10                  6           3
Sales,
MEUR                   195                              204                  158                111           121
                Note: Figures are for 2016
                1) GLA updated as per April 2017
            7   2) Kista Galleria (100%)
CITYCON PRESENTATION Q3/2017
SUSTAINABLE
    SHOPPING CENTRE MANAGEMENT

                  Acting as a sustainable business partner

               People                                   Environment
          An excellent place                         Energy-efficient and
          to work and to be          OUR APPROACH   environmentally sound
              proud of                                shopping centres

                                               SOLID
           Community &                        ECONOMY      Economy
          Companionship                                 Creating long-term
         Urban multifunctional                          shareholder value
      shopping centres with strong
         ties to the community
          Offering sustainable
       customer flows to tenants
8
CITYCON PRESENTATION Q3/2017
FORERUNNER IN SUSTAINABILITY                                               KEY INITIATIVES 2017
                                                                     – Energy consumption,

Largest shopping centre portfolio with BREEAM In-Use certification
                                                                       kWh/sq.m.                 -6%since 2014
                                                                                               (target -10% by 2020)
in the Nordic countries                                              – Within top 5% of
                                                                       globally reviewed
                                                                       companies

                                     76%
                                                    >80%             – Citycon’s Buskerud unique in using
                                                                       CO2 instead of freon as a refigrerant,
                                                                       cooling the entire shopping centre
                                                                     – Finland's first pop-up shopping centre,
                      49%                                              Pikkulaiva from recyclable modules
                                                                     – Iso Omena to have the largest solar
                                                                       power plant realised in a Finnish retail
                                                                       property
                                                                     – Jakobsbergs Centrum shifted to
                                                                       geothermal heating & cooling reducing
        0%                                                             the overall energy consumption by up
                                                                       to 65%
     Dec. 2014      Dec. 2015      Q3/2017       Target 2017

9
CITYCON PRESENTATION Q3/2017
Q3/2017: GOOD OPERATIONAL RESULTS IN SWEDEN AND
NORWAY
HIGHLIGHTS Q3/2017
    4.7% INCREASE IN EPRA EPS TO EUR 0.133
    -   Overall net rental income growth and lower administrative expenses
    -   Completed (re)development projects support earnings growth (e.g. Iso Omena and Myyrmanni)

    POSITIVE LIKE-FOR-LIKE NET RENTAL INCOME
    -   LFL NRI +1.1% including Kista Galleria (50%)
    -   Strong performance in Sweden and Norway compensates for weaker Finland

    ACCELERATED CAPITAL RECYCLING
    -   Divestment of 8 properties, including building rights for approx. MEUR 140
    -   Additional committed divestments include 5 shopping centres in Finland and 1 in Norway for approx. MEUR 190
    -   Divestments will reduce LTV to approx. 45-46% in Q4

    SUCCESSFUL PLACEMENT OF NOK 1,000 MILLION BOND
    -   8-year maturity with a 2.75% fixed annual interest

    GUIDANCE MAINTAINED
    - EPRA EPS EUR 0.165-0.175, including the forthcoming Q4 disposals

3
FINANCIAL HIGHLIGHTS

    MEUR                                          Q3/2017    %1)

    Net rental income                                174.6   3.3

    Direct operating profit                          154.7   4.1

    EPRA Earnings                                    118.5   4.7

    EPRA EPS (basic)                                 0.133   4.7

    EPRA NAV per share                                2.78   -1.8

    Fair value change                                -32.3      -

    Loan to Value (LTV), %                            47.5   2.7

    1) Change   from previous year (Q1-Q3/2016)
4
STRONG LIKE-FOR-LIKE NRI GROWTH IN SWEDEN AND NORWAY
COMPENSATES FOR WEAKER FINLAND
OVERALL LIKE-FOR-LIKE NRI GROWTH 1.1%

LIKE-FOR-LIKE NET RENTAL INCOME GROWTH 1)                                                                          – Strong shopping centres in the
                                      7.2%                                                                           Helsinki metropolitan area (Iso
                                                                                                                     Omena, Myyrmanni, Lippulaiva) all
                     4.7%                                                                                            out of the like-for-like portfolio
                                                                                                                     due to (re)development projects
                                                                  1.3%                               1.1%          – Like-for-like portfolio in Finland
                                                                                                                     represents 29% of the total value
                                                                                                                     of the Finnish portfolio
                                                       -0.9%
                                                                                   -1.3%

    -6.5%

    Finland        Norway          Sweden          Estonia &      Total       Kista Galleria      Adjusted
                                                   Denmark                                         total*

       The width of each column refers to the weight           1)IncludingKista Galleria 50%. The adjusted total
6      of the business unit in Citycon's portfolio.              including Kista Galleria 100% would be 0.9%.
OVERALL SALES +3%, FOOTFALL +1%
LFL SALES AND FOOTFALL SLIGHTLY DOWN

LIKE-FOR-LIKE SALES                                                                                  LIKE-FOR-LIKE FOOTFALL
Q1–Q3/2017 vs. Q1–Q3/2016, % 1)                                                                      Q1–Q3/2017 vs. Q1–Q3/2016, % 1)
                  0%        0%

                                                                             -1%                                                        -1%

                                                                                                                                                            -2%

     -3%                                                                                                     -3%               -3%

                                                        -5%                                                                                       -5%

    Finland         Norway            Sweden          Estonia &             Total                         Finland             Norway   Sweden   Estonia &   Total
                                                      Denmark                                                                                   Denmark

      The width of each column refers to the weight           1)   Including Kista Galleria 50%. Sales and footfall figures
7     of the business unit in Citycon's portfolio.                 include estimates. Sales figures exclude VAT.
OCCUPANCY REMAINED STABLE
OCCUPANCY RATE 1)

                                                96.9%
                                        96.5%           96.3%    96.3%     96.2%
             96.0%

             2013                       2014    2015    2016    H1/2017   Q3/2017

8   1) Including   Kista Galleria 50%
SIGNED LETTER OF INTENT ON 31 AUGUST TO DEVELOP
‘GLOBEN SHOPPING’ TOGETHER WITH KLÖVERN

                                                   – Joint venture to acquire and
                                                     develop the shopping
                                                     centre part of the property
              GLOBEN                                 Arenan 2
              ARENA
                                   TELE2 ARENA     – Development plan is to
                                                     double the size of the
                                                     current 20,000 sq.m.
                                                     shopping centre
                                                   – Ownership Citycon 55% and
                                                     Klövern 45%
                                                   – Total investment of approx.
                                                     EUR 260-290 million
                                                   – Timeline approx. 2022-
                                                     2023
                                       NEW HOTEL

                           METRO
                                                   METRO
9
STOCKHOLM AREA

                                              Stockholm
                                              CBD

                            12 min by metro to
     Liljeholmstorget       the central station

                                                    Globen
10
         Fruängen Centrum
MEUR 167 DIVESTMENT OF A PORTFOLIO OF NON-CORE ASSETS
IN FINLAND

CLOSED AND COMMITTED DIVESTMENTS IN 2017              –   Signed agreement on 24 August to divest a portfolio
                                                          of 5 non-core properties in Finland:
                             Assets     Value, MEUR       –   Espoontori
                                                          –   Tikkuri
Finland                            9          237
                                                          –   Myllypuron Ostari
Norway                             3           54
                                                          –   Martinlaakson Ostari
Sweden            1 + building rights          37         –   Jyväskylän Forum

Total                            13           328

11
DEVELOPMENT PORTFOLIO
URBAN DEVELOPMENTS PROGRESSING
ONGOING PROJECTS
                                                                                         Expected                Cumulative
                                                            Area before/                                                             Yield on cost1),      Pre-leasing,   Completion
                                 City                                                 investment,               investment,
                                                             after, sq.m.                                                                         %                  %        target
                                                                                            MEUR                      MEUR

1 Mölndal Galleria               Gothenburg                      - /24,000             60.0 (120.0)                       40.8                      ~6.5            70      Q3/2018

                                 Helsinki
2 Lippulaiva                     metropolitan             19,200/44,300                        215.0                      44.0                      ~6.5            55         2021
                                 area

1) Expected   stabilised yield (3rd year after completion). Calculated on total development costs, also including financing and Citycon internal costs.

                                                                                                  1                                                                                    2

13
ISO OMENA HAS BECOME THE LEADING SHOPPING AND LEISURE
   DESTINATION IN THE HELSINKI METROPOLITAN AREA

– Successful second phase
  opening 20 April 2017
– Strong and international
  tenant mix, 98% leased
– Strong operational
  performance since opening:
        –   Footfall +25%
        –   Customers by car +40%
        –   Total turnover +37%
        –   Turnover of existing
            tenants +13%

– Metro opening expected in
  November
– 4,500 sq.m. Dudesons
  Activity Park opened

   14
DEVELOPMENT PIPELINE
DEVELOPMENT PIPELINE –
URBAN LOCATIONS IN CAPITAL CITIES
                                           Area before/       Expected         Target   – Development investments of
                                 City             after,   investment,    initiation/     MEUR 150-200 p.a. sourced
                                                  sq.m.          MEUR    completion
                                                                                          through capital recycling
COMMITTED
Down Town                   Porsgrunn    38,000/46,000             80    2018/2020

PLANNED (UNCOMMITTED)
Tumba Centrum               Stockholm    23,100/30,500             40    2018/2020

Kista Galleria              Stockholm   92,500/105,000            801)   2020/2023

Oasen                         Bergen     56,800/68,800            100    2019/2022

Liljeholmstorget Galleria   Stockholm    40,500/64,500            100    2020/2023

Trekanten                        Oslo    23,800/45,000            135    2019/2022
                                                                                        1) Citycon’s   share MEUR 40 (50%)

16
CLEAR POSITIONING

     URBAN
 CONVENIENCE
IN THE HEART OF
 COMMUNITIES
FOOD AND NECESSITY-BASED
                                                2% 1%
                                           9%
                                                        24%
                                                                HOME AND LEISURE
                                      9%
                                                                FASHION

                                                                GROCERIES

                                                                SERVICES AND OFFICES

                                13%                             HEALTH AND BEAUTY

                                                                CAFÉS AND RESTAURANTS

                                                                SPECIALTY STORES

                                                          24%   DEPARTMENT STORES

                                           18%
INCLUDING KISTA GALLERIA 50%
PUBLIC SERVICES ARE OUR NEW ANCHORS
     ISO OMENA          LILJEHOLMSTORGET    KISTA GALLERIA
PUBLIC SERVICE SQUARE       HEALTHCARE          LIBRARY

      1.500.000              800.000           700.000
   ANNUAL VISITORS        ANNUAL VISITORS   ANNUAL VISITORS
DUDESON’S ACTIVITY PARK
 OPENED IN ISO OMENA
DAILY CONVENIENCE & ENTERTAINMENT

                                                         9%                     CAFÉS AND RESTAURANTS

                                                                                SERVICES AND OFFICES
                                         24%                  13%               GROCERIES

                                                                                HEALTH AND BEAUTY

                                                                                HOME AND LEISURE
                                                               18%

                                                                           T
                                                                                FASHION

                                                                           EN
                                          24%                                   SPECIALTY STORES

                                                                       ILI
                                                         9%

                                                                ES
                                                                                DEPARTMENT STORES
                                         20                            R
                                              17:              N   E
                                                    6 0 % ONLI

INCLUDING KISTA GALLERIA 50%
KEY TARGET AREAS 2017 AND ONWARDS
     FURTHER CAPITAL RECYCLING
     - Closing of committed divestments in 2017 (total approx. MEUR 330)
     - Continue to improve the quality of the portfolio by recycling approx. 5-10% of the total
       property portfolio within 3 to 5 years
     - MEUR 150-200 p.a. developments within the existing portfolio with an average YoC of 150
       bps over yield requirement
     - Selective acquisitions

     LONG-TERM LFL NRI GROWTH OF 100 BPS ABOVE INFLATION
     - Following completion of divestment plan

     LOAN TO VALUE TARGET 40-45%
     - Recycling of capital
     - Selective joint venture opportunities

17
FINANCIAL OVERVIEW
FINANCIAL RESULTS

    MEUR                                Q3/2017        Q3/2016               %         Q3/2017
                                                                                   INCL. KISTA 50%

    Gross rental income                     195.3           187.3            4.3            207.8

    Net rental income                       174.6           169.0            3.3            185.7

    Direct operating profit                 154.7           148.6            4.1            165.4

    EPRA Earnings                           118.5           113.2            4.7               n.a.

    EPRA EPS (basic)                        0.133           0.127            4.7               n.a.

    EPRA NAV per share                       2.78            2.83           -1.8               n.a.

    – EPRA EPS increased due to higher net rental income and lower direct administrative
      expenses
    – Kista Galleria contributed to the IFRS-based profit for the period by approx. MEUR 3.2
      in Q3/2017

3
(RE)DEVELOPMENT PROJECTS COMING ONLINE SUPPORTED NET
RENTAL INCOME GROWTH
    NRI DEVELOPMENT
    MEUR

                                           5.0

                                                                          1.5                 0.4               174.6
                          3.3
                                                           -4.6
           169.0

      Q1-Q3/2016      Acquisitions   (Re)development   Divestments   LFL properties   Other (incl. exchange   Q1-Q3/2017
                                         projects                                       rate differences)

4
INCREASED AVERAGE RENT,
    OCCUPANCY AT A GOOD LEVEL
                                                                    Q3/2017           Q3/2016

    Occupancy rate (economic)                            %               96.2               96.1

    Average rent                                  EUR/sq.m.              23.4               23.1

    Average remaining length of lease portfolio       years               3.4                3.4

                                                                 Q1-Q3/2017         Q1-Q3/2016
    Average rent of leases started                EUR/sq.m.              23.3               23.2

    Average rent of leases ended                  EUR/sq.m.              22.8               21.6

    Leasing spread of renewals and re-lettings           %                -4.1              -5.4

    – Q1-Q3/2017 leasing spread improved, still negative mainly due to challenging retail
      environment in Finland and increased competition in Estonia

    All figures including Kista Galleria 50%
5
INTERNAL Q3 VALUATION BASED ON CBRE
    ADVISORY
    FAIR VALUE CHANGES, MEUR                                Q3/2017              Q3/2016         Q1-Q3/2017      Q1-Q3/2016

       Finland                                                    -21.2                  0.3             -36.3          -14.9

       Norway                                                     -12.3                  0.5             -11.5          24.8

       Sweden                                                      10.7                  7.4             18.9           29.2

       Estonia & Denmark                                            -1.1                 -0.9             -3.3           -0.7

    Investment properties, total                                  -23.9                  7.4             -32.3          38.4

       Kista Galleria (50%)                                          0.0                 0.1              0.5            2.1

    Investment properties and Kista Galleria (50%),
                                                                  -23.9                  7.6             -31.8          40.5
    total

    WEIGHTED AVERAGE YIELD REQUIREMENT, %                                  30 SEP 2017          30 SEP 2016      31 DEC 2016

    Investment properties and Kista Galleria (50%), average                        5.3                  5.5              5.4

6   Note: Kista Galleria and development properties externally valued by CBRE
INCOME STATEMENT
MEUR                                        Q3/2017    Q3/2016       %    Q1-Q3/2017    Q1-Q3/2016
Gross rental income                            63.8       61.9     3.1         195.3         187.3

Service charge income                          19.0       19.2     -1.0         58.9          59.4
Property operating expenses                    -23.9      -23.8    0.3          -78.3         -76.7

Other expenses from leasing operations          -0.4       -0.6   -36.0          -1.3          -1.1

Net rental income                              58.6       56.8     3.3         174.6         169.0

Administrative expenses                         -7.1       -7.2    -0.4         -20.9         -21.9

Other operating income and expenses             -2.6       0.6        -          -4.6          1.5
Net fair value gains/losses on investment
                                               -23.9       7.4        -         -32.3         38.4
property
Net gains on sale of investment property        0.4        0.8    -47.7          9.8           4.3

Operating profit                               25.4       58.4    -56.5        126.6         191.3

Net financial income and expenses              -13.2      -18.2   -27.2         -42.8         -44.7

Share of profit/loss of joint ventures          0.0        0.9    -96.3          -1.3          4.7

Profit/loss before taxes                       12.2       41.1    -70.3         82.4         151.3

Profit/loss for the period                      5.5       31.8    -82.7         64.7         127.0

7
STABLE EPRA NAV
CHANGE OF NET ASSET VALUE (EPRA NAV)
EUR, per share
                              0.13

                                              -0.06
        2.82
                                                                  -0.04
                                                                                                        0.02            2.78
                                                                                       -0.10

      Q4/2016             EPRA Earnings   Indirect result   Translation reserve Dividends and equity    Other          Q3/2017
                                                                                     return paid

                                                                                30 SEP 2017            30 SEP 2016        31 DEC 2016
EPRA NAV per share, EUR                                                                   2.78                  2.83             2.82
EPRA NNNAV per share, EUR                                                                 2.41                  2.42             2.47

8
BALANCE SHEET

MEUR                                         30 SEP 2017    30 SEP 2016    31 DEC 2016

Investment properties                             4,184.2        4,354.8        4,337.6

Total non-current assets                          4,607.4        4,771.0        4,762.8

Investment properties held for sale                206.6           22.1           81.9

Total current assets                                43.2           73.3           56.2

Total assets                                      4,857.2        4,866.3        4,900.9

Total shareholders’ equity                        2,254.5        2,316.2        2,312.3

Total liabilities                                 2,602.7        2,550.1        2,588.7

Total liabilities and shareholders’ equity        4,857.2        4,866.3        4,900.9

9
FINANCING OVERVIEW
MAIN FINANCING TARGETS
– Loan to Value 40-45%                         -   47.5%
– Average maturity of loan portfolio > 5 yrs   ✓ 5.2
– Debt portfolio's hedge ratio 70-90%          ✓ 90%
– Strong investment-grade credit ratings       ✓ BBB/Baa1
– Financing mainly unsecured                   ✓ 95%
– Substantial liquidity buffer                 ✓ MEUR 557
    Conservative business model matched
      by conservative financing targets
CITYCON ISSUED A NOK 1,000 MILLION BOND
WITH 2.75% COUPON AND 8 YEAR MATURITY

                                                                   Insurance
KEY TERMS                                               Asset         7%
                                                       Manager
Bond rating:        Baa1 (Moody’s), BBB (S&P)           11%

Status:                     Senior, Unsecured
                                                                      Investor
Settlement date:          22 September 2017
                                                                     allocation
Maturity:                             8-years

                                                                                          Pension
Amount:                     NOK 1,000 million
                                                                                           82%

Maturity date:            22 September 2025

                                                – Since the Citycon’s inaugural dual tranche NOK bond
Coupon:                               2.750%
                                                  issues in 2015 Citycon decided to return to the NOK
                                                  market to balance its finance needs with another NOK
Listing:                  Oslo Stock Exchange     bond in September 2017

12
FORTHCOMING DIVESTMENTS WILL REDUCE LTV CLOSE TO
45-46% IN Q4

WEIGHTED AVERAGE INTEREST RATE                         LOAN TO VALUE (LTV)

     4.25%                                                54.5%
             4.12%
                                                                   49.3%
                                                                                             46.6%    47.5%
                                                                                     45.7%
                     3.28%
                             3.04%
                                     2.86%                                   38.6%
                                              2.69%

     2012    2013    2014    2015    2016    Q3/2017       2012     2013     2014    2015    2016    Q3/2017

13
FINANCING KEY FIGURES

                                                                           30 SEP 2017    30 SEP 2016    31 DEC 2016

Interest bearing debt, fair value                                  MEUR         2,216.8        2,156.4        2,191.5

Available liquidity                                                MEUR          557.5          583.3          560.4

Average loan maturity                                              years            5.2            5.8            5.6

Interest rate hedging ratio                                           %           89.9           94.8           93.1

Weighted average interest rate1)                                      %           2.69           2.90           2.86

Loan to Value (LTV)                                                   %           47.5           46.2           46.6

Financial covenant: Equity ratio (> 32.5%)                            %           46.5           47.7           47.3

Financial covenant: Interest cover ratio (> 1.8)                      %             3.7            3.9            3.8

14   1) Including   cross-currency swaps and interest rate swaps
90% OF DEBT FIXED RATE, VAST MAJORITY BONDS

      DEBT BREAKDOWN BY TYPE                DEBT BREAKDOWN BY CURRENCY
           Bank term loan Other
                 5%        0%
      CP                                        SEK
     10%                                        19%

                                                                     EUR
                                                                     52%

                2,216.8           Bonds
                                   85%
                                                      2,216.8
                   EUR million                         EUR million

                                          NOK
                                          29%
                                                                           Part of EUR debt has
                                                                           been converted to SEK
                                                                           and NOK using cross-
                                                                           currency swaps

15
BALANCED MATURITY PROFILE WITH LONG
AVERAGE LOAN MATURITY
DEBT MATURITIES

                                                   500        500
500
450
400
                                                                                                    350                  350
350
                                                                              300
300
                                                                                                              255
250                                                        239
                    216
200
150                                                              133
                                                                       106
100
 50      6                                                                   32

     0
             2017         2018      2019        2020          2021        2022         2023      2024       2025       2026    2027

                                 Loans     Floating to fixed swaps     Undrawn loan facilities   Bonds    Commercial Paper

16
OUTLOOK 2017
DIRECT OPERATING PROFIT                                        EPRA EARNINGS

220                                              197.5-207.5   170
                                                                                                               147.1-156.1
200                                   198.5                                                            151.1
                                                               150
180                          175.4                                                          130.8
                                                               130
160                                                                                           0
        149.1        149.8     0
                                                               110
140       0                                                                       99.7
                      0                                         90     86.7        0
120
                                                                70      0
100

 80                                                             50

 60                                                             30
        2013         2014    2015      2016        2017E               2013       2014      2015       2016          2017E

– Direct operating profit      MEUR -1 to 9                    – Based on exisiting property portfolio and already
– EPRA Earnings                MEUR -4 to 5                      committed divestments, which are expected to be
                                                                 closed by the end of 2017
– EPRA EPS (basic)             EUR 0.165-0.175
17
PROPERTY PORTFOLIO
OCCUPANCY BY COUNTRY1)

                                                                                                 99.3% 99.5%
                                            98.4% 98.7% 98.7%                                                  98.2%
                                                                           97.6%
                                                                   97.1%
                                                                                    96.4%                              96.1% 96.3% 96.2%

                        93.3%
     92.7% 92.8%

            Finland                              Norway                    Sweden                 Estonia & Denmark          Total
                                                                Q3/2016     Q4/2016         Q3/2017

        1) Including Kista Galleria (50%)
11
LEASE PORTFOLIO
AVERAGE LEASE MATURITY 1)
                                                                    – 4,773 lease agreements with an average length of 3.4 years
Years
                                                                    – Total GLA 1,243,840 sq.m. 1)
         3.5
                                                            3.4     – Rents linked to CPI (nearly all agreements)
                                                   3.3
                            3.2             3.2                     – Annualised potential rental value for the portfolio is EUR
                                                                      351.8 million 1)
                                                                    – Actual rental contract level vs. valuation market rents is
                                                                      -0.5%1)
                                                                         – Indicates how much higher/lower Citycon’s actual rental level is
                                                                           compared to the market rents applied in the external valuations

        2013              2014              2015   2016   Q3/2017

12      1) Including Kista Galleria (50%)
PROPERTY PORTFOLIO

                      TOP 4 TENANTS                                                 OCCUPANCY COST RATIO 1)
                                                                               SHOPPING CENTRES, ROLLING 12 MONTHS

                                              PROPORTION OF
2016
                                            RENTAL INCOME, %               Total                                 9.1%

Kesko                                                    6.6             Finland                                      9.5%

S Group                                                  4.5             Norway                                 8.7%

Varner-Group                                             4.4             Sweden                                8.2%

NorgesGruppen Group                                      2.2
                                                               Estonia & Denmark                                              11.7%

Top 4, total                                            17.7                       0%   2%   4%     6%    8%     10%         12%   14%

13      1) Including Kista Galleria (50%)
VALUATION YIELD DEVELOPMENT
                                                       VALUATION YIELD DEVELOPMENT 1)

     8%

     7%

     6%

     5%
                        Q3/2011          Q3/2012        Q3/2013       Q3/2014         Q3/2015       Q3/2016   Q3/2017

                                             Finland     Norway     Sweden      Estonia & Denmark   Total

          1)   Excludes Kista Galleria
14
BACK-UP INFORMATION
OWNERSHIP, 30 SEPTEMBER 2017
     – Established and listed on Nasdaq                  SHAREHOLDERS
                                                       30 SEPTEMBER 2017
       Helsinki in 1988                          Direct

     – Market cap EUR 1,981 million
                                               registered
                                                 16.4%
                                                                           Nominee-
     – Total registered shareholders 13,451                                registered
                                                                             83.6%
     – Largest shareholders:
         –   Gazit-Globe 44%
         –   CPPIB 15%
         –   Ilmarinen 7%
         –   Alecta 5%
     – Included in e.g. FTSE EPRA/NAREIT Global Real Estate Index, Global Real
       Estate Sustainability Benchmark Survey Index, iBoxx BBB Financial Index
       (EUR 500 million bond)

16
HISTORY OF CITYCON
+25 YEARS OF RETAIL EXPERIENCE AND NORDIC EXPANSION

 From Finnish office assets                   To international retail premises                 To a true Pan-Nordic leader

     1988                                      2003                                             2011
     ▪   Founded by Sampo Pension Ltd,         ▪   Strategy to include also (re)development     ▪   New management and redefined strategy
         Imatran Voima Oy, Rakennustoimisto        of assets
                                                                                                2013
         A. Puolimatka Oy and Postipankki      ▪   Ownership base internationalised
                                                                                                ▪   Acquisition of Kista Galleria in Stockholm
     ▪   Listed on Helsinki Stock Exchange
                                               2005                                                 in JV with CPPIB
     ▪   Office assets
                                               ▪   International expansion starts: first        ▪   Investment-grade credit ratings by S&P
     1998                                          acquisitions in Sweden and Estonia               and Moody’s
     ▪   Focus shifted to retail properties    2007                                             2014
     1999                                      ▪   Acquisition of Iso Omena in Helsinki area    ▪   CPPIB becomes strategic shareholder,
     ▪   Finland's leading listed property                                                          15% ownership
         investment company specialising                                                        2015
         in retail premises
                                                                                                ▪   Acquisition of Norwegian Sektor Gruppen
                                                                                                    for EUR 1.5 billion
17
ATTRACTIVE TENANT MIX OF
NORDIC AND INTERNATIONAL BRANDS

 GROCERIES &               CAFÉS &     LEISURE &   HOME &   HEALTH, BEAUTY
               FASHION
 DAILY NEEDS             RESTAURANTS     SPORT     DESIGN     & SERVICES

18
DEMONSTRATED ACCESS TO BOND MARKETS

OUTSTANDING BONDS

                    Issued amount,        Interest,   Maturity,
Bond                                                              Issue date   Maturity
                            million            p.a.      years

NOK bond                NOK 1,000             2.75           8       9/2017     9/2025

Eurobond                   EUR 350           1.25%          10       9/2016     9/2026

Eurobond                   EUR 300          2.375%           7     19/2015      9/2022

NOK bond                NOK 1,400             3.9%          10       9/2015     9/2025

                                      3-mth Nibor +
NOK bond                NOK 1,250                           5.5      9/2015     3/2021
                                           155 bps

Eurobond                   EUR 350           2.50%          10     10/2014     10/2024

Eurobond                   EUR 500           3.75%           7       6/2013     6/2020

19
ECONOMIC OUTLOOK
                                                                             INFLATION
GDP GROWTH
                                                                             4% Change %
5% Change %
4%
3%                                                                           2%
2%
1%
                                                                             0%
0%                                                                                  Finland       Norway   Sweden    Denmark      Estonia   Euro area
       Finland       Norway   Sweden         Denmark   Estonia   Euro area                         2015 2016 2017E   2018E
                      2015 2016 2017E        2018E

UNEMPLOYMENT                                                                 PUBLIC SECTOR DEBT AS % OF GDP
                                                                             Change %
Change %

10%                                                                          60%

                                                                             40%
 5%
                                                                             20%

 0%                                                                           0%
           Finland   Norway   Sweden         Denmark   Estonia   Euro area              Finland      Norway      Sweden        Denmark      Estonia
                     2015 2016 2017E         2018E                                                2015 2016   2017E 2018E
20    Source: SEB Nordic Outlook September 2017
DISCLAIMER
This document and the information contained herein is being provided solely for information. Neither this document nor the information contained herein may be reproduced, further distributed or
published, in whole or in part, for any purpose.

This document does not constitute an offer or solicitation of an offer to buy securities anywhere in the world. No securities of Citycon Oyj (the “Company”) have been or will be registered under the U.S.
Securities Act of 1933, as amended (the “U.S. Securities Act”). Certain ordinary shares of the Company have been offered to “qualified institutional buyers” (as such term is defined in Rule 144A (“Rule 144A”))
under the U.S. Securities Act, in transactions not involving a public offering within the meaning of the U.S. Securities Act. Accordingly, such shares are “restricted securities” within the meaning of Rule 144 and
may not be resold or transferred in the United States, absent an exemption from SEC registration or an effective registration statement. There will be no public offering of the securities in the United States.

Subject to certain exceptions, neither this document nor any part or copy of it may be taken or transmitted into the United States or distributed, directly or indirectly, in the United States, or to any “U.S.
Person” as that term is defined in Regulation S under the U.S. Securities Act. Neither this document nor any part or copy of it may be taken or transmitted into Australia, Canada or Japan, or distributed
directly or indirectly in Canada, or distributed or redistributed in Japan or to any resident thereof. Any failure to comply with this restriction may constitute a violation of U.S., Australian, Canadian or Japanese
securities laws, as applicable. Transmission or distribution of this document in any other jurisdiction may also be restricted by law, and persons into whose possession this document comes should inform
themselves about, and observe, any applicable restrictions.

This document is not intended for potential investors and does not constitute or form part of any offer to sell or issue, or invitation to purchase or subscribe for, or any solicitation of any offer to purchase or
subscribe for, any securities of the Company, nor shall it or any part of it or the fact of its distribution form the basis of, or be relied on in connection with, any contract or investment decision.

No representation or warranty, express or implied, is made or given by or on behalf of the Company, or any of their respective members, directors, officers or employees or any other person as to, and no
reliance should be placed upon, the accuracy, completeness or fairness of the information or opinions contained in this document or otherwise in connection therewith. None of the Company or any of their
respective members, directors, officers or employees or any other person accepts any liability whatsoever for any loss howsoever arising from any use of this document or its contents or otherwise arising in
connection therewith.

This document includes forward-looking statements. The words “believe,” “expect,” “anticipate,” “intend,” “may,” “plan,” “estimate,” “will,” “should,” “could,” “aim,” “target,” “might,” or, in each case, their
negative, or similar expressions identify certain of these forward-looking statements. Others can be identified from the context in which the statements are made. By their nature forward-looking statements
are subject to numerous assumptions, risks and uncertainties. Although the Company believes that the expectations reflected in these forward-looking statements are reasonable, actual results may differ
materially from those expressed or implied by the forward-looking statements. The Company cautions the recipients of this document and the recipients of the information contained herein or in connection
therewith not to place undue reliance on the statements.

The information contained in this document and in connection therewith is provided as at the date of this document and is subject to change without notice. Such information has not been independently
verified.

By attending the oral presentation of this document you agree to be bound by the foregoing limitations.
citycon.com

 CONTACT INFORMATION

        Eero Sihvonen

THANK YOU.
        CFO, Exec. VP
   Tel. +358 50 557 9137
You can also read