Investor presentation - FY21 results - Irongate
←
→
Page content transcription
If your browser does not render page correctly, please read the page content below

Investor
presentation
FY21 results

                 Sydney Level 13, 95 Pitt Street NSW 2000    Melbourne Brisbane
Irongate Group   +61 2 7906 2000 info@irongategroup.com.au   irongategroup.com.au
01 —
Overview

Achievements
                                                                                                                                           — Successful internalisation
                                                                                                                                             of management
Strong result after transformational year
                                                                                                                                           — Rebranded to Irongate
                                                                                                                                             Group
                                                                                                                                           — Deployed A$73.5m of the
                                                                                                                                             TAP Fund commitments5
        Financial                                        Property                                        Capital
          result                                         portfolio1                                    management                          — NTA increased from
                                                                                                                                             A$1.32 per security to
                                                                                                                                             A$1.43 per security
      A$1.43                                      A$1.237b                                                27.8%                            — Acquisition of four
NTA per security                                   portfolio value                                           gearing                         industrial facilities in
                                                                                                                                             Brisbane in off-market
                                                                                                                                             transactions
   8.92cps                                        4.7 years                                          6.1 years                             — 64,145m² of leasing deals
    distributions2                                         WALE3                                              WADE                           concluded
                                                                                                                                           — 99.6% of rent collected
   9.26cps                                             97.5%                                             2.84%                               excluding rent support
              FFO                                     occupancy3                                        funding cost                         arrangements, 98.3%
                                                                                                                                             including rent support
                                                                                                                                             arrangements
   8.64cps                                             6.02%                                        A$93.5m
            AFFO                                           WACR4                                      undrawn debt

1. Excludes the acquisition of 57-83 Mudgee Street and Lot 24 Dunhill Crescent which were announced post the reporting date. 2. Pre WHT.
3. Weighted by gross property income. 4. Weighted by property value. 5. Includes A$45.4m deployed post the reporting date.
Successful management internalisation

— Completion of the internalisation transaction comprising the
  acquisition of:
   — management rights of IAP
   — investment and management rights of the TAP Fund
   — asset management rights to third party mandates
— Investment of up to A$30 million in the TAP Fund
— Benefits include:
   — alignment of interest
   — continuity of management
   — diversification of income streams
   — establishment of third party funds management platform
— Rebranded to Irongate Group

                                                                 / 4
Established a third party funds
management platform

— Platform comprises:
   — the TAP Fund
   — third party mandates (including Investec Group assets)
— AUM of A$1.75 billion
— Focusing on unlisted real estate private equity funds, joint ventures
  and mandates
— Utilising the management teams’ skills across multiple asset classes
— IAP benefits from:
   — investment management fees
   — asset management fees
   — performance fees
   — return on capital from co-investments
— Strategy to grow product offering and AUM over time
02 —
Property portfolio

/ 7

Metropolitan office and industrial properties outperforming

                                                                         TOTAL1               OFFICE INDUSTRIAL                                     Sector spread¹,²
  Properties (#)                                                                  32                    12                       20
  Valuation (A$b)                                                             1.237              0.820                      0.417
  Area (m2)                                                             345,787              136,320                  209,467                                                                        Office                  68%
  Occupancy (%)2,3                                                             97.5                 97.9                     96.6                                                                    Industrial 32%
  WALE (years)2,3                                                                4.7                  4.4                       5.3
  Leases expiring after 5 years (%)2,3                                         38.9                 27.4                     63.9
  WARR (%)2,3                                                                    3.4                  3.4                       3.3
  WACR (%)4                                                                    6.02                  6.12                     5.83                   Geographic spread¹,²
                                                                                                                                                                                                     NSW                     37%
                                                                                                                                                                                                     VIC                     16%
                                                                                                                                                                                                     QLD                     14%
                                                                                                                                                                                                     ACT                     10%
                                                                                                                                                                                                     WA                       5%
                                                                                                                                                                                                     SA                       3%
                                                                                                                                                                                                     NT                       3%
                                                                                                                                                                                                     NZ                      12%
1. Excludes the acquisition of 57-83 Mudgee Street and Lot 24 Dunhill Crescent which were announced post the reporting date. 2. Weighted by gross property income. 3. Excludes signed HoAs. 4. Weighted by property value.
/ 8

 Acquisition of four industrial facilities for A$60.6 million
                                                                       197 BELCONNEN 153 MAIN BEACH ROAD,                                                     57-83 MUDGEE STREET,                                   LOT24 DUNHILL
                                                                  CRESCENT, BRENDALE         PINKENBA QLD                                                            KINGSTON QLD¹                                       CRESCENT,
                                                                                   QLD                                                                                                                             MORNINGSIDE QLD¹
 Purchase price (A$)                                                        15,624,000²          24,750,000                                                                 14,320,000³                                   5,932,000⁴
 Initial yield (%)⁵                                                                6.25                 5.29                                                                        5.73                                        6.02
 Area (m²)                                                                        9,300                1,852                                                                      5,520                                         1,016
 Occupancy (%)⁶                                                                     100                  100                                                                         100                                          100
 WALE at acquisition date (years)⁶                                                   6.0                  7.0                                                                         8.8                                        10.0
 WARR (%)⁶                                                                           2.8                  3.5                                                                         2.8                                          3.0
 Tenants                                                               4WD Supacentre                 Grays                                                        Construction Services                                           3M
                                                                                                                                                                         Waco Kiwkform

197 Belconnen Crescent                                                                                                                                          153 Main Beach Road

 1. Announced post the reporting date. 2. Represents “as if complete” value including land acquisition cost of A$3,885,500. 3. Represents “as if complete” value including land acquisition cost of A$3,050,000. 4. Represents “as if complete” value
 including land acquisition cost of A$1,252,000. 5. Pre transaction costs. 6. Weighted by gross property income.
Active asset management driving                                                                        — 64,145m² of space leased or
                                                                                                         subject to signed HoAs
leasing outcomes
                                                                                                       — 10,880m² of vacant space
                                                                                                         across the portfolio,
SIGNED LEASES                          COUNT (#)                AREA (m2) WALE (YEARS)1   WARR (%)1      7,650m² of which is subject
Office
                                                                                                         to signed HoAs
Renewal                                              22                27,106       4.8         3.13
New tenant                                           10                 7,402       8.1        2.89    — 80% retention rate¹,²—of the
Total office                                         32               34,508        5.6        3.08      11,573m² of space that
Industrial
                                                                                                         became vacant, 9,197m² has
Renewal                                               3                14,229       4.3        3.72
New tenant                                            –                     –         –           –
                                                                                                         been re-leased or is subject
Total industrial                                      3                14,229       4.3        3.72      to signed HoAs
Total signed leases                                  35                48,737       5.4        3.14
                                                                                                       — Continued focus on early
                                                                                                         renewal of leases
SIGNED HoAs                            COUNT (#)                AREA (m2) WALE (YEARS)1   WARR (%)1
Office
Renewal                                                4                 1,321      4.2        2.96
New tenant                                             3                 1,481      5.6        3.20
Total office                                           7                2,802       5.0        3.09
Industrial
Renewal                                               1                5,246       12.5        3.25
New tenant                                            1                7,360       15.0        3.00
Total industrial                                      2               12,606       13.2        3.18
Total signed HoAs                                     9               15,408       10.8        3.15
Total                                                44               64,145        6.7        3.15

1. Weighted by gross property income. 2. Includes early renewal of leases.
/ 10
Key metrics for leases signed during the period
Movements in WALE1,2,3 Rental spreads1,2,3
PROPERTY MAR-21 MAR-20 VARIANCE
(YEARS) (YEARS) (YEARS) (%)
35–49 Elizabeth Street 4.7 1.6 3.1 Office 2.2
21–23 Solent Circuit 4.3 2.7 1.6 Industrial 1.4
2 Richardson Place 4.6 3.4 1.2 Total 1.3
57 Sawmill Circuit 5.3 1.3 4.0
67 Calarco Drive 6.5 3.9 2.6
Portfolio 4.7 4.5 0.2
Movements in occupancy1,2,3 Incentives1,2,3
PROPERTY MAR-21 MAR-20 VARIANCE
(%) (%) (%) (%)
24 Sawmill Circuit 0 100.0 100.0 Office 15.6
2404 Logan Road 65.2 100.0 34.8 Industrial 9.7
20 Rodborough Road 98.6 89.7 8.9 Total 13.4
Portfolio 97.5 99.0 1.5
1. Excludes the acquisition of 57-83 Mudgee Street and Lot 24 Dunhill Crescent which were announced post the reporting date. 2. Weighted by gross property income. 3. Excludes signed HoAs./ 11
Manageable near term expiries1,2,3
KEY EXPIRIES % %
FY22 Government Property NSW 1.8 40
38.9%
Paynter Dixon 1.1
FY23 Commonwealth of Australia 3.0 35
Toll Transport 1.3
30
FY24 Probe 2.3
Coil Steels 1.7
21.6%
25
20.2%
FY25 Carsales.com 4.5
19.1%
18.7%
Commonwealth of Australia 3.6
20
FY26 State Government of Vic 2.8
Ricoh Australia 2.4
11.6%
15
9.5%
9.4%
8.6%
7.0%
7.1%
6.5%
6.5%
10
3.0%
2.5%
2.5%
2.4%
2.4%
5
1.5%
1.0%
0.0%
0
Vacant FY22 FY23 FY24 FY25 FY26 FY27+
Office Industrial Total
1. Excludes the acquisition of 57-83 Mudgee Street and Lot 24 Dunhill Crescent which were announced post the reporting date. 2. Weighted by gross property income. 3. Excludes signed HoAs./ 12
High quality tenant base
TOP 10 TENANTS¹,² (%) TENANT TYPE¹,² TOTAL OFFICE INDUSTRIAL
(%) (%) (%)
Commonwealth of Australia 9.1 Australian corporate 23.9 17.1 38.8
Carsales.com 4.5 Foreign listed 23.2 27.0 15.1
Honeywell 3.4 Australian listed 15.0 11.6 22.7
Vulcan Steel 3.0 Multinational 9.3 5.9 16.6
CTI Freight Systems 2.9 Federal government 9.1 13.2 0.0
Northline 2.8 SME 7.8 8.2 6.8
State Government of Victoria 2.8 State government 5.1 7.5 0.0
Pharmaxis 2.6 Foreign government 5.0 7.3 0.0
Toll Transport 2.4 Not for profit 1.6 2.2 0.0
Ricoh Australia 2.4 100.0 100.0 100.0
35.9
INDUSTRY TYPE¹,² TOTAL OFFICE INDUSTRIAL
(%) (%) (%)
Government
Technology
19.2
17.0
28.1
22.9
0.0
4.1
Impact of COVID-19
Industrials 15.4 2.8 42.9 — 35 rental relief arrangements agreed, the majority at 324
Healthcare 13.4 15.7 8.2 Queen Street in Brisbane and 100 Willis Street in Wellington
Financials/professionals 11.2 16.3 0.0
— No tenants currently receiving rent support
Consumer staples 6.6 1.9 16.8
Materials 6.5 0.2 20.1 — A$0.7 million of rent support provided and A$1.1 million of
Real estate 4.2 6.1 0.0 deferred rent, the majority of which has been collected
Consumer discretionary 4.0 2.5 7.7
— 99.6% of rent collected between 1 April 2020 and 31 March
Retail 1.0 1.4 0.0
Energy 0.6 0.9 0.0
2021 excluding rent support arrangements, 98.3% including
Communication services 0.6 0.9 0.0 rent support arrangements
Other 0.3 0.3 0.2
100 100 100
1. Excludes the acquisition of 57-83 Mudgee Street and Lot 24 Dunhill Crescent which were announced post the reporting date. 2. Weighted by gross property income./ 13
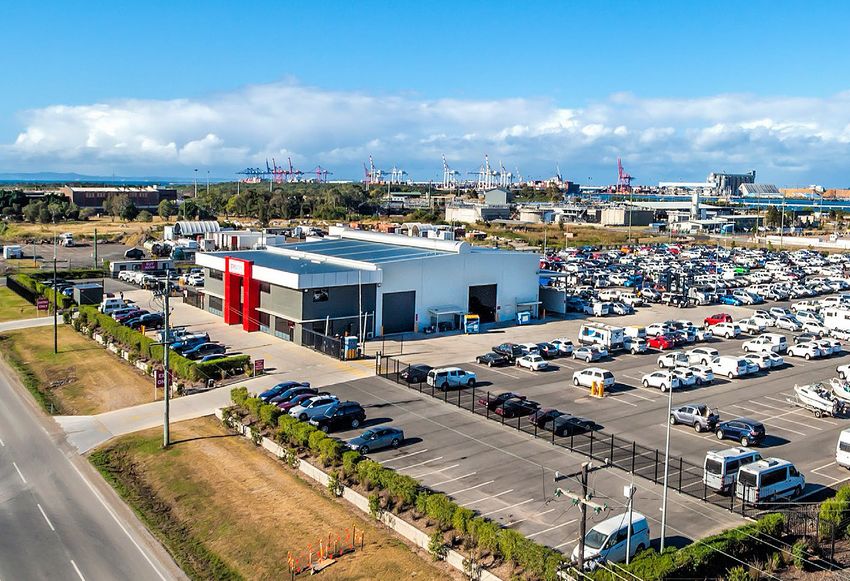
ESG
— Environmental highlights:
— implemented portfolio wide data management system
— improved NABERS energy and water ratings
— undertook various capital projects to improve
building efficiencies
— committed to obtaining a GRESB rating and CDP score
— Social highlights:
— exceeded gender diversity targets across the business
— implemented employee wellness initiatives
— continued support of selected charitable organisations
— Governance highlights:
— greater transparency in relation to remuneration and board
nominations and appointments
— maintained majority independent board
— Issued first sustainability report03 — Financial information
/ 15

Summary of financial results

          8.92cps              A$1.43             6.1 years
              distributions1   NTA per security       WADE

          9.26cps              A$1.49              2.84%
                  FFO          NAV per security     funding cost

         8.64cps               27.8%               78.3%
                 AFFO              gearing            hedged

1. Pre WHT.
/ 16
Distribution analysis COMPONENTS OF FFO (A$m) 31 MAR 21 31 MAR 20
Total comprehensive income attributable
159.41 59.0
to securityholders
8.92cps Adjusted for
Non-FFO tax (3.0) –
distribution
Fair value adjustments (110.7) (5.5)
pre-WHT
Straight-line rental revenue adjustment (1.2) (4.4)
8.05cps Amortisation of incentives
Cost on sale of investment property
1.4
2.0
1.5
–
distribution Other one-off items 8.02 5.3
post-WHT
FFO 56.6 55.9
Maintenance capital expenditure (1.8) (2.1)
2%-3% Leasing fees and cash incentives (2.0) (1.3)
distribution AFFO 52.8 52.4
growth guided Weighted average securities (#) 611.3 571.4
for FY224 Basic and diluted earnings per security (cents) 26.08 10.32
FFO (cps) 9.26 9.78
AFFO (cps) 8.64 9.17
Distributions (cps) 8.92 8.883
Distribution as a percentage of FFO (%) 96.3 90.8
Distribution as a percentage of AFFO (%) 103.3 96.8
1. The consolidated comprehensive income of IPF I and IPF II for the period 1 April 2020 to 31 March 2021. 2. Costs associated with the internalisation of IPF I's management function 3. Annualised distribution as a result of the Fund
listing on the ASX part way through a distribution period, where a special distribution was paid to securityholders for the period 1 April 2019 to 27 May 2019 (as disclosed in the product disclosure statement issued in May 2019 as part
of the ASX listing). 4. The higher end of the range dependent on securing additional commitments and deployment for the TAP Fund. The Fund’s policy is to pay out between 80% and 100% of FFO, with an expectation for FY22 to be
in the middle of the target range. This forecast is based on the assumptions that the macro-economic environment will not deteriorate markedly, no tenant failures will occur, and budgeted renewals will be concluded. Budgeted
rental income is based on in force leases, contractual escalations and market-related renewals.A$
1.00
1.10
1.30
1.50
1.20
1.40
31 March 2020
1.32
NTA bridge
Distributable
0.09
income
Distributions
paid/payable
(0.09)
Property
0.19
revaluations
Management
rights acquired
(0.06)
Transaction costs written off
(internalisation transaction
(0.02)
and new acquisitions)
31 March 2021
1.43
/ 17Valuation summary
A$m MAR-21 MAR-20 MOVEMENT2
Industrial 381 322 18.3%
Office 820 763 8.5%
Acquisitions 36 -
Portfolio¹ 1,237 1,085 14.7%
Office portfolio Industrial Total portfolio
weighted portfolio weighted
average weighted average average
cap rate cap rate cap rate
6.12% 5.83% 6.02%
Mar-20: 6.46% Mar-20: 6.83% Mar-20: 6.57%
Sep-21: 6.38% Sep-21: 6.66% Sep-21: 6.46%
1. Excludes the acquisition of 57-83 Mudgee Street and Lot 24 Dunhill Crescent which were announced post the reporting date. 2. YoY / 18
change is calculated using NZ$ value for 100 Willis Street, Wellington to exclude the currency impact in the movement.— WADE of 6.1 years
— WASE of 7.0 years
Debt and swap expiry profile — 78.3% of debt fixed
or hedged
A$m
160 — A$93.5 million of undrawn
debt available
140
120
100
80
60
40
20
-
FY22 FY23 FY24 FY25 FY26 FY27 FY28 FY29 FY30
Drawn Undrawn Fixed rate debt Swap04 — Summary
Summary

— Delivered strong financial result in line with guidance provided as
  part of the internalisation transaction, despite challenging market
  conditions
— Portfolio consisting of metropolitan office and industrial properties,
  which have performed strongly
— Significant leasing activity during the period driven by active
  asset management
— Solid tenant base delivering high level of rent collection
— Increased focus on ESG initiatives
— Management internalisation has delivered multiple benefits, including
  greater accountability to securityholders
— Establishment of a funds management platform to supplement
  the direct real estate portfolio
— Targeting distribution growth of between 2% and 3% for FY221

1. The higher end of the range dependent on securing additional commitments and deployment for the TAP Fund. The Fund’s policy is to
pay out between 80% and 100% of FFO, with an expectation for FY22 to be in the middle of the target range. This forecast is based on the   21
assumptions that the macro-economic environment will not deteriorate markedly, no tenant failures will occur, and budgeted renewals will
be concluded. Budgeted rental income is based on in force leases, contractual escalations and market-related renewals.
05 —
Appendices
/ 23

Asset growth1
  A$m

          1,400
          1,200
          1,000                                                                                                                                                                               417
                                                                                                                                                          240      249      322      329
                                                                                                                                        216      239
            800
                                                                                                                   182         185
            600
            400                                                                           158          161                                                823      850                        820
                                                                                                                                        771      774                        763      771
                                                                  95         129                                  597          625
            200             47            49        49                                                374
                                                                247          249         336
                            83            105        131
                 0
                          (JSE Listing)

                                                                                                                                                                                     Sep-20
                                                                                                                                        Mar-18

                                                                                                                                                          Mar-19
                                          Mar-14

                                                                                            Mar-16
                                                      Sep-14

                                                                                                        Sep-16

                                                                                                                     Mar-17

                                                                                                                               Sep-17

                                                                                                                                                 Sep-18

                                                                                                                                                                   Sep-19

                                                                                                                                                                            Mar-20

                                                                                                                                                                                              Mar-21
                                                                   Mar-15

                                                                               Sep-15
                             Oct-13

OFFICE                             2           3           4           6           6            7           8           11       12       12      12       13       13       12       12       12
INDUSTRIAL                         6           6           6          10          12           12          12          13        13       14      15       15       18       18       18      20
Total # of
                                  8            9         10           16          18           19         20           24       25       26       27       28       31      30       30       32
properties
1. Excludes the acquisition of 57-83 Mudgee Street and Lot 24 Dunhill Crescent which were announced post the reporting date.
/ 24
Property landscape1
QLD
12 20
2 Office
NT 4 Industrial
1 Industrial
NSW
WA NZ
SA 5 Office 1 Office
2 Industrial
4 Industrial
2 Industrial
VIC
ACT
2 Office
2 Office
3 Industrial
4 Industrial
1. Excludes the acquisition of 57-83 Mudgee Street and Lot 24 Dunhill Crescent which were announced post the reporting date./ 25
Property portfolio—industrial
OWNERSHIP AREA BOOK VALUE VALUE CAP RATE OCCUPANCY WALE
STATE (%) (m²) (A$m) (/m²) (%) (%) (YEARS)
47 Sawmill Circuit, Hume ACT 100% 5,535 12.7 2,294 6.25 100 5.3
57 Sawmill Circuit, Hume ACT 100% 7,079 13.9 1,964 6.25 100 5.3
24 Sawmill Circuit, Hume1 ACT 100% 7,350 14.5 1,973 4.88 0 0.0
44 Sawmill Circuit, Hume ACT 100% 4,639 10.5 2,264 7.25 100 1.5
2-8 Mirage Road, Direk SA 100% 6,762 8.8 1,294 7.50 100 1.5
30-48 Kellar Street, Berrinba QLD 100% 4,102 9.5 2,316 6.25 100 2.6
165 Newton Road, Wetherill Park NSW 100% 12,529 33.5 2,674 4.50 100 9.8
24 Spit Island Close, Newcastle NSW 100% 5,257 12.0 2,283 6.00 100 9.8
67 Calarco Drive, Derrimut VIC 100% 7,149 12.3 1,721 5.50 100 6.5
66 Glendenning Road, Glendenning NSW 100% 16,461 38.3 2,324 4.50 100 8.6
85 Radius Drive, Larapinta QLD 100% 10,088 19.5 1,933 6.25 100 2.2
54 Miguel Road, Bibra Lake WA 100% 22,358 33.0 1,476 6.50 100 6.5
24 Rodborough Road, Frenchs Forest NSW 100% 7,198 24.5 3,404 6.63 100 3.1
6-8 and 11 Siddons Way, Hallam VIC 100% 15,504 23.8 1,532 5.25 100 4.2
36-42 Hydrive Close, Dandenong South VIC 100% 14,635 25.7 1,756 5.00 100 4.1
103 Welshpool Road, Welshpool WA 100% 5,246 30.0 5,719 5.75 100 7.2
46-70 Grand Trunkway, Gillman SA 100% 31,589 29.0 918 6.25 100 6.8
16 Dawson Street, East Arm NT 100% 14,835 29.4 1,982 7.75 100 6.4
197 Belconnen Crescent, Brendale2 QLD 100% 9,300 11.6 1,247 5.75 100 6.5
131-153 Main Beach Road, Pinkenba QLD 100% 1,852 24.8 13,364 5.25 100 7.0
Industrial portfolio 209,467 417.1 5.83 96.6 5.5
1. Valuation based on lease in agreed form to be executed 2. Investment property under development./ 26
Property portfolio—office
OWNERSHIP AREA BOOK VALUE VALUE CAP RATE OCCUPANCY WALE
STATE (%) (m²) (A$m) (/m²) (%) (%) (YEARS)
449 Punt Road, Cremorne VIC 100% 6,719 61.5 9,154 5.50 100 3.5
35-49 Elizabeth Street, Richmond VIC 100% 12,511 104.5 8,353 5.50 98 4.6
2404 Logan Road, Eight Mile Plains QLD 100% 3,637 17.0 4,674 8.00 65 1.7
186 Reed Street, Greenway ACT 100% 5,407 25.3 4,670 7.50 100 1.9
21-23 Solent Circuit, Baulkham Hills NSW 100% 10,820 68.0 6,285 6.25 100 4.3
266 King Street, Newcastle NSW 100% 13,870 81.5 5,876 6.75 100 2.9
113 Wicks Road, Macquarie Park NSW 100% 6,199 33.0 5,323 5.63 100 2.7
324 Queen Street, Brisbane QLD 50% 19,364 79.0 4,080 6.00 93 4.1
20 Rodborough Road, Frenchs Forest NSW 100% 13,023 66.0 5,068 6.13 99 5.8
2 Richardson Place, North Ryde NSW 100% 15,241 110.0 7,218 5.88 100 4.6
100 Willis Street, Wellington NZ 100% 24,810 143.6 5,788 6.25 100 5.2
24 Wormald Street, Symonston ACT 100% 4,720 30.5 6,462 6.50 100 6.4
Office portfolio 136,320 819.9 6.12 97.9 4.3
Total¹ 345,787 1,237.0 6.02 97.5 4.7
1. Excludes the acquisition of 57–83 Mudgee Street and Lot 24 Dunhill Crescent which were announced post the reporting date./ 27 Income statement A$'000 MAR-211 MAR-20 CHANGE CHANGE (%) Property revenue 92,676 101,103 (8,427) (8.3) Interest income 55 90 (35) (38.9) Other income 1,232 7 1,225 1,7211.4 Share of equity accounted profit/(loss) (707) - (707) - Total revenue and other income 93,256 101,200 (7,944) (7.9) Property expenses (20,715) (21,341) 626 (2.9) Finance costs (8,491) (12,774) 4,283 (33.5) Other operating expenses (8,621) (8,314) (307) 3.7 Transaction costs (7,715) (5,339) (2,376) 44.5 Total expenses (45,542) (47,768) 2,226 (4.7) Fair value adjustments and sale of investment property costs 108,728 5,524 103,204 1,868.2 Profit before tax 156,442 58,956 97,486 165.4 Income tax benefits 2,957 - 2,957 - Profit after tax 159,399 58,956 100,443 170.4 1. The consolidated comprehensive income of IPF I and IPF II for the period 1 April 2020 to 31 March 2021.
/ 28

Balance sheet
A$'000                                       AS AT 31 MARCH 2021     AS AT 31 MARCH 2020
ASSETS
Non-current assets                                     1,285,909               1,084,958
Investment properties                                  1,225,356               1,084,958
Investment property under development                      11,600                        –
Property, plant and equipment                                 661                        –
Intangible assets                                         39,528                         –
Equity accounted investments                                5,807                        –
Deferred tax assets                                         2,957                        –
Current assets                                             13,067                 115,594
Cash and cash equivalents                                   7,405                   17,128
Receivables and other assets                                5,662                   4,466
Property held for sale                                          –                 94,000
Total assets                                           1,298,976               1,200,552
EQUITY AND LIABILITIES
Equity                                                   913,033                  808,161
Non-current liabilities                                  348,925                 353,669
Long-term borrowings                                     339,063                 345,487
Trade and other payables                                    9,026                   4,845
Financial instruments held at fair value                      836                   3,337
Current liabilities                                        37,018                  38,722
Trade and other payables                                    9,322                   12,417
Distributions payable                                     27,696                  26,305
Total equity and liabilities                           1,298,976               1,200,552
Number of securities in issue                             611,298                 611,298
Net tangible asset value per security (A$)                    1.43                    1.32
/ 29

Glossary of terms

TERM      MEANING                                                                       TERM               MEANING

A$        Australian dollars.                                                           JSE                JSE Limited and, where applicable, the exchange operated by JSE
AFFO      Adjusted funds from operations, calculated in line with the Property                             Limited in accordance with its licence under the Financial Markets

          Council Guidelines, being FFO adjusted for maintenance capital                                   Act, No. 19 of 2012 of South Africa.

          expenditure, cash and cash equivalent incentives (including rent free         NABERS             National Australian built environment rating system.
          incentives) given to tenants during the period and other one-off items        NTA                Net tangible assets.
          which have not been adjusted in determining FFO.
                                                                                        NZ$                New Zealand dollars.
ASX       ASX Limited and, where applicable, the Australian securities exchange
          operated by ASX Limited.                                                      Property Council   Version 2 of the Property Council of Australia’s “Voluntary Best
                                                                                        Guidelines         Practice Guidelines for Disclosing FFO and AFFO”, published in
AUM       Assets under management.
                                                                                                           December 2017 and available at www.propertycouncil.com.au.
cps       Cents per security.
                                                                                        TAP Fund           A fund comprised of Templewater Australia Property I L.P.,
ESG       Environmental, social and governance.                                                            Templewater Australia Property Fund I Head Trust and various sub
                                                                                                           trusts that have been established (or may be established from time
FFO       Funds from operations calculated in accordance with the Property                                 to time).
          Council Guidelines, determined by adjusting statutory net profit (under
                                                                                        WACR               The average capitalisation rate across the Fund’s portfolio or group
          Australian Accounting Standards) for non-cash and other items such as
                                                                                                           of properties, weighted by property value.
          property revaluations, derivative mark-to-market impacts, amortisation
          of tenant incentives, gain/loss on sale of investment properties, straight-   WADE               The weighted average expiry of the Fund’s debt facilities.
          line rental revenue adjustments, non-FFO tax expenses/benefits and            WALE               The average lease term remaining to expiry across the Fund’s
          other unrealised one-off items.                                                                  portfolio or a property or group of properties, weighted by gross
Fund or   Irongate Group, comprising Irongate Property Fund I and Irongate                                 property income.
IAP       Property Fund II.                                                             WARR               The average rent review across the Fund’s portfolio or a property or
FY        Financial year ended 31 March in the relevant year.                                              group of properties, weighted by gross property income.

gearing   Interest bearing liabilities (excluding debt establishment costs) less cash   WASE               The weighted average expiry of the Fund’s interest rate swaps.
          divided by the total value of investment properties.                          WHT                Withholding tax.
HoA       Heads of agreement.                                                           YoY                Year on year.
/ 30
Disclaimer
The material in this presentation has been prepared by This presentation may contain forward looking statements Unless otherwise specified all information is for the period to
Irongate Funds Management Limited (ABN 93 071 514 246; including statements regarding our intent, belief or current 31 March 2021. Certain financial information in this
AFSL 290 909) (IFM) and is general background information expectations with respect to IFM and the Fund’s activities and presentation is prepared on a different basis to the Fund’s
about the activities of Irongate Group, comprising Irongate operations, market conditions, results of operation and financial report, which is prepared in accordance with
Property Fund I (ARSN 162 067 736) and Irongate Property financial condition, specific provisions and risk management Australian Accounting Standards. Where financial information
Fund II (ARSN 644 081 309) (the Fund) and the Fund’s practices. The forward looking statements contained in the presented within this presentation does not comply with
activities current as at the date of this presentation. This presentation are based on the assumptions that the macro- Australian Accounting Standards, reconciliation to the
information is given in summary form and does not purport to economic environment will not deteriorate markedly, no statutory information is provided. This presentation provides
be complete. tenant failures will occur and budgeted renewals will be further detail in relation to key elements of the Fund’s
concluded. Budgeted rental income was based on in force financial performance and financial position. Any additional
Information in this presentation, including forecast financial leases, contractual escalations and market-related renewals. financial information in this presentation which is not included
information, should not be considered as advice or a Readers are cautioned not to place undue reliance on these in the Fund’s financial report was not subject to independent
recommendation to investors or potential investors in relation forward looking statements. Circumstances may change and audit or review by KPMG.
to holding, purchasing or selling securities or other financial the contents of this presentation may become outdated as a
products or instruments and does not take into account your result. IFM does not undertake any obligation to publicly Irongate Property Fund I was established in Australia and is
particular investment objectives, financial situation or needs. release the result of any revisions to these forward looking registered with the Australian Securities and Investments
statements to reflect events or circumstances after the date Commission as a managed investment scheme. The material
Before acting on any information you should consider the in this presentation relates to the portfolio of the Irongate
hereof to reflect the occurrence of unanticipated events.
appropriateness of the information having regard to these Property Fund I , which is registered as a foreign collective
While due care has been used in the preparation of forecast
matters, any relevant offer document and in particular, you investment scheme in terms of Section 65 of the Collective
information, actual results may vary in a materially positive or
should seek independent financial advice. Investment Schemes Control Act No. 45 of 2002 of South
negative manner. Forecasts and hypothetical examples are
subject to uncertainty and contingencies outside the control Africa and is operated by IFM. Irongate Property Fund II was
All securities and financial product or instrument transactions
of IFM and the Fund. Past performance is not a reliable established in Australia and is registered with the Australian
involve risks, which include (among others) the risk of
indication of future performance. Securities and Investments Commission as a managed
adverse or unanticipated market, financial or political
investment scheme. Irongate Property Fund II is exempted
developments and, in international transactions, currency
from the requirement to be registered as a foreign collective
risk. Past performance is not a reliable indicator of future
investment scheme in terms of Section 65 of the Collective
performance.
Investment Schemes Control Act No. 45 of 2002 of South
Africa and is operated by IFM
IFM is the issuer of units in Irongate Property Fund I and
Irongate Property Fund II. Irongate Property Fund I and
Irongate Property Fund II are listed on the JSE and the ASX.Sydney Level 13, 95 Pitt Street NSW 2000 Melbourne & Brisbane +61 2 7906 2000 info@irongategroup.com.au Irongategroup.com.au
You can also read